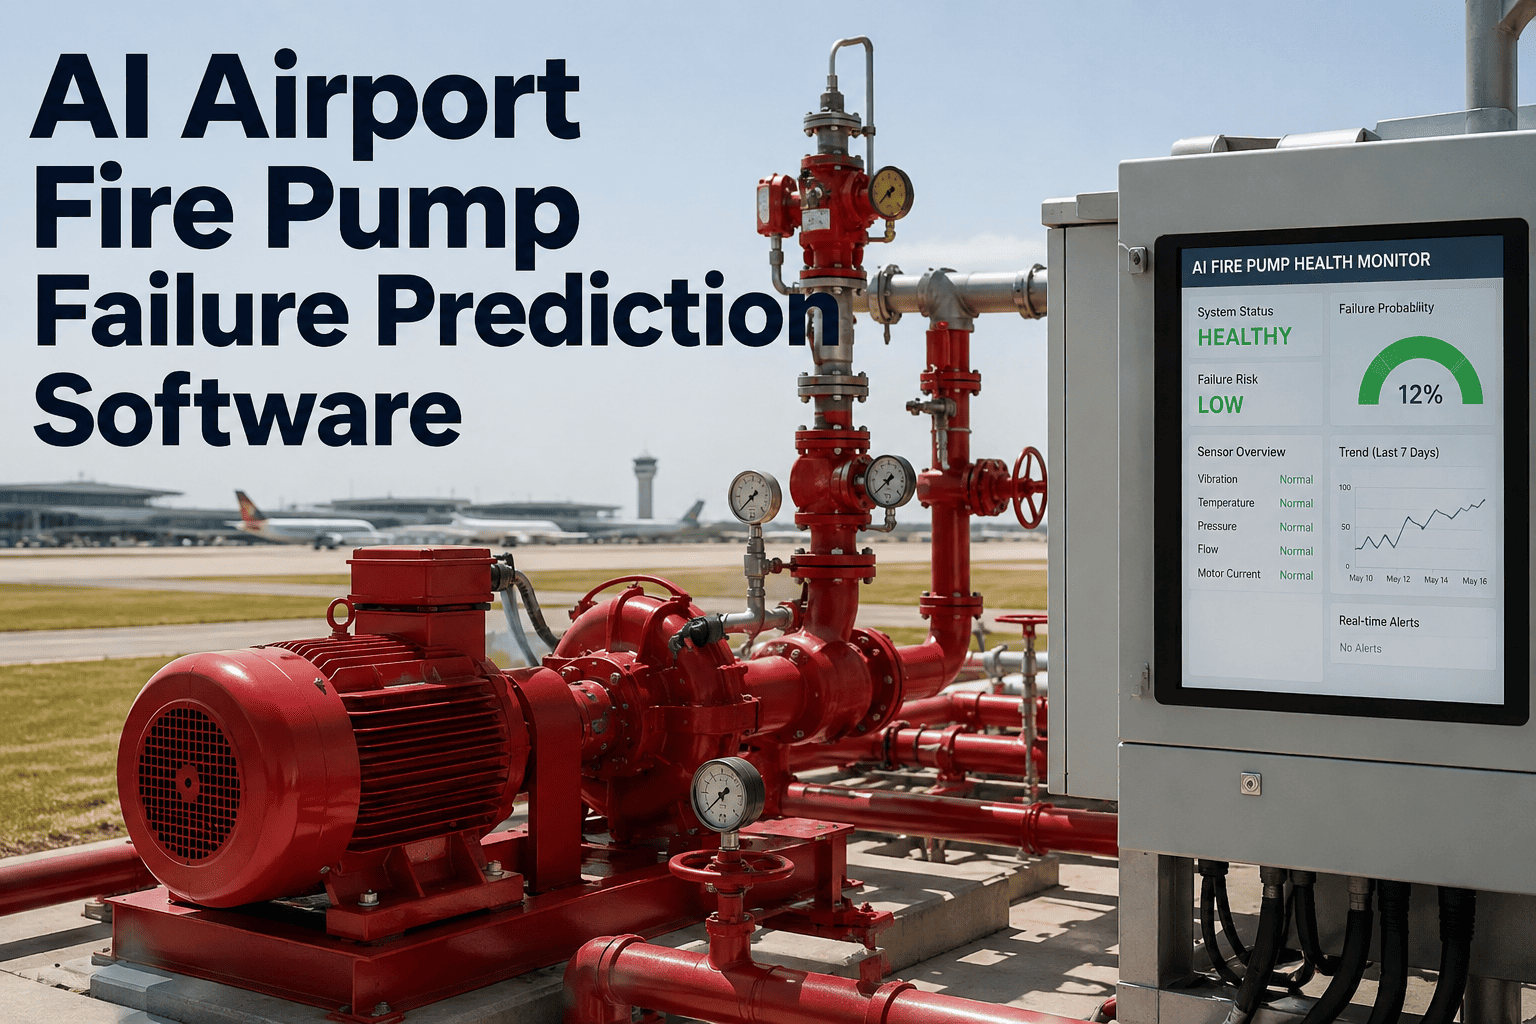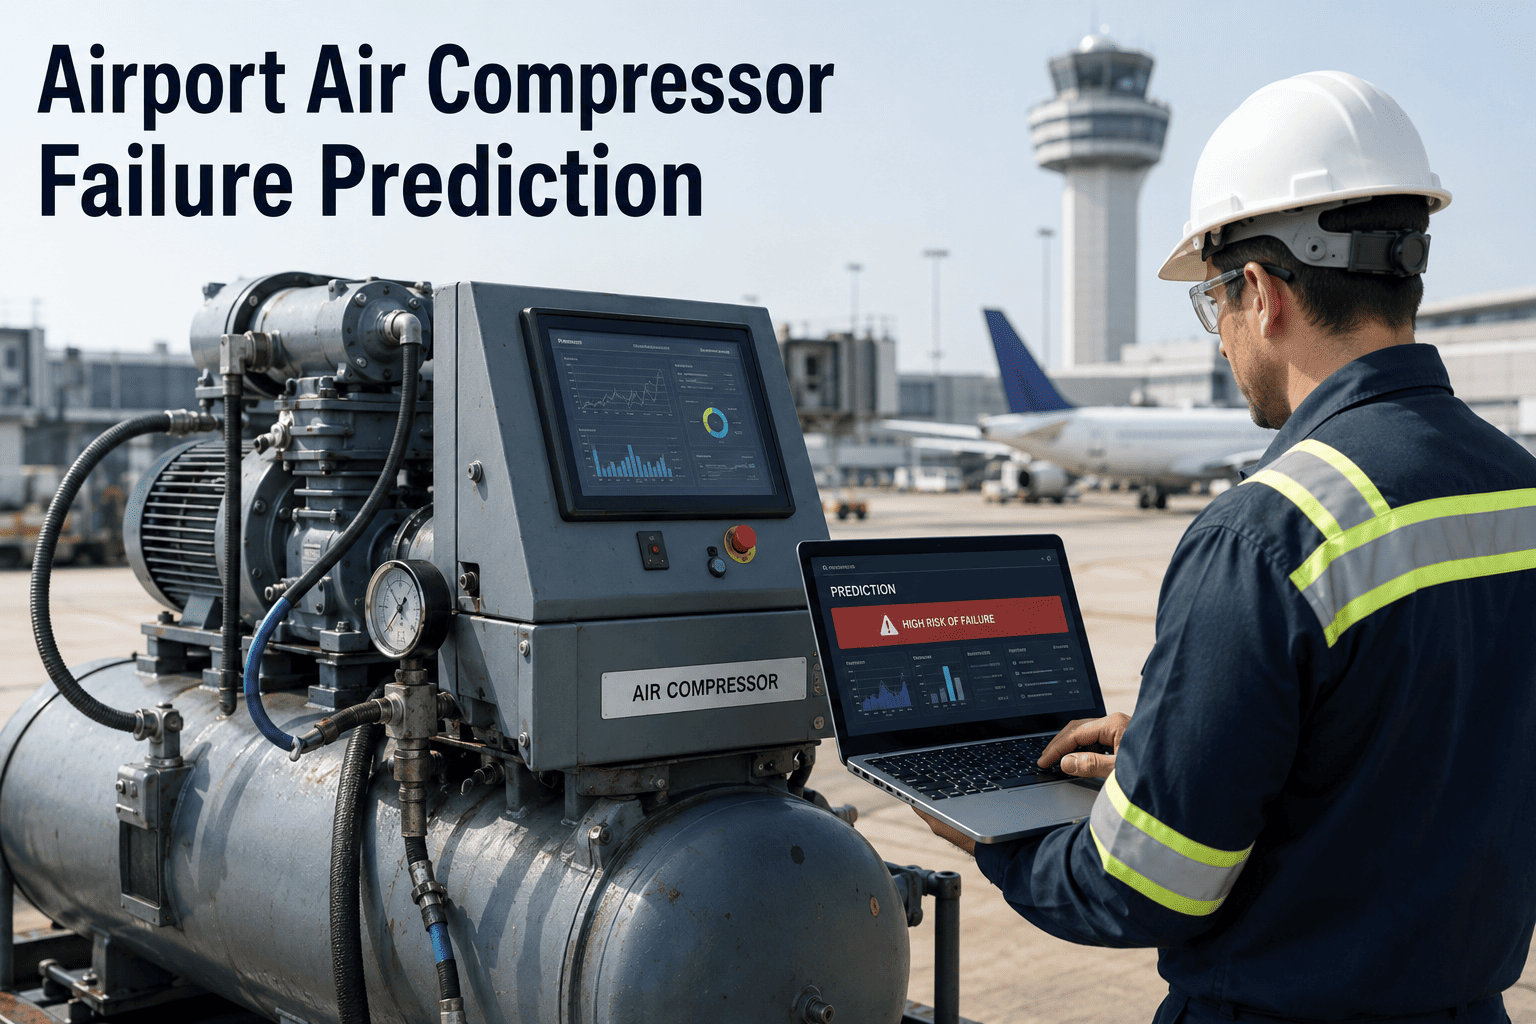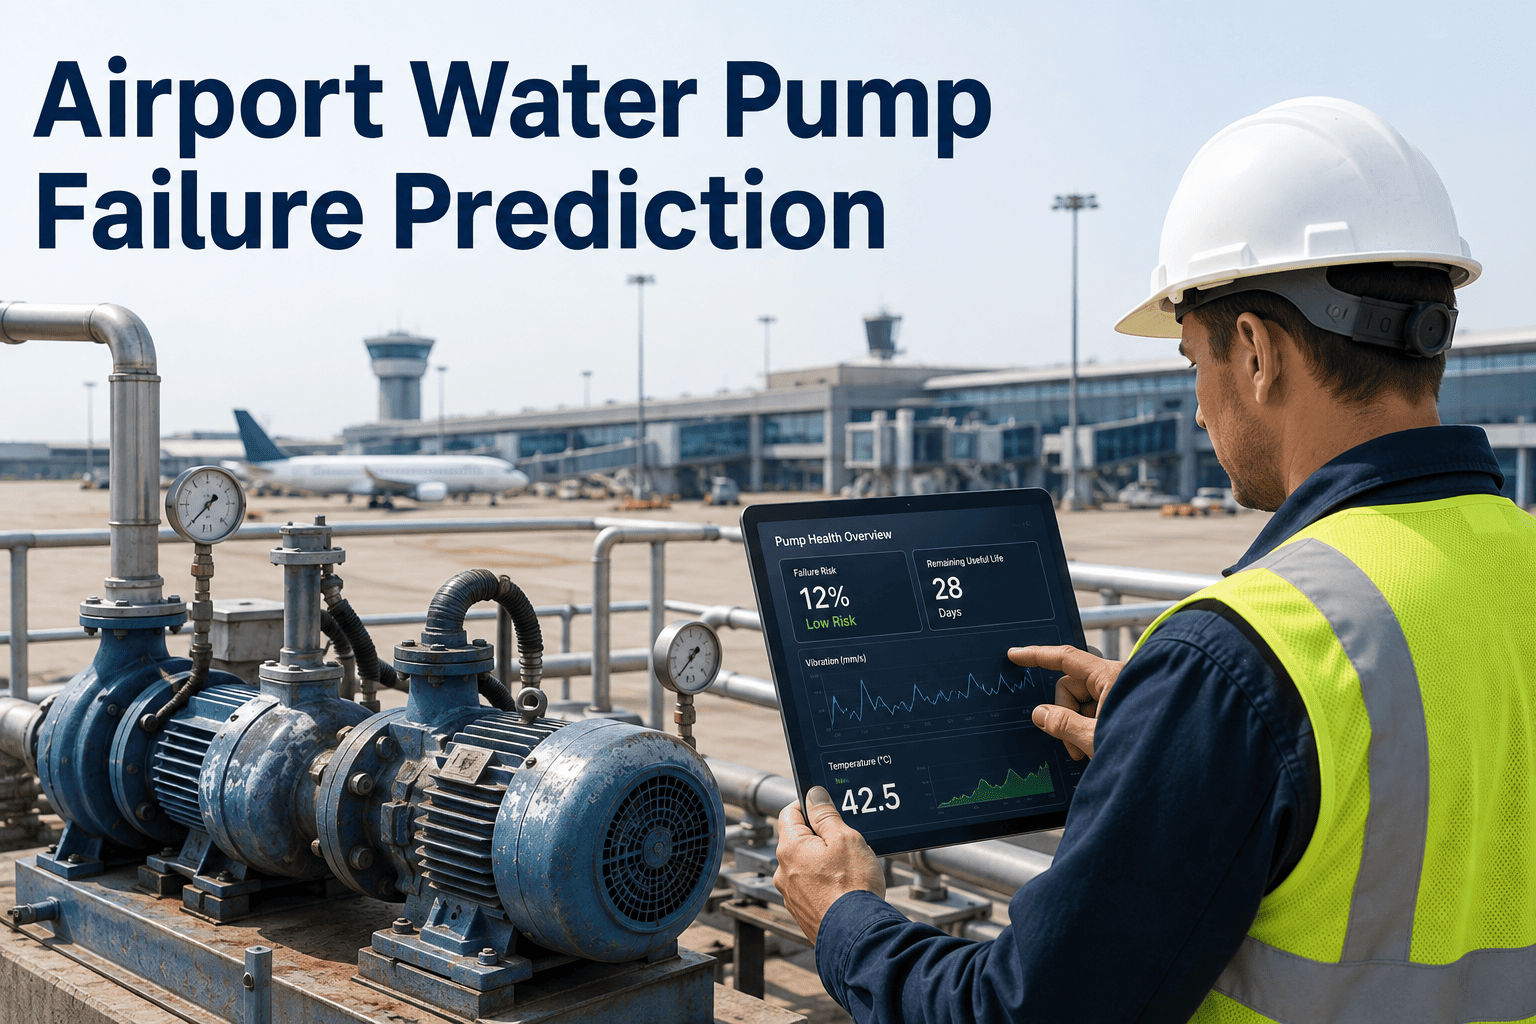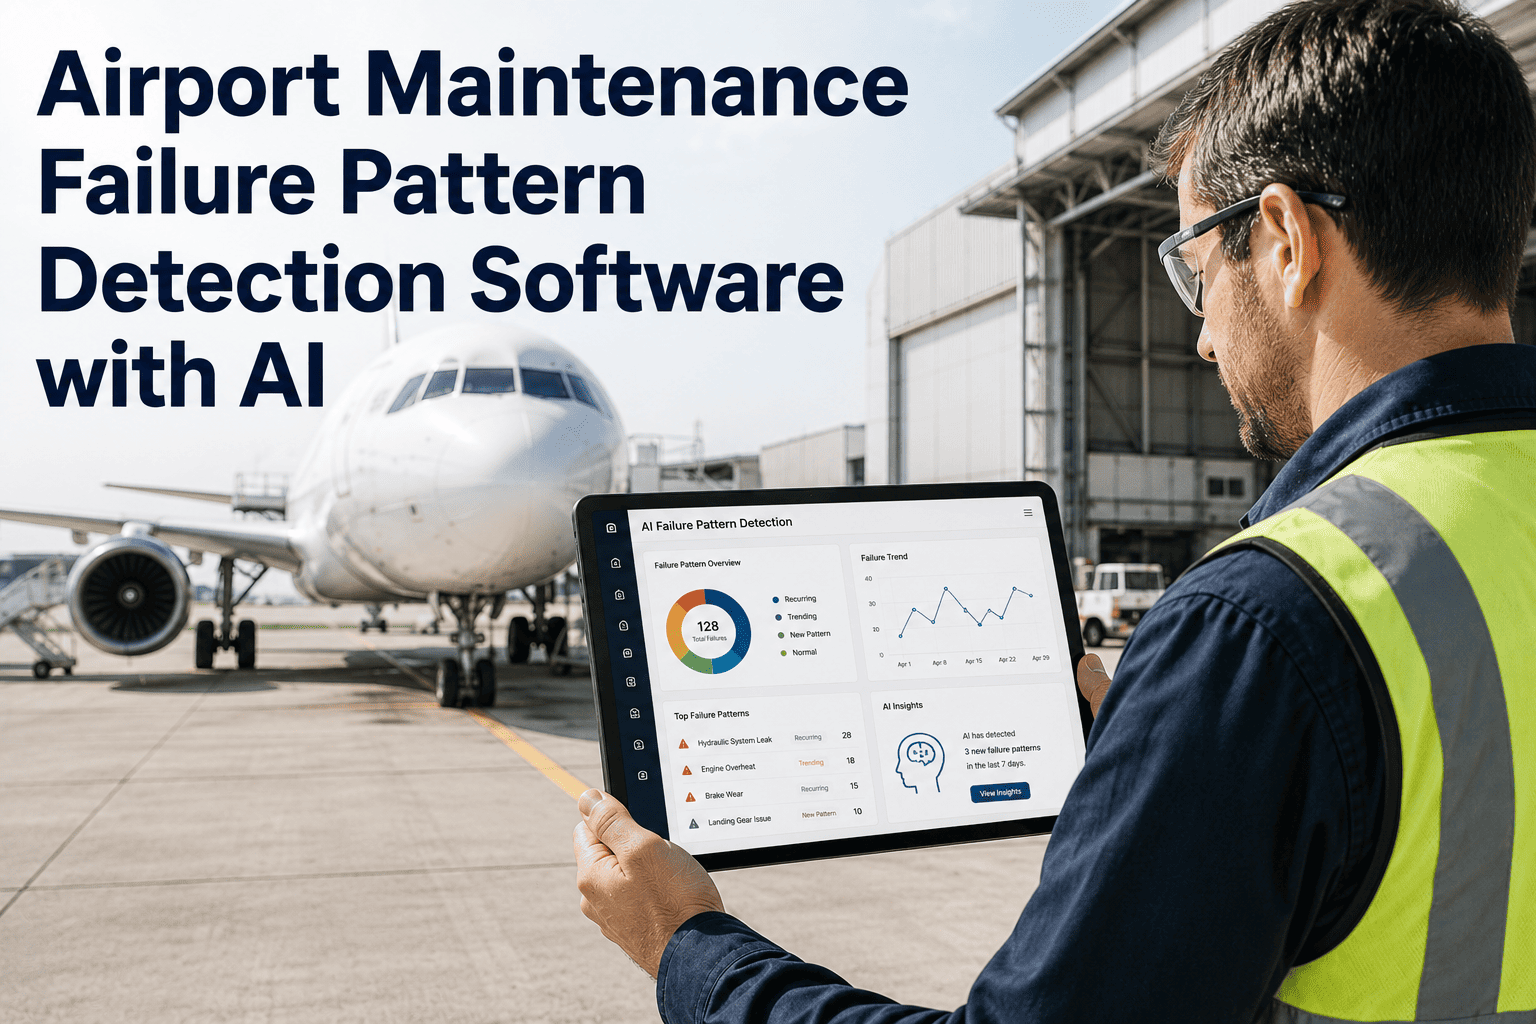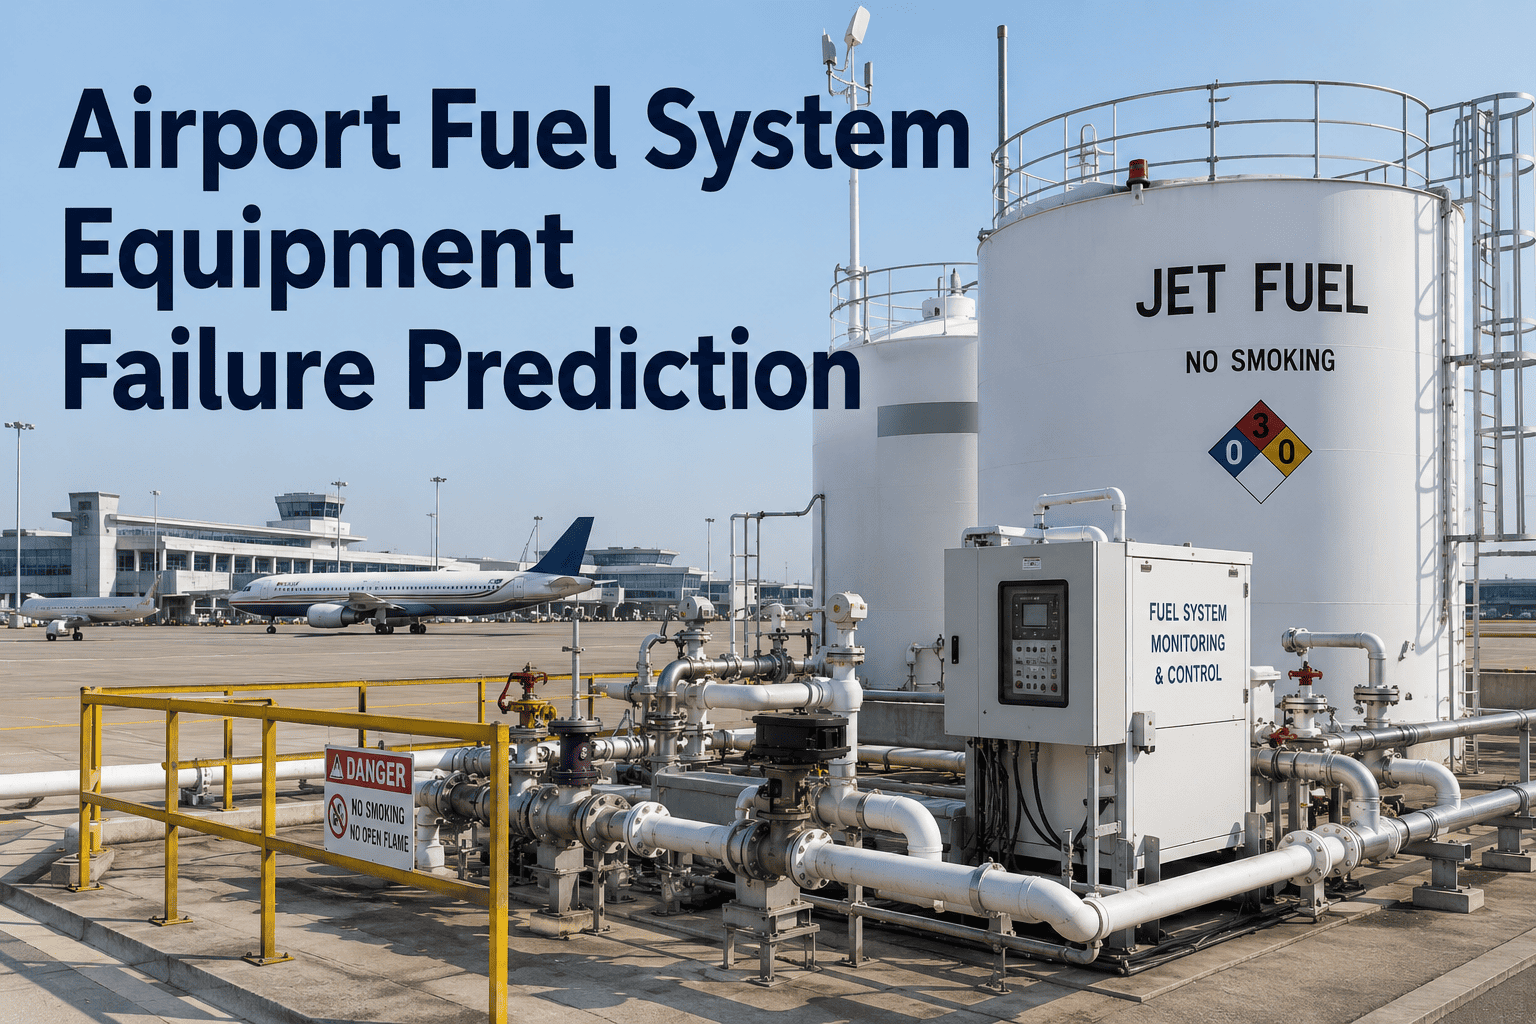
When a fuel hydrant pump fails without warning during a peak departure window at a major hub, the cascading cost extends far beyond a repair bill. Aircraft queue at gates, refueling trucks scramble to cover the gap, and every minute of unplanned downtime carries a price tag measured in tens of thousands of dollars. These failures send detectable signals for days or weeks before the equipment actually stops, but most airport fuel systems still inspect on a calendar rather than on actual asset condition. Book a demo to see how iFactory applies AI-driven condition monitoring to predict fuel system failures before they disrupt operations.
iFactory monitors pump vibration, pressure trends, flow meter drift, and valve response across your entire fuel system, turning raw sensor data into failure predictions you can act on days before a breakdown.
The Real Cost of Unplanned Fuel System Failures
Airport fuel systems operate under some of the most demanding conditions in industrial infrastructure. High flow rates, continuous operation, exposure to jet fuel chemistry, and strict regulatory standards create an environment where equipment degradation is inevitable. The question is not whether a pump, valve, or filter will fail, but whether your team will know about it before it takes down a section of your hydrant loop. Understanding the financial anatomy of an unplanned failure is the first step toward justifying a shift from calendar-based maintenance to condition-based prediction.
Six Critical Fuel System Components That Fail Without Warning
A modern airport fuel system is a network of interdependent components, and a failure in one node can cascade through the entire loop. Each component type has its own characteristic failure modes and its own set of detectable warning signals. The challenge for maintenance teams is that these signals are often subtle enough to be invisible to periodic manual inspection but obvious to continuous AI monitoring.
Hydrant Pumps
Bearing wear, seal degradation, impeller erosion, and coupling misalignment develop gradually over weeks. Vibration signature changes are the earliest indicator, often appearing two to four weeks before a pump becomes unable to maintain rated pressure. Without continuous monitoring, these changes go undetected until the pump trips on high vibration or low pressure during a critical fueling operation.
Filter Water Separators
Filter elements have a predictable service life under normal conditions, but contamination events, microbial growth, or unexpected particulate loading can cause differential pressure to spike well before the scheduled change interval. A clogged or bypassing filter separator allows water and particulates to pass downstream into aircraft fuel, creating a safety-of-flight issue that can ground multiple aircraft.
Motor-Operated Control Valves
Valve seat wear, actuator gearing degradation, and positioner drift cause valves to operate slowly, fail to fully close, or not reach their intended position. In a hydrant loop, a valve that does not fully seat can cause pressure bleed-through that affects fueling accuracy at downstream pits. These failures develop over months and are nearly impossible to detect during a manual valve exercise.
Mass Flow Meters
Flow meter drift from bearing wear in mechanical meters or sensor degradation in Coriolis meters leads to inaccurate fuel quantity delivery. Even a 0.5 percent drift on high-flow hydrant operations translates to thousands of liters of fuel discrepancy per day. Drift between proving intervals can persist for weeks, creating financial exposure and compliance risk.
Pressure Regulators
Regulator diaphragm fatigue, spring relaxation, and pilot valve wear cause outlet pressure to drift from setpoint. Overpressure risks hose blowouts and aircraft fuel system damage, while underpressure slows refueling operations and increases turnaround times. Continuous pressure trend monitoring catches regulator drift days before it reaches alarm thresholds.
Floating Suction Assemblies
In storage tanks, floating suction units keep the draw point near the surface to minimize water and sediment pickup. Swing arm bearing wear, float degradation, and guide cable issues cause the suction inlet to drop below the fuel-water interface, pulling contaminated fuel into the distribution system. This is a slow-developing failure that periodic inspections often miss.
The Failure Detection Gap: Reactive vs. Predictive
Consider the same pump bearing failure handled under two different maintenance philosophies. The failure mechanism is identical. The only difference is when the system becomes aware of it and how much time exists to respond. The comparison below traces the exact same failure from its earliest detectable signal through to resolution under each approach.
Bearing wear begins. Vibration rises 0.2 mm/s above baseline. No continuous monitoring in place to detect the change.
Vibration doubles. Pump still operates within alarm limits. No inspection scheduled until next quarterly round.
Brief vibration spike during peak demand period. Alarm acknowledged by operator. No maintenance action taken.
Pump trips on high vibration shutdown. Emergency callout initiated. Fueling operations at affected hydrant pits disrupted immediately.
Pump opened for inspection. Bearing failure confirmed. Replacement bearing not in local stock. Expedited shipping initiated.
Pump repaired and returned to service. Fourteen flights delayed. Total estimated loss exceeds $120,000 in direct and indirect costs.
AI detects 0.2 mm/s vibration rise above learned baseline. Risk score updated to low. Automated trend monitoring activated for this asset.
Accelerating wear pattern confirmed by multi-signal correlation. Risk score elevated to medium. Maintenance team receives notification with diagnostic detail.
Failure window predicted at 7 to 14 days. Work order auto-generated and scheduled for the next planned maintenance window ahead of the predicted failure.
Bearing replaced during planned downtime. Zero operational disruption. Total cost: planned maintenance labor and bearing, approximately $3,500.
How AI Predicts Fuel Equipment Failure in Five Stages
iFactory's predictive maintenance system does not guess. It follows a structured data pipeline that transforms raw sensor outputs into actionable failure predictions. Each stage adds a layer of intelligence that moves the system from simply recording data to actively forecasting equipment health with a specific failure mode and estimated time window.
Continuous Data Ingestion
Vibration sensors, pressure transducers, flow meters, temperature probes, and motor current monitors feed data into the AI platform at sampling rates matched to each signal type. High-frequency vibration data captures bearing and gear mesh frequencies, while slower pressure and flow signals track performance trends. All data is timestamped and correlated to equipment operating state, fuel demand level, and ambient conditions.
Signal Processing and Feature Extraction
Raw signals are filtered, normalized, and transformed into engineering features that carry diagnostic meaning. Vibration data yields spectral peaks, envelope amplitudes, and kurtosis values. Pressure data yields drift rates, oscillation patterns, and setpoint deviation. Flow data yields meter factor drift and repeatability metrics. These extracted features become the inputs for the prediction models, stripping away noise and isolating the signals that matter.
Pattern Recognition and Anomaly Detection
Trained machine learning models compare current feature patterns against learned normal behavior for each specific piece of equipment. The models account for operating conditions like flow rate, fuel temperature, and ambient conditions so that a vibration change caused by a load increase is not confused with a vibration change caused by bearing wear. This contextual awareness is what separates AI prediction from simple threshold monitoring.
Risk Scoring and Failure Window Estimation
When an anomaly is confirmed, the system calculates a risk score based on the severity of the deviation, the rate of change, and the historical failure progression for that equipment type. This produces an estimated failure window, typically expressed as a range of days or weeks, that tells the maintenance team exactly how much time they have to plan a repair without disrupting operations.
Automated Alerting and Work Order Integration
Risk scores and failure windows are pushed to maintenance teams through configurable alert thresholds. High-risk equipment triggers immediate notifications with full diagnostic context, while medium-risk items are queued for the next planning cycle. The system integrates directly with CMMS platforms to auto-generate work orders, eliminating the gap between detection and action that causes so many predictable failures to slip through.
Equipment Failure Mode Detection Matrix
The table below maps the most common failure modes in airport fuel systems to their detection signals, the AI indicators that flag them, and the typical lead time between first detection and actual failure. This lead time is the window that predictive maintenance opens for planned repair.
| Equipment | Failure Mode | Detection Signal | AI Indicator | Lead Time |
|---|---|---|---|---|
| Hydrant Pump | Bearing degradation | Vibration spectral change at bearing frequencies | Envelope amplitude trend | 14-28 days |
| Hydrant Pump | Seal leakage | Pressure decay during deadhead, increased motor current | Differential pressure trend | 7-14 days |
| Filter Separator | Element clogging | Differential pressure rise across element | dP rate of change vs. baseline | 3-7 days |
| Control Valve | Seat wear | Valve position deviation from command signal | Position error trend | 21-42 days |
| Control Valve | Actuator degradation | Increased stroke time, higher actuator current | Actuator current trend | 14-28 days |
| Flow Meter | Bearing wear | Meter factor drift vs. proving data | Flow accuracy trend | 14-30 days |
| Pressure Regulator | Diaphragm fatigue | Outlet pressure drift from setpoint | Pressure deviation rate | 7-21 days |
| Floating Suction | Bearing wear | Suction inlet depth change in tank | Draw quality trend vs. tank level | 30-60 days |
iFactory builds a live risk profile for every monitored asset in your fuel system, showing you exactly which equipment is degrading and how many days you have before predicted failure.
Airport Fuel System Maintenance Maturity Model
Not every airport fuel system is ready to jump directly to AI-driven prediction. Most facilities progress through distinct stages of maintenance maturity, and understanding where your operation sits on this spectrum helps you plan a realistic transition path that delivers value at each step without requiring a complete infrastructure overhaul.
Equipment is operated until it fails. Maintenance is purely responsive, triggered by breakdowns, operator complaints, or regulatory inspection findings. There is no systematic data collection beyond what operators observe during rounds. This level is common at smaller regional airports where fuel throughput is low and maintenance resources are limited, but it carries the highest risk of operational disruption and regulatory non-compliance. Every failure is an emergency, and every repair is a crisis.
Maintenance is scheduled based on manufacturer recommendations, regulatory requirements, and historical failure intervals. Equipment is inspected and serviced on fixed calendars or runtime hours regardless of actual condition. This approach prevents many failures but generates significant waste through premature replacement of components that still have useful life remaining, and it still misses failures that occur between scheduled intervals. It is an improvement over reactive maintenance but fundamentally limited by its disconnect from actual equipment condition.
Continuous or periodic condition monitoring data including vibration, pressure, and temperature is used to make maintenance decisions. Equipment is serviced when monitored indicators show degradation rather than on a fixed schedule. This level requires sensor infrastructure and analytical capability but already delivers significant reductions in unplanned downtime compared to purely time-based approaches. However, it still relies on human analysts to interpret trends and set thresholds, which introduces subjectivity and response delays.
Machine learning models analyze combined sensor data streams to predict specific failure modes and estimate remaining useful life for each monitored asset. Maintenance is scheduled based on predicted failure windows, optimizing both equipment availability and maintenance resource allocation. This is the level where iFactory's platform operates, and it represents the current state of the art for critical infrastructure maintenance. Human analysts set strategy while the AI handles detection, diagnosis, and prioritization continuously across every monitored asset.
Rolling Out Predictive Maintenance Across Your Fuel System
Deploying predictive maintenance across an airport fuel system does not require a rip-and-replace approach. iFactory follows a phased implementation methodology that delivers measurable results at each stage while building toward full-system coverage without disrupting ongoing operations.
Every component in the fuel system is ranked by criticality based on failure consequence, operational impact, safety risk, and regulatory exposure. This ranking determines which assets receive predictive monitoring first, ensuring the highest-value targets are addressed in the initial deployment phase rather than spreading resources too thin across the entire system at once.
Vibration, pressure, temperature, and current sensors are installed on the highest-criticality assets during scheduled maintenance windows to avoid operational disruption. Sensor selection and placement are optimized for each equipment type to ensure the data captured is diagnostic-quality rather than merely indicative, which is the difference between a prediction and a guess.
The system operates in monitoring-only mode for a period sufficient to establish normal behavior baselines for each asset under varying operating conditions. Machine learning models are trained on this baseline data, supplemented by historical maintenance records and known failure event data where available, to create equipment-specific prediction models tailored to your exact infrastructure.
Predictive models run in parallel with existing maintenance practices, generating predictions that are compared against actual equipment condition during scheduled inspections. This validation period builds confidence in model accuracy and allows threshold tuning to minimize false positives before the system is trusted to drive maintenance decisions autonomously.
Once validated, predictions are integrated into the maintenance planning workflow with alerts routed to the appropriate teams and work orders auto-generated in the CMMS. Model performance is continuously monitored and retraining cycles are established to ensure prediction accuracy is maintained as equipment ages and operating conditions evolve over time.
Frequently Asked Questions
How does AI-based failure prediction differ from traditional alarm systems?
Traditional alarm systems use fixed thresholds where a vibration alarm trips only after a sensor reading exceeds a predefined value, meaning the alarm fires after equipment has already degraded to a concerning level. AI prediction examines trends, rates of change, and multi-signal correlations to detect degradation much earlier. Instead of waiting for vibration to cross a threshold, the AI notices that vibration is increasing at a consistent rate while pressure is simultaneously drifting downward, a combined pattern that indicates bearing wear even though both readings remain within normal limits. This early detection creates the time window for planned repair that traditional alarms cannot provide. Book a demo to see the detection lead time difference on real fuel system data.
What sensors are required to deploy predictive maintenance on a fuel hydrant system?
The minimum sensor set for meaningful prediction on hydrant pumps includes triaxial vibration sensors on bearing housings, discharge pressure transducers, and motor current monitors. For filter separators, differential pressure transmitters across the element are essential. Control valves benefit from position feedback sensors and actuator current monitoring. Flow meters already generate pulse or digital output signals that the AI platform can ingest directly without additional hardware. In most cases, the sensor infrastructure required is less extensive than facility teams assume, because the AI extracts more diagnostic value from fewer signals than traditional monitoring approaches ever could. Contact support for a sensor recommendation specific to your installed equipment.
How long does it take to get accurate failure predictions after installation?
The baseline collection and model training phase typically runs for four to eight weeks depending on the variability of operating conditions at your facility. During this period the system builds normal behavior profiles for each asset across the full range of flow rates, fuel temperatures, and demand patterns it experiences. After baseline establishment, a shadow mode validation period of two to four weeks confirms prediction accuracy against actual equipment condition observed during scheduled inspections. Most facilities are receiving actionable predictions within six to twelve weeks of sensor installation, with prediction accuracy improving continuously as the models accumulate more operating data and refine their understanding of each asset's unique behavior.
Can the system integrate with our existing airport CMMS and SCADA platforms?
iFactory is designed to integrate with standard industrial communication protocols including OPC-UA, Modbus TCP, and REST APIs, which covers the majority of airport fuel system SCADA and CMMS installations in use today. Predictions and risk scores can be pushed as data points into your SCADA HMI for operator visibility alongside existing process displays, and work order recommendations can be sent directly to your CMMS through API integration without manual data entry. The platform adds an intelligence layer on top of your existing infrastructure rather than requiring replacement of systems that are already functioning correctly. Book a demo to discuss integration specifics for your platforms.
What is the return on investment for predictive maintenance on airport fuel systems?
The ROI calculation centers on three value drivers that compound over time. First, avoided unplanned downtime where a single prevented pump failure during peak operations can save $50,000 to $150,000 in direct repair costs, aircraft delay penalties, and emergency logistics expenses. Second, optimized maintenance scheduling where condition-based replacement of bearings, seals, and filter elements eliminates the waste of replacing components that still have significant remaining life, typically reducing maintenance material costs by 20 to 35 percent. Third, regulatory and safety risk reduction where catching filter bypass conditions or flow meter drift before they become compliance issues avoids the fines, investigation costs, and operational restrictions that follow regulatory findings. For most mid-size to large airport fuel systems, the infrastructure investment pays for itself within the first two to three avoided failure events.
Talk to iFactory about building a predictive maintenance roadmap for your airport fuel system before your next scheduled shutdown window.