Switching a ground support fleet to electric solves the noise and emissions problem, but it quietly creates a new one: batteries degrade in ways a fuel gauge never had to. A pack that reads 80% state of charge can still be days away from leaving a belt loader stranded mid-shift if a handful of cells are aging faster than the rest, and most ground handling teams have no way to see that until the equipment simply stops responding. A predictive maintenance dashboard built specifically for electric GSE batteries closes that gap by turning charge, temperature, and cell-level degradation data into a single live view your team can act on. Book a demo to see your own fleet's battery data inside it.
ELECTRIC GSE · BATTERY HEALTH · PREDICTIVE MAINTENANCE
Your Electric Fleet Runs on Batteries You Currently Can't See Inside Of
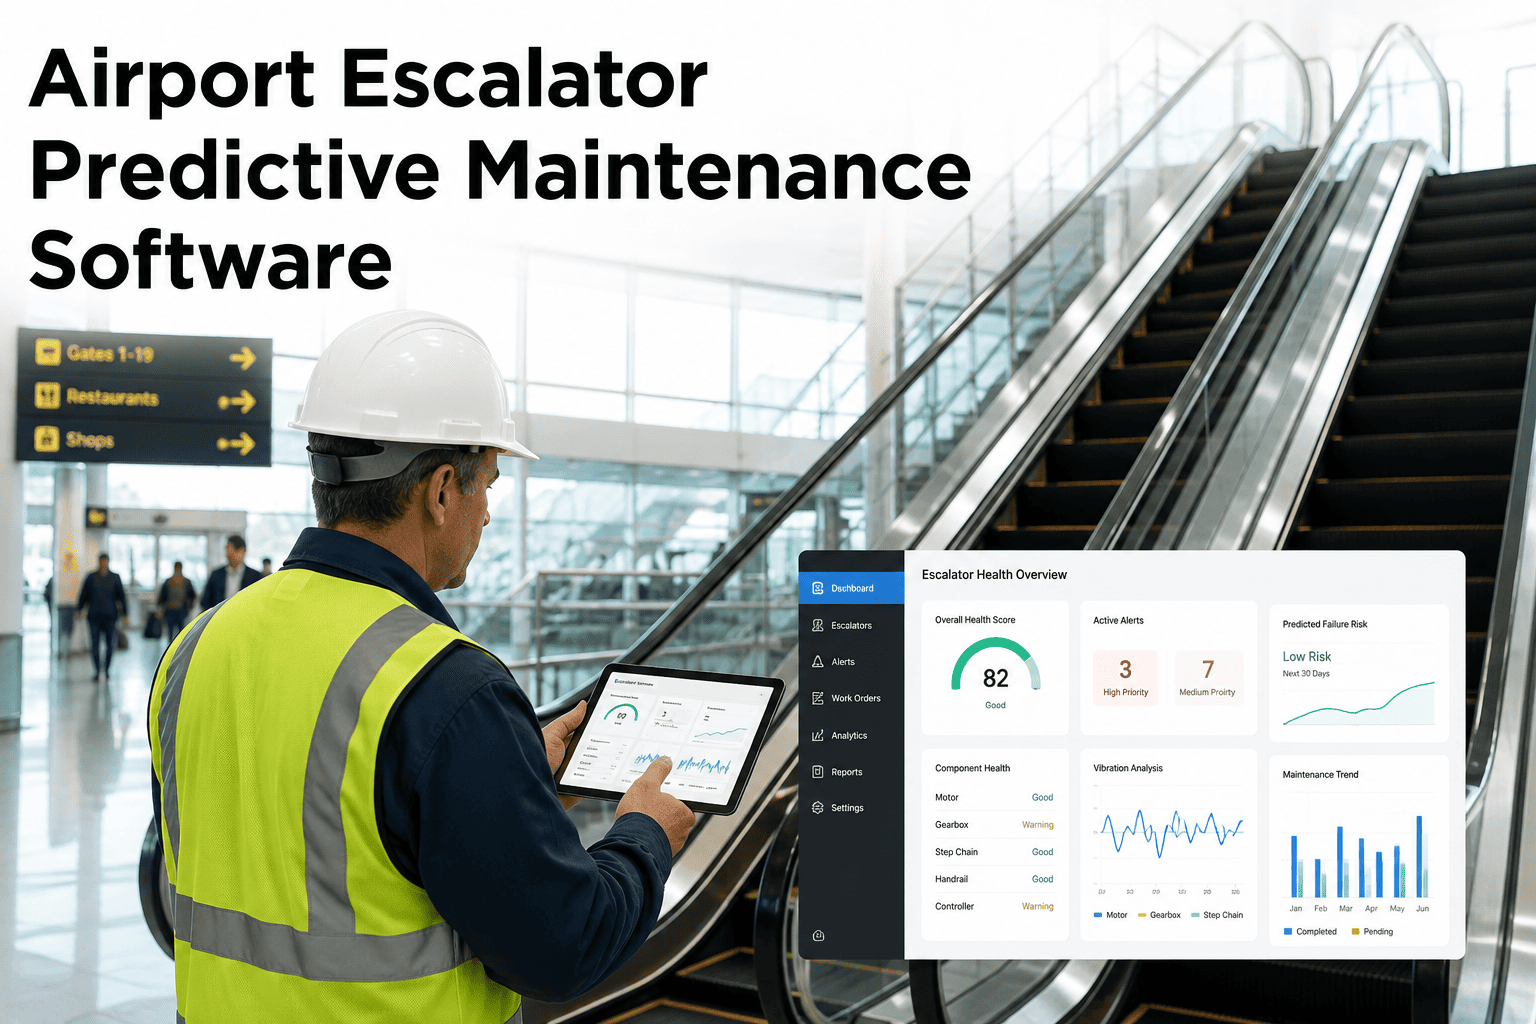
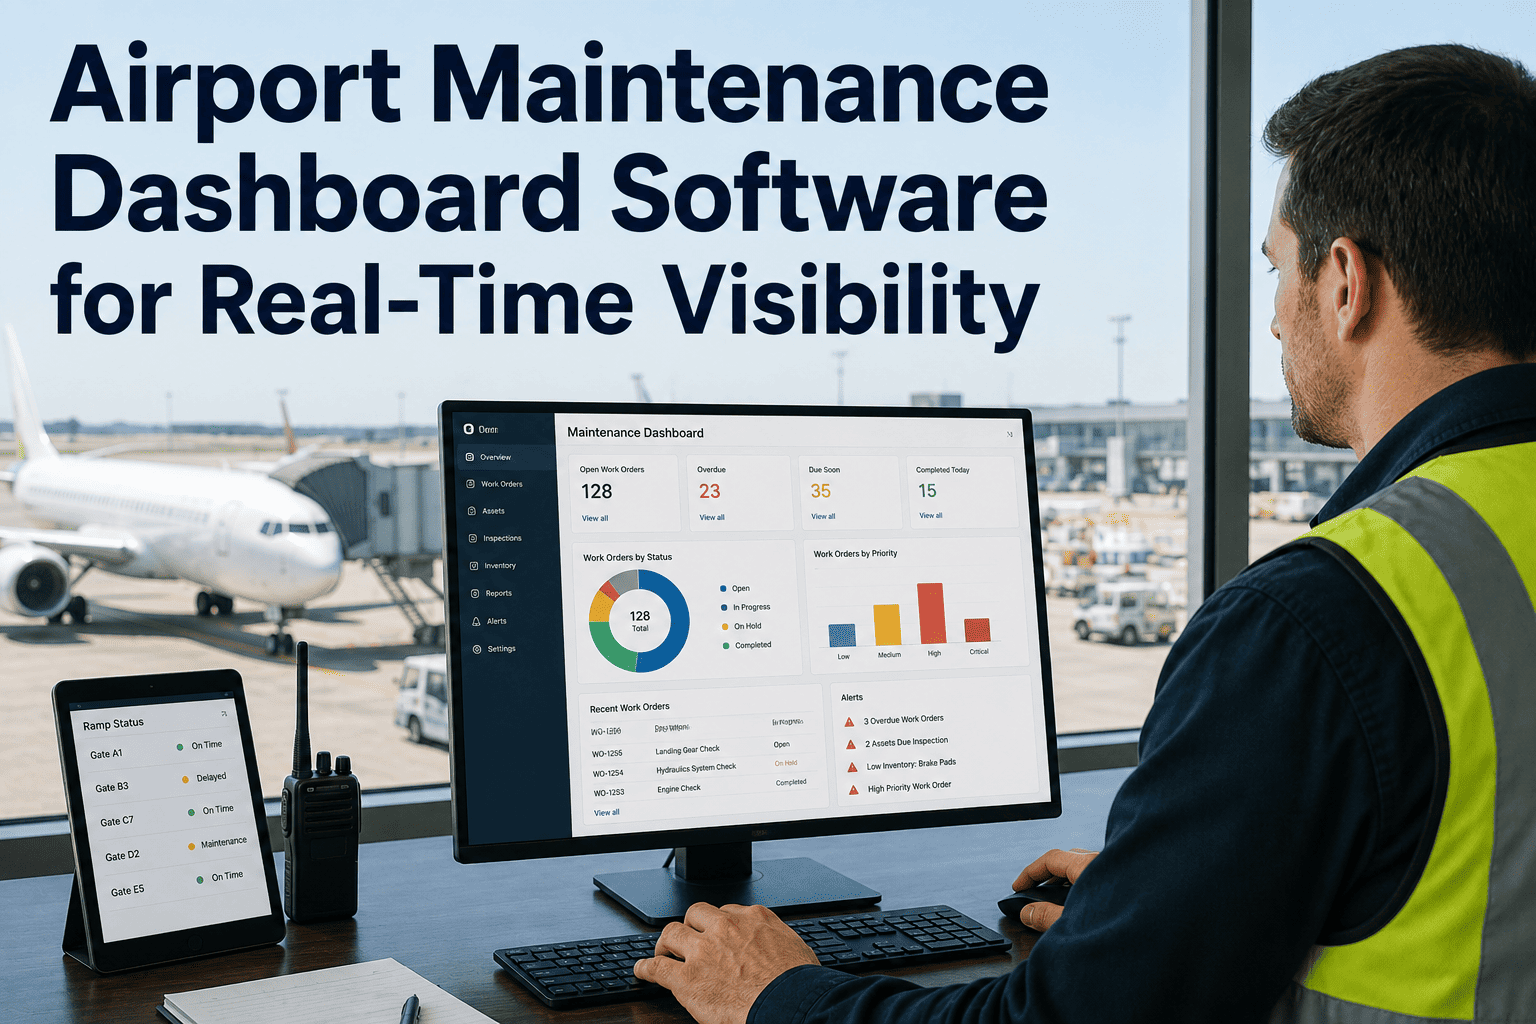
iFactory's predictive maintenance dashboard brings state of charge, cell temperature, degradation trend, and charging compliance for your entire electric GSE fleet into one screen, flagging battery health issues weeks before a dead pack takes equipment off the ramp.
WHAT THE DASHBOARD SHOWS YOU
Every Battery Signal That Actually Predicts a Failure, in One Place
A state of charge percentage tells you how much energy is left right now. It tells you almost nothing about whether that pack will still hold a full charge in three months, or whether one cell group is quietly pulling the rest of the pack down. A predictive maintenance dashboard is built around the signals that actually forecast battery health, not just the ones a charger's screen happens to display.
State of Charge
Live, Per Unit
Real-time charge level across every vehicle in the fleet, visible from a single screen instead of walking the ramp.
Cell Temperature
Tracked Continuously
Rising or uneven cell temperature during charging is one of the earliest indicators of internal degradation.
Charge Cycle Count
Logged Automatically
Cycle count against manufacturer-rated life expectancy, so replacement planning is based on data, not guesswork.
Capacity Fade Trend
Trended Over Time
The rate a pack's usable capacity is shrinking, which reveals abnormal aging long before a runtime complaint does.
Charging Compliance
Flagged in Real Time
Incomplete charges, opportunity-charging patterns, and skipped sessions that quietly shorten battery lifespan.
Fault and Error Codes
Routed to Maintenance
Battery management system alerts pulled out of the equipment and pushed directly into a technician's queue.
THE OLD WAY VS. THE DASHBOARD WAY
Fleet Managers Aren't Guessing Because They Want To
Most ground handling teams that electrified their GSE fleet did so for the operating cost and emissions benefits, and reasonably assumed battery management would be simple by comparison to engine maintenance. In practice, without a dedicated monitoring layer, battery health becomes a different kind of blind spot, one that only becomes visible the moment a unit fails to hold a charge through a shift.
Without a Dashboard
Battery health is checked by watching a charger's built-in display, unit by unit, if at all
A pack's declining capacity is discovered when it can no longer finish a shift
Replacement decisions are based on age or a technician's memory, not actual degradation data
Charging discipline across a large fleet is effectively unmonitored
With a Predictive Dashboard
Every unit's state of charge, temperature, and trend is visible from one screen, updated continuously
Abnormal capacity fade is flagged weeks before it affects a shift's runtime
Replacement and rotation decisions are based on actual cycle count and degradation curves
Incomplete or poor charging habits are flagged automatically, protecting battery lifespan fleet-wide
See what your current fleet's battery data would look like in a single dashboard
iFactory can connect to your existing electric GSE fleet and show you which units already need attention before they leave you short-handed on the ramp.
FROM SIGNAL TO ACTION
What Each Indicator Means, and What the Dashboard Does About It
A dashboard full of numbers is only useful if each number is tied to a clear, specific action. The value of a predictive maintenance layer over a basic charger display is that every indicator has a defined threshold and a defined next step attached to it.
| Indicator |
What It Signals |
Action Triggered |
| Abnormal Capacity Fade |
Pack is aging faster than its peers or its rated curve |
Flagged for inspection and scheduled for planned rotation or replacement |
| Elevated Charge Temperature |
Early sign of internal resistance or cell imbalance |
Work order generated for battery inspection before next duty cycle |
| Incomplete Charge Sessions |
Operator behavior that shortens battery lifespan over time |
Alert routed to shift supervisor to correct charging habits |
| Cycle Count Approaching Rated Life |
Battery nearing its manufacturer-expected end of service life |
Added to the replacement forecast so procurement isn't reactive |
| Battery Management System Fault Code |
A defined internal fault the equipment itself has detected |
Pushed directly into the maintenance team's work order queue |
ONE VIEW, EVERY FLEET SIGNAL
The Dashboard Pulls From the Systems Your Fleet Already Runs On
Electric GSE fleets typically already generate battery data somewhere, inside the battery management system, the charger, or a manufacturer's own portal. The problem is rarely a lack of data, it's that the data lives in separate systems nobody checks together. A predictive maintenance dashboard's real job is consolidation, not just collection.
Battery Management System Data
Cell-level voltage, temperature, and fault data pulled directly from the pack's own onboard monitoring.
Charger and Charging Station Logs
Session completion, duration, and frequency data showing exactly how each unit is being charged day to day.
Equipment Utilization Records
Runtime and duty cycle data correlated against battery drain to separate normal wear from abnormal degradation.
Maintenance and Work Order History
Past repairs and inspections tied to the same asset, so a technician sees full context, not just a fresh alert.
Once these sources are unified, the dashboard can trend a battery's health over months rather than showing a single point-in-time reading, which is what actually makes the difference between reacting to a failure and preventing one.
WHY IT PAYS FOR ITSELF
Battery Failures Are Expensive in Ways That Don't Show Up on the Purchase Invoice
A battery that fails mid-shift doesn't just cost the price of a replacement pack. It costs the delay caused by a stranded belt loader or tug, the labor spent diagnosing a problem that could have been flagged weeks earlier, and the accelerated wear on whatever backup equipment gets pulled in to cover the gap.
Weeks
Typical advance notice a capacity fade trend provides before a pack can no longer finish a shift
Longer
Usable battery lifespan achieved by correcting incomplete charging habits fleet-wide
Fewer
Emergency replacements once procurement is planned from a real degradation forecast
One Screen
Where a fleet manager can check every unit's health instead of walking the ramp charger by charger
GETTING STARTED
Rolling Out Battery Health Monitoring Without Disrupting Fleet Operations
Adding a predictive layer on top of an electric GSE fleet does not require replacing chargers or battery management systems already in place. It requires connecting the data those systems already produce into one place your team actually looks at.
1
Connect to Existing Battery and Charger Data
Pull state of charge, temperature, and cycle data directly from the battery management systems and chargers already installed.
2
Establish a Healthy Baseline Per Unit
Each battery's normal charge and degradation pattern is learned individually, since packs of the same age don't always age the same way.
3
Set Thresholds Tied to Real Actions
Each alert is mapped to a specific response, an inspection, a charging correction, or a replacement forecast entry, not a generic notification.
4
Route Alerts Into Maintenance Workflows
Flagged issues become work orders inside the system your maintenance team already uses, not a separate portal to check.
5
Expand Coverage as the Fleet Grows
New electric units are added to the same dashboard as the fleet grows, keeping visibility complete instead of partial.
FREQUENTLY ASKED QUESTIONS
What Ground Handling Teams Ask About Battery Health Dashboards
Do we need to replace our chargers or battery management systems to use this dashboard?
No, the dashboard is designed to sit on top of the battery and charging infrastructure your fleet already uses rather than replacing it. It connects to the data your battery management system and chargers already generate and brings it into one consolidated view your team can actually monitor day to day. Most fleets have more usable battery data already available than they realize, it's just spread across separate systems nobody checks together.
Contact our support team to confirm compatibility with your current equipment.
How early can this actually catch a battery problem before it causes downtime?
Capacity fade and abnormal charge temperature trends typically become visible weeks before a pack can no longer complete a normal shift, since these indicators shift gradually rather than failing all at once. The exact lead time depends on the battery chemistry and how the unit is used, but the goal is always the same: catching the trend early enough that replacement or inspection happens on a planned schedule instead of during an active shift.
Book a demo to see example degradation trends from a fleet similar to yours.
Can the dashboard actually help extend battery lifespan, not just predict failure?
Yes, and this is one of the more overlooked benefits of continuous monitoring. Incomplete charging sessions and poor opportunity-charging habits quietly shorten battery life over time, and most fleets have no visibility into how often this is happening across their operators and shifts. Flagging these patterns as they occur, rather than after a battery underperforms its expected lifespan, is often what delivers the largest long-term savings from the dashboard.
Contact our support team to see how charging compliance is tracked.
Will this work across a mixed fleet with batteries from different manufacturers?
Ground handling fleets rarely standardize on a single battery or GSE manufacturer, so the dashboard is built to normalize data from different battery management systems into a consistent view rather than requiring a single vendor across the fleet. Each unit's baseline and thresholds are still established individually, which matters more for accuracy than which manufacturer built the pack.
Book a demo to walk through your specific fleet mix.
Is this worth setting up for a smaller electric GSE fleet, or only for large operators?
The value scales with the fleet, but even a small number of electric units benefits from centralized visibility, since a single unexpected battery failure can strand ground operations at a gate regardless of how many other vehicles a fleet has. Smaller operators typically start by connecting their existing units and expanding coverage as the fleet grows, rather than needing a large upfront rollout.
Book a demo to scope a setup sized for your current fleet.
SEE INSIDE YOUR FLEET'S BATTERIES
Stop Finding Out a Battery Failed When the Equipment Stops Moving
iFactory connects to your electric GSE fleet's existing battery and charging data and brings it into one dashboard your team can act on before a dead pack takes a unit off the ramp.