An aero-engine assembly line produces a torque value, a fastener tightness reading, a bearing fit measurement — thousands of them every shift, each one logged, each one within specification at the moment of capture. Six weeks later, an engine in service reports a vibration anomaly. The maintenance team traces it back to a sub-assembly built on this line. The torque record for that build is reviewed: in spec. The bearing fit record: in spec. Nothing in the static record explains the failure, because the static record only ever captured one moment — and the moment that mattered was the cumulative drift across hundreds of upstream operations that no single inspection point was designed to see. This is the limitation a digital twin removes. Instead of isolated inspection snapshots, the twin holds a continuously updated virtual model of the engine build — every torque, fit, and alignment value linked to the specific unit, correlated against the others, and checked against how that unit is likely to perform once it leaves the line. For quality engineers in aerospace engine assembly, this is the shift from inspecting parts to predicting outcomes.
Digital Twin QC · Continuous Cpk · Predictive Maintenance · AS9100 Traceability
The Engine Build That Passes Every Inspection Can Still Fail in Service. A Digital Twin Tells You Why Before It Happens.
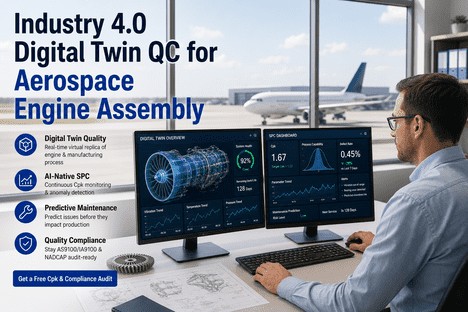
iFactory's digital twin quality platform links every torque, fit, and alignment measurement across the engine build to a live virtual model — surfacing the cumulative deviations that pass every individual check but predict performance issues 40%+ before they reach the test cell or the field.
Why Individually Compliant Stations Still Produce Engines With Build Issues
Engine assembly quality control today is structured around stations: torque the fastener, check the value against tolerance, log it, move to the next station. Each station has its own pass/fail boundary, and each one operates blind to every other station's data. A bearing fit that lands at the high end of tolerance is fine on its own. A shaft alignment that lands at the low end of tolerance is fine on its own. But the combination of those two values, on the same unit, may push a vibration characteristic outside what the engine can tolerate in service — and no station-level inspection is built to see that combination. A digital twin closes this gap by holding all of the build data for a single engine unit together, continuously, and comparing the combined profile against the population of units that have already gone through test cell and field service. The question stops being "did this station pass?" and becomes "does this unit's full build profile match units that performed well?"
Three Build Conditions Static Inspection Misses — and the Digital Twin Catches
A
Cumulative Torque Drift Across Bolt Patterns
Each fastener in a bolted joint is torqued in sequence and each reading passes individually. But the sequence itself, combined with slight tool calibration drift over a shift, can leave the joint's overall clamp load distribution skewed — a condition no single torque value reveals, but the digital twin's joint-level model flags immediately.
B
Compounding Fit Tolerances on Rotating Assemblies
A bearing fit at the upper tolerance limit and a shaft runout at the lower limit can each pass independently while combining into a rotating assembly profile that historically correlates with elevated vibration signatures at test cell. The twin's correlation model surfaces this combination before the unit reaches test.
C
Tooling Wear Invisible to Pass/Fail Limits
A torque tool drifting toward the low edge of its calibration window still produces "pass" readings for weeks. The digital twin tracks the tool's output trend across thousands of cycles, flagging gradual drift long before any individual reading would trip a station limit.
How the Digital Twin Quality Platform Works on an Engine Assembly Line
The platform builds a live virtual record for every engine unit as it moves through assembly, links that record to a continuously updated capability model, and uses predictive analytics to flag units whose combined build profile suggests elevated maintenance risk later in service — giving quality engineers a clear intervention point before the unit ever reaches the test cell.
Step 01
Build the Unit-Level Virtual Record
Every measurement, tagged to one serialised engine unit
As the engine unit moves through each assembly station, every torque value, fit measurement, alignment reading, and tooling parameter is captured and linked to that unit's serial number inside the digital twin. This creates a single, continuously growing virtual record — not a series of disconnected station logs — that represents the actual as-built state of the unit at any point in the process. Quality engineers can view this record at any stage, comparing the unit's current profile against the population of completed units.
Serial-linked records
Cross-station correlation
Live virtual build state
Step 02
Run Continuous Cpk Against a Living Baseline
Capability tracked per characteristic, per build, in real time
Process capability for every monitored characteristic — torque, fit, alignment, clearance — is recalculated continuously as new units complete the line, rather than reviewed retrospectively at fixed intervals. When Cpk for a characteristic begins trending downward, the quality engineer sees it as it happens, with the contributing stations and tooling identified automatically. This turns capability monitoring from a periodic audit activity into a live operating signal.
Live Cpk per characteristic
Trend-based alerting
Station-level attribution
Step 03
Predict Maintenance Risk Before Test Cell
Flagging units whose combined profile correlates with known issues
The predictive layer compares each completed unit's full build profile against historical units, including the field and test cell outcomes those units later produced. Units whose combined profile matches patterns historically associated with elevated maintenance events are flagged for additional review before they proceed to test cell — giving the quality engineer an intervention point measured in hours, not the weeks it would otherwise take for a field issue to surface and be traced back.
Pre-test cell flagging
Field-outcome correlation
Early intervention window
Unplanned Downtime · Live Cpk · AS9100 Records · Field-Outcome Correlation
40%+ of Unplanned Engine Downtime Traces Back to Build Conditions That Were Visible at Assembly — If You Were Looking at the Whole Unit.
iFactory's digital twin platform connects assembly-floor data to in-service outcomes, so quality engineers can see — and act on — the build patterns that predict maintenance events, not just the station readings that already passed.
What the Quality Engineer Sees on the Digital Twin Dashboard
The dashboard is built around the engine unit, not the station. Each view answers a question the quality engineer needs to answer continuously — not at the end of a shift, but while the unit is still on the line and any correction is still possible.
Dashboard View 01
Unit Build Profile — Every Reading, One Engine
A single view showing every torque, fit, and alignment reading captured for one serialised engine, plotted against the historical population of completed units. Outliers within an otherwise compliant unit are visually distinct, letting the quality engineer assess the unit as a whole rather than station by station.
Quality engineer action: Review flagged units before release to test cell.
Dashboard View 02
Live Cpk Trend by Characteristic and Station
Capability for each monitored characteristic — bolt torque, bearing fit, shaft alignment — is tracked as a live trend line, with the contributing station identified automatically when capability declines. Quality engineers see drift forming before it crosses a warning threshold.
Quality engineer action: Investigate the contributing station as soon as the trend turns, not after Cpk fails.
Dashboard View 03
Predictive Maintenance Risk Flags
Units whose combined build profile matches a pattern historically linked to elevated maintenance events are listed here, ranked by confidence, with the specific contributing measurements highlighted so the quality engineer knows exactly what to review.
Quality engineer action: Route flagged units for additional inspection before test cell scheduling.
Dashboard View 04
AS9100 Traceability Export
Every measurement, correlation flag, and quality engineer action linked to a unit is held in a searchable record, exportable by serial number, build date, or station — the documentation chain AS9100 audits require, generated automatically as the unit moves through the line.
Quality engineer action: Export full unit history on demand for any audit request.
"
We had a recurring vibration complaint on a specific engine variant that our station-level data could never explain — every torque and fit value involved came back in spec every time. After we connected assembly data to test cell and field outcomes through the digital twin, the pattern was clear within the first review cycle: units with bearing fit near the upper tolerance combined with shaft alignment near the lower tolerance were the common factor, and no single station limit had ever been built to catch that combination. We adjusted the in-process check for that specific combination, and the related maintenance flags on new units dropped sharply within the following quarter.
— Quality Engineer, Commercial Turbine Engine Assembly Facility
Conclusion
Engine assembly quality programmes that rely on station-by-station pass/fail checks are structurally limited to seeing one measurement at a time — and unplanned downtime that originates from a combination of individually compliant values will continue to slip through, get traced after the fact, and resist a clean root cause. A digital twin changes the unit of analysis from the station to the engine, holding every measurement together as a single build profile and comparing that profile against how similar units have actually performed in test cell and in service.
For quality engineers, this means capability tracking that updates continuously rather than at scheduled intervals, predictive flags on units before they reach test cell rather than maintenance reports weeks after delivery, and an AS9100 documentation trail that is built automatically as the unit moves through the line rather than assembled under audit pressure. Reducing unplanned downtime by 40% or more is not a matter of tighter station tolerances — it is a matter of seeing the whole build.
iFactory's digital twin quality platform is built for quality engineers in aerospace engine assembly who need to move from station-level inspection to unit-level prediction. Book a Demo to see the digital twin configured for your engine programme, or talk to an expert about a free Cpk and compliance audit for your assembly line.
Frequently Asked Questions
See What Your Assembly Data Is Already Telling You About Future Maintenance Events. Get a Free Cpk & Compliance Audit.
iFactory's digital twin platform for aerospace engine assembly — unit-level build profiles, continuous Cpk tracking, predictive maintenance flags before test cell, and AS9100-aligned traceability generated automatically from data your line already produces.