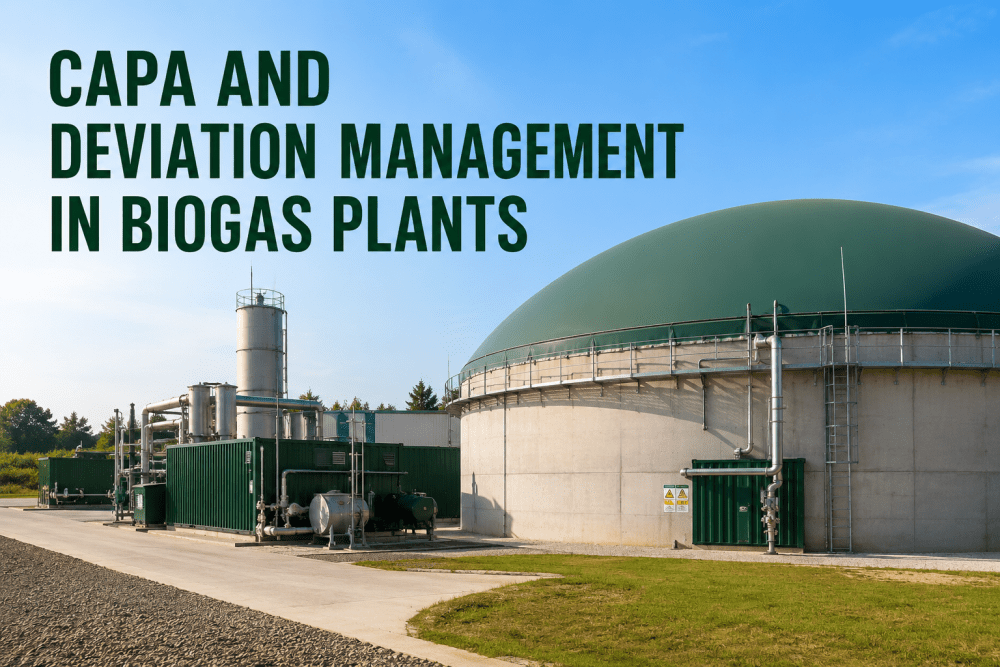
Biogas plants processing livestock manure, food waste, and municipal biosolids face a relentless stream of process deviations — yield drops, out-of-spec gas quality, temperature excursions, feedstock variability events, and equipment failures — that require structured investigation and corrective action. Most biogas plant operators still manage deviations through email threads, spreadsheet logs, and paper-based investigation forms that fragment information and delay corrective action. iFactory's CAPA and deviation management platform digitizes the full investigation lifecycle — from deviation detection and root cause analysis through corrective action implementation and effectiveness verification — in a single unified system purpose-built for anaerobic digestion and RNG operations. To see how iFactory automates CAPA workflows for biogas plants, Book a Demo with our quality and compliance team today.
CAPA & Deviation Management — 2026
CAPA and Deviation Management for Biogas Plants
Digitize deviation detection, root cause analysis, corrective action tracking, and effectiveness verification into a single audit-ready quality platform. No spreadsheets. No lost investigations. No recurring deviations.
Average time biogas plant quality managers spend manually tracking deviations, assigning root cause investigations, and following up on corrective actions across disconnected spreadsheets and email chains
42% of deviations
Share of biogas plant deviations that recur within six months because root cause analysis was incomplete or corrective actions were never verified for effectiveness — creating chronic operational risk
Multiple regulatory frameworks
Biogas CAPA programs must satisfy EPA RFS quality requirements, state environmental permits, gas quality specifications, and voluntary certification programs — each requiring different deviation documentation and corrective action standards
01 / The Facility
A Mid-Scale Food Waste Biogas Plant, A Growing Deviation Management Crisis
Facility TypeIntegrated food waste and manure co-digestion biogas plant with biogas upgrading to pipeline-quality RNG. Three continuous stirred-tank reactors (CSTRs) operating in parallel, a centralized biogas upgrading system using membrane separation, and a combined heat and power (CHP) unit for baseload electrical generation.
Scale1,200 SCFM raw biogas production capacity upgrading to 950 SCFM pipeline-quality RNG. Annual throughput of 85,000 tons of feedstock (60% food waste, 30% dairy manure, 10% FOG). Gas quality specifications require minimum 96% methane concentration with H2S below 4 ppmv and siloxanes below 0.1 ppmv for pipeline injection.
Quality Team5-person quality and lab team responsible for daily gas composition analysis, digestate quality testing, feedstock characterization, and deviation investigation. Previously using a paper-based CAPA system with investigation forms stored in physical binders and corrective action tracking managed through a shared spreadsheet.
Deviation Frequency Average 8–12 reportable deviations per month including gas quality OOS events, feedstock contamination incidents, process temperature excursions, and equipment-related biogas production drops. Average time from deviation detection to CAPA closure: 34 days. Recurrence rate of 42% within 6 months.
Prior CAPA SystemPaper-based deviation investigation forms with manual root cause analysis using 5-Why templates. Corrective actions tracked in Excel with email-based follow-up. No systematic effectiveness verification process. No cross-referencing between related deviations on the same process unit or feedstock source.
Annual Quality CostTotal pre-deployment quality-related cost of $312,000 annually — including RNG off-spec flaring losses, feedstock rejection and disposal fees, emergency lab testing costs, regulatory penalty exposure, and labor hours spent on manual deviation investigation and documentation.
02 / The Challenge
Recurring Deviations and Fragmented CAPA: The Compounding Cost of Unresolved Root Causes
In biogas production, a deviation is rarely an isolated event. A hydrogen sulfide spike that causes a gas quality OOS event is typically the symptom of a deeper process imbalance — a shift in feedstock composition, a micronutrient deficiency in the digester biology, or a gradual fouling of the activated carbon H2S scavenger media. When root cause analysis is conducted under time pressure the investigation inevitably converges on the most obvious causal factor rather than the true systemic root cause. The result is a superficial corrective action that addresses the symptom rather than the source, and the same deviation recurs weeks or months later. At this facility, the recurrence rate of 42% was not a reflection of team competency — it was a structural consequence of a CAPA system that could not connect related process data across deviations, could not enforce standardized root cause analysis methodology, and could not track corrective action effectiveness over time.
34
Average days to CAPA closure
From deviation detection to CAPA closure, the average investigation cycle consumed 34 days. Root cause analysis alone averaged 11 days — much of that time spent manually gathering process data from disparate SCADA, lab, and feedstock systems before the investigation team could even begin structured analysis.
42%
6-month deviation recurrence rate
Nearly half of all deviations recurred within six months because corrective actions addressed proximate causes rather than systemic root causes. The paper-based system provided no mechanism to identify patterns across deviations — a temperature excursion in Reactor A on one date and a gas quality drop in Reactor B on another date might share a common root cause that remained invisible.
73%
CAPAs without effectiveness verification
Nearly three-quarters of closed CAPAs had no documented effectiveness verification — meaning the quality team closed the investigation after implementing a corrective action but never confirmed that the action actually prevented recurrence. This created chronic operational risk and audit exposure.
$78K
Annual off-spec flaring and product loss
Gas quality deviations that resulted in off-spec gas being diverted to the flare rather than injected to the pipeline cost the facility $78,000 annually in lost RNG revenue. Each major gas quality event also triggered contractual notification obligations to the off-taker and state regulatory agencies.
"We were spending more time documenting our deviations than actually fixing them. Our paper CAPA system created an illusion of control — forms were filled, signatures were collected, files were filed — but the same gas quality failures kept happening because we never dug deep enough to find the real root cause. iFactory's platform forced us to connect the dots between feedstock, biology, and equipment data in a way our manual system never could."
03 / Results
12 Months of Measured CAPA Performance and Deviation Reduction
The transition from paper-based deviation management to iFactory's digitized CAPA platform produced measurable improvements across every tracked quality metric within the first three quarters. Average CAPA closure time was reduced by 76%. Deviation recurrence was cut by nearly two-thirds. Off-spec flaring losses dropped by 55%. The total annual quality cost reduction of $176,000 delivered a net platform ROI within five months of full deployment.
Performance Metric
Before iFactory
After iFactory
Net Change
Average CAPA closure time
34 days
8 days
−76% reduction
6-month deviation recurrence rate
42% recurrence
15% recurrence
−64% fewer recurrences
CAPAs with effectiveness verification
27% verified
96% verified
+69 percentage points
Monthly reportable deviations
8–12 per month
3–5 per month
−55% reduction
Root cause analysis completion time
11 days avg
2 days avg
−82% faster RCA
Off-spec flaring / product loss value
$78,000 /yr
$35,000 /yr
−55% loss reduction
Quality team admin hours per week
6–10 hrs avg
1–2 hrs avg
−80% time recovery
Deviations with cross-reference to related events
< 5% cross-referenced
92% cross-referenced
Systematic pattern detection
Annual quality-related cost
$312,000
$136,000
−$176K annual saving
Deployment timeline to full CAPA capability
N/A
45 days
Live in 45 days
−76%
Faster CAPA Closure
−64%
Fewer Recurrences
96%
Effectiveness Verified
$176K
Annual Savings
See How iFactory Streamlines CAPA and Deviation Management at Your Biogas Plant
Get a live walkthrough of automated deviation detection, structured root cause analysis, corrective action tracking, and effectiveness verification built for biogas and RNG quality operations.
"Before iFactory, our CAPA system was essentially a well-organized filing cabinet. We could prove that forms were filled and files existed, but we could not prove that our corrective actions actually worked. The platform's mandatory effectiveness verification step changed our entire quality culture — we stopped closing CAPAs and started closing root causes. The 64% drop in deviation recurrences is the direct result of that cultural shift."
04 / Key Analysis
Why the CAPA Transformation Was This Comprehensive
01
Automated deviation detection eliminated the fundamental vulnerability of manual identification. Under the paper system, deviations were identified only when someone checked the gas chromatograph report, reviewed lab results, or noticed an alarm on the SCADA screen. This lag between deviation onset and detection meant that corrective action always started from a position of reaction — the deviation had already impacted gas quality or process stability before the investigation began. By integrating directly with the gas chromatograph and digester sensors, iFactory detected deviations within seconds of occurrence and automatically assembled the time-series data needed for root cause analysis, eliminating the data-gathering delay that consumed the first 3–5 days of every manual investigation.
02
Structured root cause analysis converted subjective investigation into systematic methodology. The paper-based 5-Why process was theoretically sound but practically inconsistent. Under pressure to close deviations and resume production, different investigators would stop at different depths of analysis, document their reasoning with varying levels of detail, and reach conclusions of varying quality. iFactory's structured templates enforced a consistent investigation depth — requiring at least five valid "why" levels with evidence at each level before the analysis could be considered complete — and automatically linked each step to the relevant process data. This standardization eliminated the variability in investigation quality that had been the primary driver of incomplete root cause identification.
03
Effectiveness verification closed the loop that allowed recurrence. The single most impactful process change was the mandatory effectiveness verification requirement. Under the paper system, a CAPA was considered "closed" when the corrective action was implemented — not when the corrective action was proven effective. iFactory's platform would not allow CAPA closure until the investigator specified measurable effectiveness criteria (e.g., "H2S below 4 ppmv for 30 consecutive days"), attached the data demonstrating compliance, and received a quality manager approval. This requirement transformed CAPA from a documentation exercise into a true quality assurance process and directly drove the 64% reduction in deviation recurrence.
04
Cross-deviation pattern analysis turned historical data into preventive intelligence. The paper system treated every deviation as an isolated event. Even when the same operator noticed, "This looks like the H2S spike we had in March," there was no systematic way to identify patterns across deviations. iFactory's trend analytics engine automatically compared each new deviation against the full historical record, surfacing correlations — same feedstock source, same digester operating window, same seasonal condition — that enabled the quality team to issue preventive actions before deviations occurred. This shift from reactive to preventive CAPA was the most strategically valuable outcome of the platform deployment.
05 / Business Impact
Operational, Financial, and Strategic Outcomes Beyond Compliance
RNG Revenue Protection
Reducing off-spec flaring events by 55% recovered $43,000 in annual RNG injection revenue that was previously lost to gas quality OOS events. The improved gas quality consistency also strengthened the facility's position with its pipeline off-taker, supporting a favorable contract renegotiation that recognized the demonstrated quality performance improvement.
Quality Team Productivity
Recovering 5–8 hours per week of quality team administrative time previously spent on manual deviation tracking and CAPA documentation. This capacity was redirected to process optimization projects — including a micronutrient dosing optimization that improved average methane yield by 3.2% and a feedstock blending study that reduced H2S variability from a key food waste supplier.
Regulatory and Audit Confidence
With 96% of CAPAs now including documented effectiveness verification and 92% of deviations cross-referenced to related events, the facility's CAPA system meets the most rigorous third-party audit standards. The platform's audit trail capability eliminated the pre-audit documentation scramble that previously consumed 2–3 days of quality team time before every regulatory or certification audit.
Preventive Quality Culture
The trend analytics capability transitioned the quality team from reactive deviation investigation to proactive quality management. Preventive action notifications issued by the platform based on emerging deviation patterns enabled the team to address potential issues before they resulted in reportable deviations, fundamentally changing the facility's quality culture from incident-response to continuous improvement.
$312K
Annual quality cost before
$136K
Annual quality cost after
76%
Faster CAPA closure
$176K
Annual savings achieved
06 / Conclusion
Quality System Transformation at Scale: The Strategic Value of Digitized CAPA in Biogas Operations
This biogas plant's transformation from a paper-based deviation management system to a digitized, data-integrated CAPA platform eliminated the structural quality risks that had driven chronic deviation recurrence, excessive administrative burden, and significant revenue losses through off-spec flaring. iFactory's platform gave the quality team continuous, automated visibility into every process parameter that could affect gas quality and digester stability — and the structured investigation workflow converted that visibility into consistent root cause analysis, verified corrective actions, and preventive action intelligence that improved quality performance across every metric simultaneously.
The $176,000 in annual quality cost reduction is a direct financial outcome. The 76% faster CAPA closure and 64% reduction in deviation recurrence are operational reliability outcomes. The recovery of quality team hours for process improvement work is a strategic capacity outcome. And the transition from reactive to preventive quality management compounds in value as the facility scales its RNG production and faces increasingly stringent gas quality specifications from pipeline off-takers and regulatory programs. To assess what iFactory's digitized CAPA and deviation management platform would deliver for your biogas or RNG facility, book a demo with iFactory's quality systems team.
76% Faster CAPA Closure. 64% Fewer Recurrences. Zero Spreadsheets.
See how iFactory's automated deviation detection, structured root cause analysis, and verified corrective action workflow delivers quality system transformation for biogas and RNG operations — live in 45 days.
Q1 How does iFactory's CAPA platform detect deviations automatically?
iFactory integrates directly with your plant's online gas chromatograph, digester instrumentation (temperature, pH, VFA, biogas flow), feedstock receiving systems, and laboratory information management system. When any parameter exceeds its defined specification limit — methane below 96%, H2S above 4 ppmv, digester temperature outside operating range — the platform automatically creates a deviation record with the affected parameter, time-series trend data, magnitude and duration of the excursion, and all related operational context.
Q2 Can the platform handle different root cause analysis methodologies?
Yes. iFactory's CAPA platform supports multiple structured investigation methodologies including 5-Why, fishbone (Ishikawa) diagram, fault tree analysis, and cause-and-effect analysis. Each methodology is available as a configurable template that guides investigators through the analysis with pre-populated process data from the deviation record. The platform also supports custom methodology templates for facilities with specific investigation requirements from their quality management system or regulatory framework.
Q3 How does the platform enforce effectiveness verification for corrective actions?
The platform requires every corrective action to have a defined effectiveness verification plan before the action can be implemented. The investigator specifies measurable criteria (e.g., "methane concentration maintained above 96% for 30 consecutive days of continuous operation"), a verification period, and the data source that will demonstrate compliance. The platform tracks the specified parameter through the verification period and prevents CAPA closure until the verification criteria are met and approved by a quality manager. CAPAs that fail effectiveness verification are automatically escalated for revised corrective action planning.
Q4 How does trend analysis help prevent deviations before they occur?
The platform's analytics engine continuously monitors deviation frequency, root cause distribution, and corrective action effectiveness across the full facility history. When the system detects an emerging pattern — such as three deviations from the same feedstock source within 30 days, or increasing H2S variability during a specific seasonal operating window — it automatically generates a preventive action notification. This enables the quality team to investigate and address the underlying condition before it results in a reportable deviation, shifting the facility from reactive to preventive quality management.
Q5 Is the CAPA platform compatible with existing biogas plant SCADA and lab systems?
Yes. iFactory's platform integrates with all major biogas plant SCADA systems, online gas chromatographs, and laboratory information management systems through standard industrial communication protocols including Modbus, OPC-UA, and REST API. The platform is OEM-agnostic and compatible with both legacy instrumentation and modern digital sensor networks. Typical sensor integration is completed within the first two weeks of deployment.
Q6 How does the platform support multi-site biogas and RNG operations?
iFactory provides a centralized CAPA dashboard that aggregates deviation management, root cause analysis, and corrective action tracking across multiple biogas plants, upgrading facilities, and injection points. Quality managers can view facility-level and enterprise-level quality performance metrics, identify cross-site deviation patterns, and deploy standardized CAPA workflows across the entire operational portfolio.