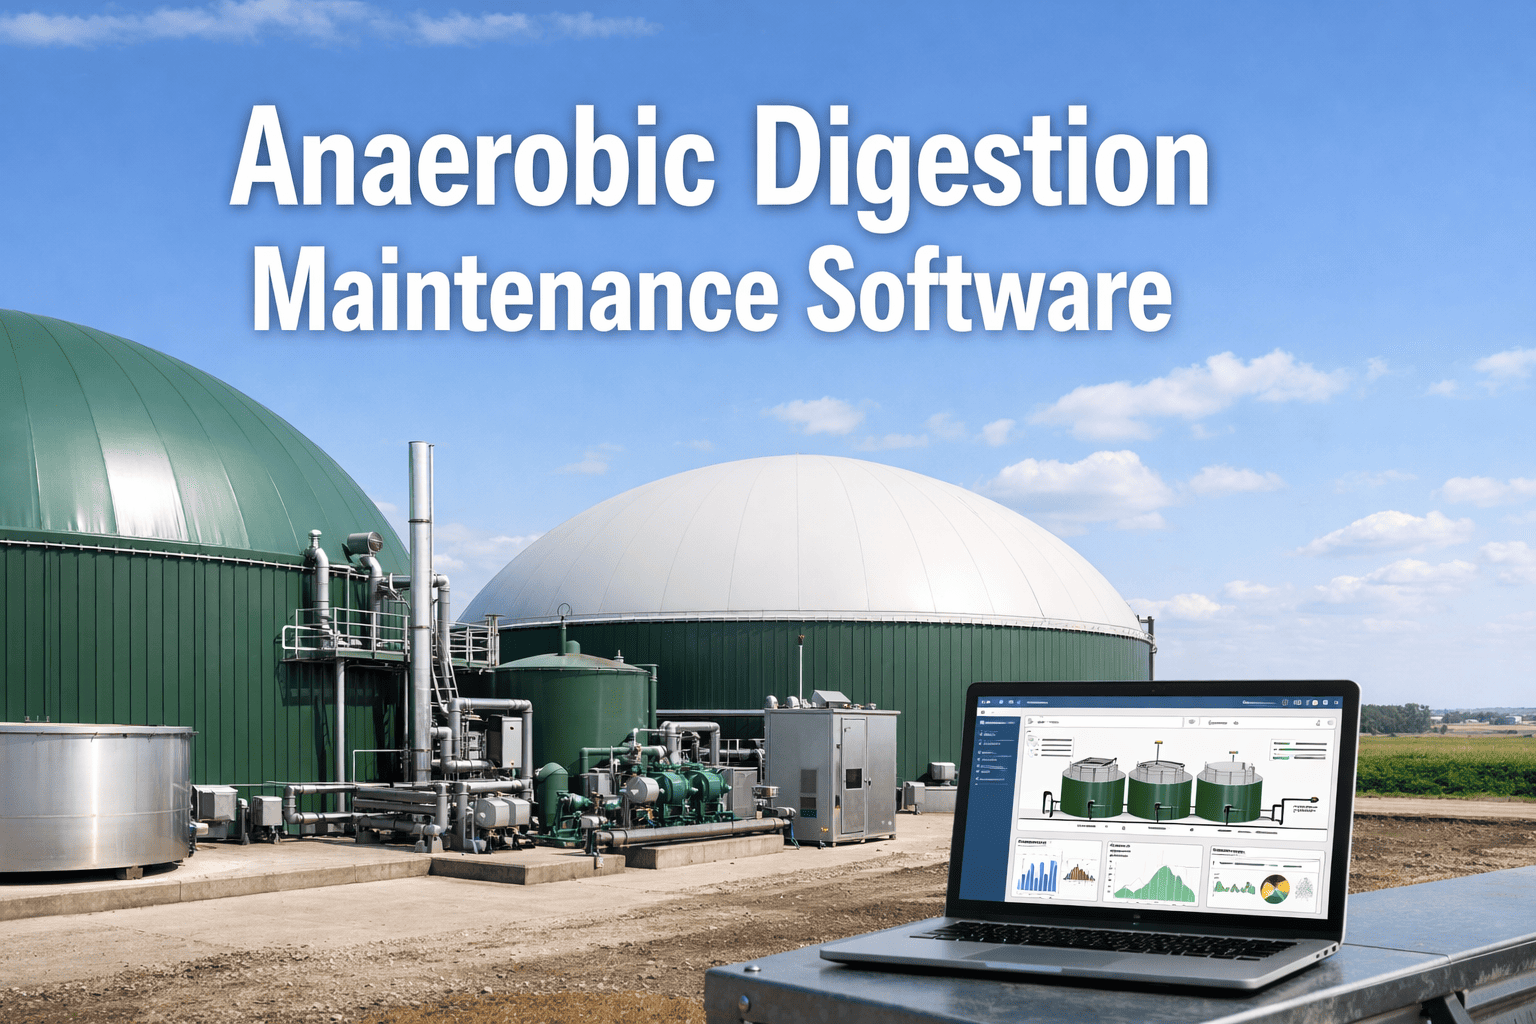
Most biogas plant energy audits fail to deliver measurable savings not because the data is wrong, but because the recommendations never make it to the control room floor. iFactory closes this loop by connecting audit recommendations directly to live energy monitoring, CHP efficiency tracking, and digester heat balance dashboards — transforming static audit findings into a living energy management system. Operations teams that Book a demo see how the platform converts audit data into a continuously updated energy performance model that tracks ECM realization in real time.
Turn Your Audit Findings into a Living Energy Management System
iFactory connects audit recommendations to real-time CHP, digester heat, and parasitic load monitoring — transforming static PDF reports into continuously validated energy savings.
Why Most Biogas Audits Never Deliver the Promised Savings
The anaerobic digestion industry spends millions annually on third-party energy audits — driven by ISO 50001 certification requirements, utility incentive programs, and internal sustainability targets. Yet the U.S. Department of Energy estimates that fewer than 15% of identified energy conservation measures are ever fully implemented. The gap is not in the quality of the audits; it is in the absence of a continuous feedback mechanism that translates audit-stage energy balances into operational reality.
| Audit Barrier | Impact on Savings | Root Cause | iFactory Solution |
|---|---|---|---|
| Static baseline assumption | ±15% error within 6 months | No live data validation | Continuous energy balance from live IoT |
| ECM prioritization by payback only | 50% of top ECMs never funded | No operational risk weighting | AI risk-score for each ECM |
| Paper-based recommendation tracking | 90% abandonment rate | No accountability loop | ECM lifecycle dashboard |
| Single-point measurement vs. trends | 40% overestimated savings | Snapshot data masks variability | 1-minute interval trending |
| No post-implementation M&V | Savings attribution impossible | No measurement & verification plan | IPMVP-compliant automated reports |
The 5-Phase Methodology for a Results-Driven Biogas Energy Audit
An energy audit that drives real savings follows a structured methodology that extends beyond data collection. Each phase builds on the previous one, and the most critical phase — implementation support — is the one most traditional audits omit entirely. The following framework aligns with ASHRAE Level 1, 2, and 3 audit standards while adding the continuous monitoring layer that turns an audit into a management system. Plant managers who Book a demo can see how iFactory digitizes each phase with pre-built energy audit templates and live data connectors.
Energy Audit KPIs That Drive Operational Decisions
The value of an energy audit is determined not by the thickness of its report but by the quality of its performance indicators. The most useful KPIs are those that connect audit findings directly to control room decisions — specific energy consumption, CHP electrical efficiency, digester heat balance, and parasitic load ratio. iFactory calculates these KPIs continuously from live sensor data, overlaying the audit baseline for real-time gap analysis. The metrics below represent the critical KPIs every biogas plant audit should establish and monitor.
ASHRAE Audit Levels Applied to Biogas Plant Systems
The American Society of Heating, Refrigerating and Air-Conditioning Engineers defines three levels of energy audit, each progressively more detailed and expensive. Choosing the correct level for your biogas plant depends on the maturity of your existing data, the capital available for ECM implementation, and whether you are pursuing ISO 50001 certification. iFactory's platform supports all three levels with pre-built data collection templates, temporary meter integration, and continuous M&V dashboards.
A Level 1 audit is a 1–2 day on-site assessment combining visual inspection with utility bill analysis. It identifies no-cost and low-cost ECMs — air leaks, insulation gaps, setpoint optimization — and provides a preliminary savings estimate with ±40% accuracy. This is the appropriate starting point for plants that have never conducted a formal energy audit or lack submetered energy data. Typical ECMs identified at this level include digestate heat recovery, CHP exhaust bypass reduction, and parasitic load reduction through pump scheduling. Book a demo to see the Level 1 walk-through checklist.
- Duration: 1–2 days on-site plus 1 week analysis
- Accuracy: ±40% savings estimate
- Typical ECMs identified: 10–25
- Cost: $5,000–$12,000 for a typical 1 MW plant
- iFactory add-on: Pre-populated data collection templates
A Level 2 audit is the industry standard for energy performance improvement. It involves deploying temporary metering on major energy systems, developing a base-year energy balance model, and conducting engineering-level analysis of each ECM. Minimum accuracy is ±20%.
- Duration: 3–4 weeks including 1 week on-site
- Accuracy: ±20% savings estimate
- Typical ECMs identified: 15–40
- Cost: $20,000–$45,000 depending on plant complexity
- iFactory add-on: Automated energy balance model from meter data
A Level 3 audit adds rigorous engineering simulation and life-cycle cost analysis for capital-intensive ECMs. It models each ECM against historical weather, feedstock, and market data to produce a probabilistic savings range. This level is required for projects seeking energy performance contracts (EPC), utility incentives, or internal capital committee approval for investments exceeding $250K..
- Duration: 6–8 weeks including 2 weeks on-site metering
- Accuracy: ±10% savings estimate with probabilistic bounds
- Typical ECMs evaluated: 5–15 deep-dive analyses
- Cost: $45,000–$95,000 for complex facilities
- iFactory add-on: Digital twin ECM simulation engine
Spreadsheet Audit vs. Continuous Energy Intelligence
The fundamental limitation of the traditional energy audit is that it produces a static recommendation set based on a snapshot of plant conditions. By the time the report is delivered, the plant has already changed. iFactory reframes the audit as the starting point of a continuous energy management system rather than the endpoint of a compliance exercise. The comparison below shows why this distinction matters for biogas operators who actually want to capture the savings their audits identify.
Stop Auditing. Start Managing Energy Performance Continuously.
iFactory connects biogas plant energy audit data to live CHP monitoring, digester heat balance tracking, and ECM lifecycle management — turning a static PDF into a living energy management system that delivers verified savings month after month.
Building the Continuous Energy Management System: A Phased Roadmap
Transitioning from periodic snapshot audits to a continuous energy management system follows a predictable progression. Each phase builds data infrastructure, organizational capability, and confidence in the energy performance model before advancing to the next. The roadmap below is based on iFactory's deployment experience across 40+ biogas facilities and aligns with ISO 50001 energy management system requirements. Operations directors who Book a demo receive a personalized implementation roadmap during their platform walkthrough.
Utility Data Digitization and Baseline Establishment
Connect utility meters, CHP telemetry, and digester temperature sensors to the iFactory platform. Establish the plant energy baseline with 12 months of historical data. Generate the first automated energy balance report. Timeline: 4–6 weeks.
Submeter Deployment and ECM Discovery
Install temporary or permanent submetering on identified high-consumption systems. Conduct a structured ECM discovery workshop with plant operators and maintenance teams. Prioritize ECMs by payback, operational risk, and capital availability. Timeline: 6–10 weeks.
ECM Implementation and Continuous M&V Activation
Execute approved ECMs with iFactory's ECM lifecycle tracking dashboard. Activate automated IPMVP Option C measurement and verification reports for each implemented measure. Establish monthly energy review meetings structured around verified savings data. Timeline: Ongoing.
Biogas Plant Energy Audit Methodology — Frequently Asked Questions
Transform Your Next Energy Audit from a Compliance Report into a Profit Center
iFactory connects biogas plant audit recommendations to live CHP monitoring, digester heat balance tracking, and automated IPMVP M&V — turning static findings into a continuously validated energy management system.