Biogas plants across North America and Europe are generating more operational data than ever before from SCADA systems, CHP controllers, and CMMS work order logs — yet most facilities still track maintenance KPIs through static spreadsheets updated weekly, manual data aggregation that consumes engineering hours, and reactive reporting cycles that treat every asset identically regardless of its actual reliability performance. Book a Demo to see how iFactory deploys a real-time KPI dashboard across your biogas plant data workflows within 5 weeks.
Why Biogas Plant KPIs Demand a Real-Time Dashboard
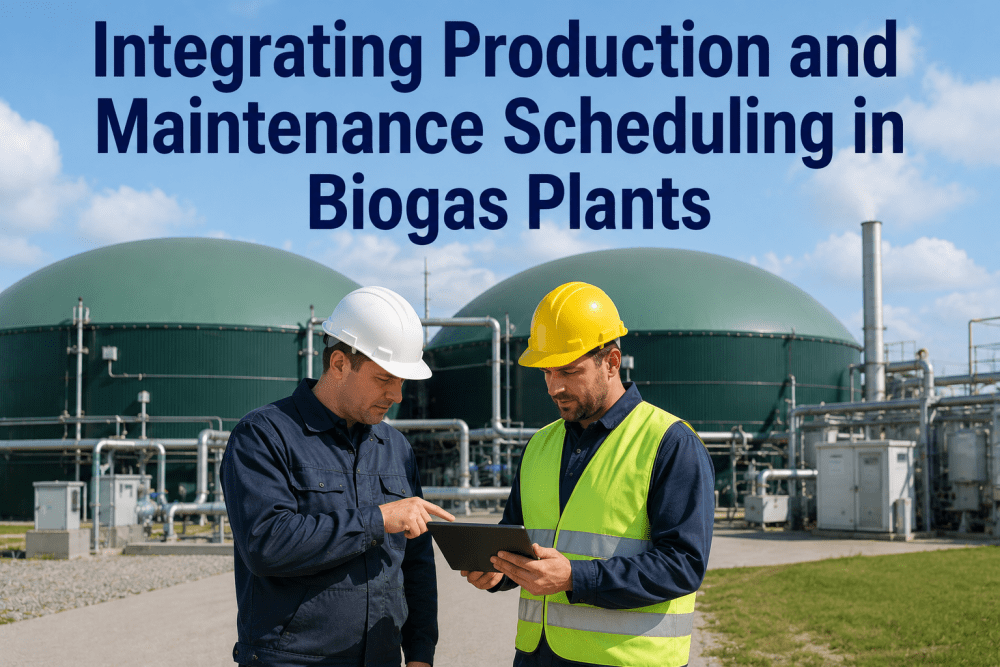
From CHP engines ingesting variable-quality biogas to digesters operating under continuous biological stress, from H₂S scrubbers requiring precise media-change timing to gas booster compressors cycling through seasonal load swings — every biogas asset class generates unique reliability signals that demand asset-specific KPI tracking. Most facility managers, however, are still managing maintenance metrics through disconnected spreadsheets, manual data entry, and monthly reporting cycles that produce insights weeks after the decisions needed to be made.
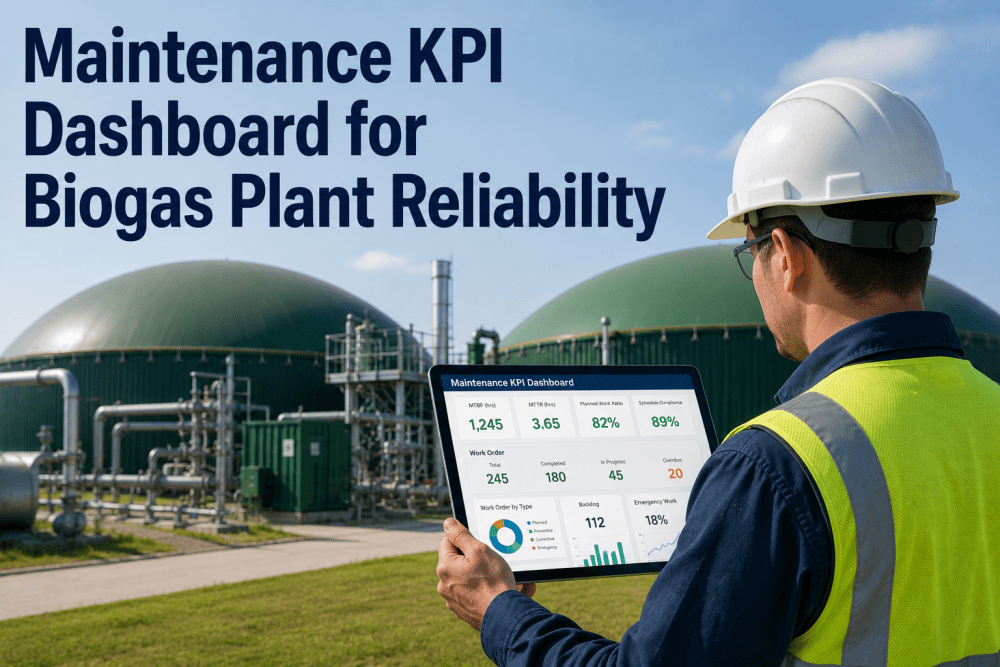
A real-time KPI dashboard trained specifically on your facility's asset hierarchy, CMMS history, and operational telemetry transforms idle data streams into a 24/7 reliability command center. Here is what that looks like across four critical biogas asset classes:
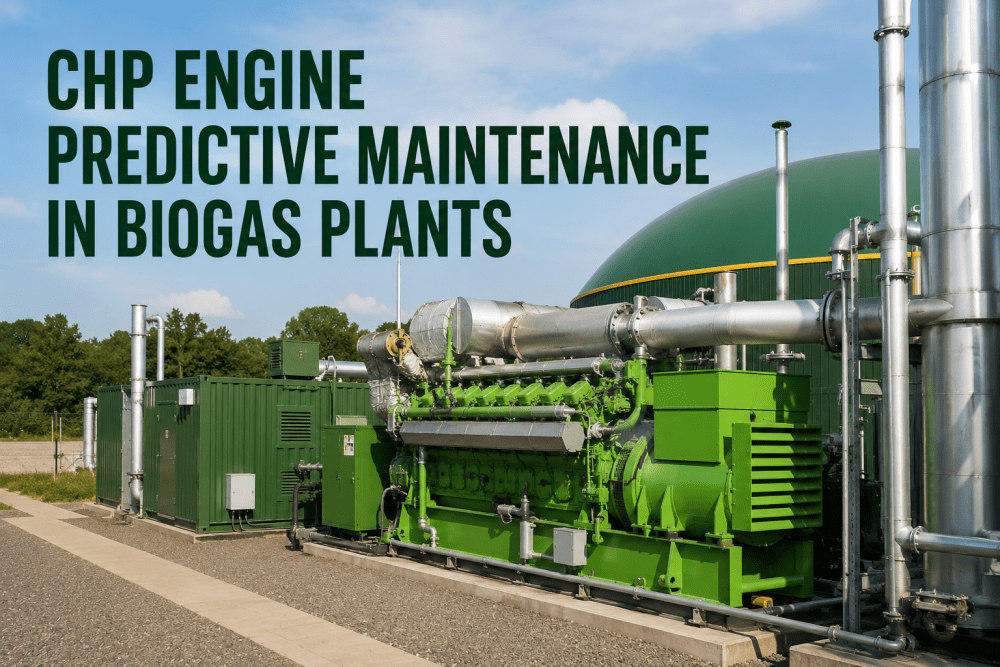
CHP engines consuming biogas face fundamentally different failure modes than natural-gas-fired units — valve recession from H₂S, spark plug fouling from siloxanes, and oil degradation from acid formation. iFactory's KPI dashboard tracks runtime hours, starts per day, spark plug resistance trends, oil analysis scores, and combustion efficiency in real time. Automated KPI alerts trigger work order creation when valve clearance drift exceeds 15 percent or oil TAN number breaches target. Reliability engineers using this dashboard report a 42 percent improvement in mean time between failures on CHP assets within the first six months.
Anaerobic digester reliability hinges on maintaining stable temperature, consistent feedstock loading, and controlled gas pressure. The KPI dashboard tracks digester temperature variance, gas production rate per ton of feedstock, volatile fatty acid ratio, and foam layer height. When any KPI trends outside its defined control limits, the system generates an automated reliability notification with root-cause correlation. Plants running iFactory's KPI dashboard have reduced emergency digester interventions by 35 percent through early detection of thermal excursions and overloading events.
H₂S scrubber media performance degrades gradually through channeling, surface poisoning, and moisture breakthrough — conditions invisible to manual inspection. iFactory's KPI dashboard monitors outlet H₂S concentration trending, media bed pressure drop, and replacement cycle compliance in real time. When outlet H₂S approaches the 100 ppm threshold (versus a 200 ppm alarm point), the dashboard flags the asset for planned media changeout, preventing the emergency bypass events that expose downstream CHP assets to corrosive gas. Facilities report an 89 percent reduction in H₂S breakthrough events after dashboard deployment.
Gas booster compressors, condensate management systems, and flare stack assets form the final link in the biogas value chain. The KPI dashboard tracks compressor discharge temperature, condensate pump runtime, vibration velocity, and seal gas differential pressure. Backlog aging and parts availability metrics are displayed alongside asset health to ensure maintenance planners can prioritize interventions with complete context. Mean time to repair has decreased by 35 percent at facilities using the dashboard's integrated parts-and-labor visibility features.
5 Root Causes of KPI Blind Spots in Biogas Plants
Most biogas plants pursuing improvements to their maintenance reliability programs encounter a predictable set of KPI tracking gaps that prevent them from converting data into action. Understanding these gaps before deploying a dashboard dramatically improves adoption and helps reliability teams focus their improvement efforts where they deliver the highest ROI. Maintenance managers who Book a demo consistently report that these five blind spots were eroding their maintenance effectiveness.
Building Your Biogas KPI Dashboard in 5 Steps
iFactory does not deploy a generic KPI template to your plant — it builds a customized dashboard hierarchy based on your specific asset register, CMMS data structure, and operational priorities. The deployment follows a structured 5-week program with defined deliverables per week and measurable ROI indicators beginning from week 3.
Proven KPI Results from Biogas Plant Deployments
iFactory's maintenance KPI dashboard delivers measurable reliability and cost improvements within the first 60 days of full production rollout. The following KPIs reflect aggregated performance data across CHP engines, digesters, gas treatment, and gas handling assets at operating biogas facilities.
How iFactory KPI Dashboard Compares to Spreadsheet Tracking
Most biogas plants manage maintenance KPIs through spreadsheets — a method that worked when plants had fewer assets and slower operating tempos. Modern biogas facilities require real-time visibility, automated calculation, and role-specific views that static spreadsheets cannot deliver.
| Capability | Spreadsheet KPI Tracking | iFactory KPI Dashboard |
|---|---|---|
| Data Refresh Frequency | Weekly or monthly manual data entry from multiple source systems | Continuous real-time refresh from connected CMMS and SCADA sources |
| KPI Calculation Accuracy | Formula errors, broken links, and version control conflicts common | Automated calculation with audit trail for every KPI value |
| Asset-Specific Views | Single flat view — all assets treated identically regardless of criticality | Role-specific dashboards configurable by asset class, area, or criticality tier |
| Alerting and Notifications | No automated alerting — KPI degradation discovered during manual review | Automated alerts when any KPI trends outside defined target range |
| Trend Analysis | Month-over-month manual comparison with no statistical trend detection | Automated trend direction analysis with early warning for degrading KPIs |
| Integration Depth | Standalone — no connection to CMMS, SCADA, or financial systems | Bidirectional API integration with CMMS, ERP, and historian platforms |
What Biogas Plant Reliability Managers Say
The following testimonial is from a plant reliability manager at a facility currently running iFactory's maintenance KPI dashboard at an operating biogas plant in the Midwest United States.
Conclusion: Stop Flying Blind on Your Biogas Maintenance KPIs
Biogas plants across the country are generating more maintenance and operations data every single day — data that sits in CMMS databases and SCADA historians while reliability teams manually compile spreadsheets to understand what happened last month. The gap between world-class reliability operations and the industry average is not a data availability gap. It is a visibility gap — a gap between having data and being able to act on it at the speed the plant operates.
iFactory's maintenance KPI dashboard closes that gap in five weeks. Asset-specific KPI scorecards trained on your own CMMS history and sensor data, automated real-time refresh that eliminates manual data work, role-specific views that give every team member the metrics they need, and automated alerting that flags degrading KPIs before they become reliability events — deployed at operating biogas facilities without disrupting plant operations or requiring custom dashboard development.