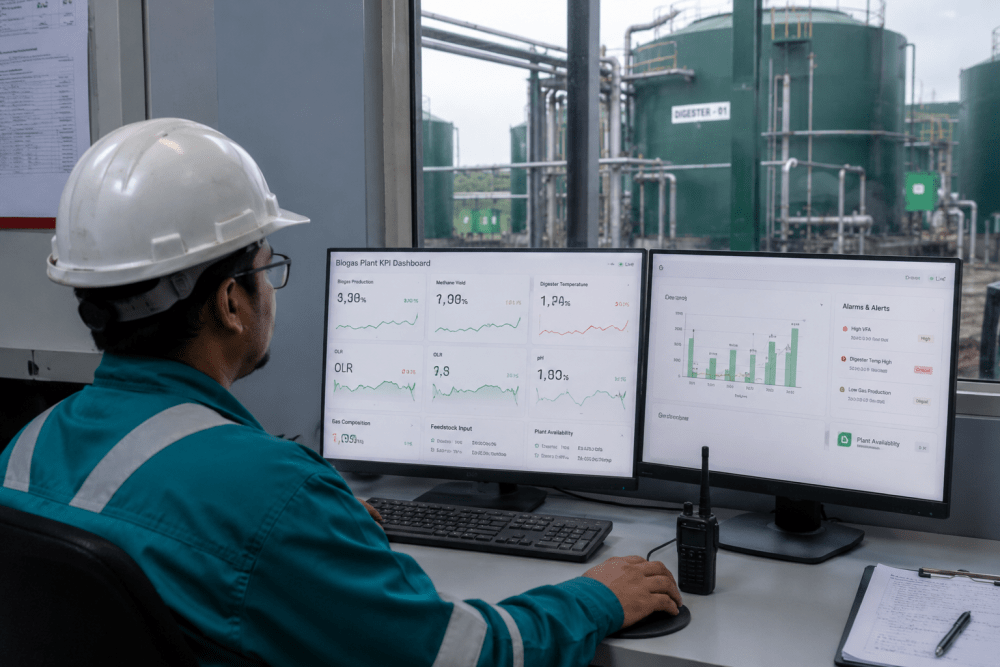
Biogas plant operators manage a continuous biological process that responds to dozens of variables in real time — feedstock composition, temperature, pH, volatile fatty acid concentration, organic loading rate, and microbial population dynamics, among others. Without live visibility into these critical parameters, operators make decisions on stale or incomplete data, reacting to process excursions after they have already reduced methane yield or compromised gas quality.book a demo
Are Your Operators Flying Blind on the Plant Floor?
Give every shift a real-time view of the KPIs that matter most — methane yield, digester health, gas quality, and production targets — in one unified dashboard designed for biogas operations.
Why Live KPI Tracking Is Reshaping How Biogas Operators Manage Production
Traditional approaches — clipboard rounds, end-of-shift log entries, after-the-fact SCADA reviews — simply cannot deliver the temporal granularity that modern biogas operations require. A live KPI dashboard bridges this gap by aggregating real-time sensor data, laboratory results, and production metrics into a single operational display that every operator can act on immediately. When plant managers book a demo, the most common discovery is that their existing data infrastructure already contains the signals they need — the missing piece is a dashboard that organizes those signals into actionable decisions.
Methane Yield & Gas Production
Track real-time biogas production rates and methane concentration per ton of volatile solids. Identify yield drops immediately and correlate with feedstock changes before they compound across multiple shifts.
Digester Health Monitoring
Monitor temperature, pH, VFA, alkalinity, and FOS/TAC ratio trends with configurable threshold alerts. Receive early warnings when key biological parameters drift outside optimal operating bands.
Gas Quality & Composition
Continuous real-time monitoring of CH4, CO2, O2, and H2S levels with automatic alerts for deviation from pipeline or CHP specifications. Detect contamination events the moment they occur.
Production Performance vs. Target
Display OLR, HRT, specific gas yield, CHP electrical efficiency, and plant uptime against daily and monthly targets. Identify cross-shift trends and drive continuous operational refinement.
Building a Unified KPI Dashboard Architecture for Biogas Operations
A purpose-built operator KPI dashboard must address five foundational requirements unique to continuous biological production: real-time data ingestion, process stability monitoring, gas quality tracking, performance benchmarking, and configurable threshold alerting. Operations teams that have already booked a demo consistently report that connecting their SCADA historian, lab information system, and production targets into a single unified dashboard is the most impactful step in their operational excellence journey — eliminating the data fragmentation that has historically forced operators to juggle multiple screens and spreadsheets.
| KPI Category | Primary Metric | Operational Application | Key Benefit | Priority Level |
|---|---|---|---|---|
| Methane Yield | Nm³ CH4 / ton VS | Digester performance | Real-time yield optimization | Critical |
| Gas Quality | % CH4, H2S ppm | Gas upgrading / CHP feed | Pipeline and engine compliance | Critical |
| Process Stability | Temp, pH, VFA, FOS/TAC | Biological health monitoring | Early instability detection | Critical |
| Production Efficiency | OLR, uptime, specific yield | Shift performance tracking | Data-driven operations | High |
| Energy Performance | CHP efficiency, gross kWh | Power generation analytics | Cost and margin optimization | Standard |
Five-Step Process for Deploying a Live Operator KPI Dashboard
Deploying a real-time KPI dashboard follows a structured methodology designed to align operational priorities with technical integration, ensuring that every shift sees actionable information from day one. Each phase builds on the previous one, minimizing disruption while maximizing operator adoption and data accuracy.
KPI Identification & Prioritization
Collaborate with shift supervisors and plant management to identify the 15-20 metrics that most directly impact gas production, process stability, and compliance. Classify each KPI by criticality, data source, and refresh frequency.
Data Source Mapping & Integration
Map every KPI to its data source — SCADA tags, laboratory LIMS entries, gas analyzer outputs, manual entry fields. Configure automated data pipelines using industry-standard protocols including Modbus, OPC-UA, and MQTT.
Dashboard Configuration & Visualization Design
Design role-specific dashboard views for operators, shift supervisors, and plant managers. Configure gauge displays, trend charts, heat maps, and alert indicators that communicate KPI status at a glance.
Operator Training & Pilot Deployment
Train shift teams on dashboard navigation, alert response procedures, and manual data entry workflows. Launch a two-week pilot across one shift rotation, collect structured feedback, and refine visualizations before full rollout.
Full Rollout & Continuous Refinement
Scale the dashboard across all shifts and control room stations. Use built-in usage analytics to identify adoption patterns, gather shift-specific feedback, and continuously refine KPI selection and visualization design.
"Before deploying iFactory's KPI dashboard, our operators were monitoring digester health through manual temperature checks every four hours and sending VFA samples to the lab once per shift. We were always two to eight hours behind the real state of the process. Now every critical KPI — methane yield, temperature trend, VFA accumulation, gas composition — is displayed in real time on the control room screen. We have reduced process instability events by 70% and increased average methane concentration from 54% to 58% within the first six months."
Top Operational Gaps in Biogas KPI Visibility and Management
Most biogas plants pursuing operational excellence encounter a predictable set of gaps in how they capture, display, and act on performance data. Understanding these gaps before deploying a dashboard platform dramatically improves implementation success and helps plant managers focus resources on the highest-impact improvements.
Critical process data captured on clipboards or through periodic SCADA reviews reaches operators hours after the fact — making real-time intervention impossible and allowing process drift to compound across multiple shifts.
SCADA historian, gas analyzer outputs, lab LIMS, and manual shift logs exist in disconnected systems. Operators toggle between multiple screens and spreadsheets to assemble a complete picture of plant status.
Without threshold-based alerts on key KPIs like VFA, temperature, or H2S, operators must continuously scan raw data for signs of instability — leading to missed early warnings and reactive crisis management.
Each shift records KPIs in their own format and level of detail. Cross-shift trend analysis is impractical, and plant managers cannot compare performance consistently across the 24-hour operating window.
Operators see individual data points but lack tools to correlate feedstock changes with methane yield, or temperature drift with VFA accumulation. Root cause analysis relies on tribal knowledge rather than data evidence.
When operators leave the control room for rounds or troubleshooting, they lose access to real-time KPI data. Critical decisions on the plant floor are made without the full operational picture.
Closing these gaps requires more than a generic analytics tool — it demands a purpose-built operator dashboard designed for the real-time, multi-variable nature of biogas production. Operations directors regularly book a demo to benchmark their current visibility gaps against a proven industrial dashboard architecture.
Integrating Live KPI Dashboards with Existing Biogas Plant Infrastructure
One of the most technically critical aspects of KPI dashboard deployment is the reliable integration with existing plant instrumentation and control systems. Biogas plants typically operate with a mix of legacy SCADA platforms, modern gas analyzers, laboratory information systems, and manual data entry workflows — all of which must feed into a single unified display without disrupting ongoing operations. A robust KPI dashboard platform supports this by offering flexible connectivity options, standardized data mapping, and redundant data paths that ensure continuous availability. Plant engineers who book a demo consistently find that the integration layer of modern dashboard platforms is far more adaptable than they expect — capable of connecting to virtually any combination of automation and lab systems found in an AD plant.
Key KPI Dashboard Capabilities for Modern Biogas Plants
Ingest data from SCADA, PLC, gas analyzers, and lab systems using Modbus, OPC-UA, MQTT, or REST APIs. Normalize all data streams into a unified time-series database with sub-minute refresh intervals.
Design role-specific dashboard layouts with trend charts, gauge widgets, heat maps, and alert indicators. Drag-and-drop configuration enables plant managers to adapt displays without IT involvement.
Configure multi-level alerts for every KPI with warning, critical, and rate-of-change thresholds. Alerts route to control room displays, mobile devices, and shift log entries automatically.
Deliver the same KPI display on control room workstations, plant-floor tablets, and operator mobile devices with responsive layouts optimized for each screen size — including offline fallback mode.
The Future of Biogas Operations Is Live and Data-Driven
The transition from clipboard rounds and periodic SCADA checks to live, unified KPI dashboards represents a fundamental shift in how biogas plants manage production execution.For plant managers pursuing world-class operational performance, the path forward is unmistakable — and the reason more facility directors book a demo is that they recognize that real-time KPI visibility is no longer a competitive advantage — it is an operational necessity.
Put Live KPI Data in Every Operator's Hands
Deploy a unified real-time KPI dashboard that integrates SCADA data, gas quality analytics, laboratory results, and production targets — built specifically for anaerobic digestion plant operations.
Biogas Plant Operator KPI Dashboard — Common Questions Answered
What are the most critical KPIs for biogas plant operators to track live?
The highest-impact live KPIs are methane production rate (Nm³/h), methane concentration (%), digester temperature, VFA concentration, FOS/TAC ratio, pH, and H2S levels. These seven metrics provide a complete picture of process stability, gas quality, and biological health in real time.
How often is the KPI data refreshed on the dashboard?
Sensor-based KPIs such as temperature, gas composition, and flow rate refresh every 1-5 seconds. Laboratory-based KPIs including VFA and alkalinity update when new lab results are entered. The dashboard displays the refresh interval for each KPI so operators always know the currency of the data they are viewing.
Can I customize the dashboard for my specific plant configuration?
Yes. The platform includes a drag-and-drop visualization builder that allows plant managers to configure role-specific dashboard views. You can select which KPIs appear, choose visualization types (gauges, trend charts, heat maps), set custom threshold alerts, and organize displays by process area or shift responsibility.
Does the platform integrate with our existing SCADA and control systems?
Yes. The platform supports Modbus, OPC-UA, MQTT, BACnet, and REST API connections. It can ingest data from the majority of SCADA platforms, PLC brands, and gas analyzer systems commonly found in North American biogas plants — including Allen-Bradley, Siemens, GE, and Schneider Electric.
Is the KPI dashboard accessible on mobile devices for operators in the field?
Yes. The platform delivers responsive KPI displays optimized for control room workstations, plant-floor tablets, and smartphones. Operators on rounds or troubleshooting in the digester hall can view real-time KPIs, receive alerts, and acknowledge notifications from any device with network connectivity.