Most continuous improvement programs start with real energy: a kaizen event, a suggestion box, a KPI wall painted with good intentions. Then six months pass, the whiteboard gets erased for a different meeting, and nobody can say with certainty whether last quarter's improvement initiatives actually moved the numbers. The problem is rarely a lack of ideas, it is a lack of a system that connects ideas to measurable, sustained results. Book a demo to see how AI-driven analytics keep continuous improvement continuous, instead of a quarterly event that fades by the next audit.
Continuous Improvement That Actually Stays Continuous
iFactory pairs Lean and Kaizen methodology with AI-generated operational insight and automated KPI tracking, so improvement initiatives are prioritized by real data, tracked to completion, and measured against sustained results rather than a single good quarter.
The Predictable Reasons Continuous Improvement Loses Momentum
Cement plants are not short on improvement ideas. Operators, maintenance techs, and shift supervisors see inefficiency every day, from a mill that keeps overheating to a changeover that always runs long. The gap is between spotting the problem and turning it into a tracked, resourced, measured initiative that survives past the initial enthusiasm.
Traditional CI programs typically rely on manual data pulls, spreadsheet KPI trackers, and periodic kaizen events that generate a burst of activity followed by a long stretch of nothing. Without a live feed of operational data, teams cannot tell whether an implemented change actually held, so the same problems tend to resurface within a year, sometimes framed as a brand new initiative.
A Living Plan-Do-Check-Act Cycle, Not a Poster on the Wall
The plan-do-check-act cycle is a familiar framework in most plants, but it usually exists as a training concept rather than an active system. iFactory turns each stage into something the platform actively supports with data, rather than something a team has to manually track on their own.
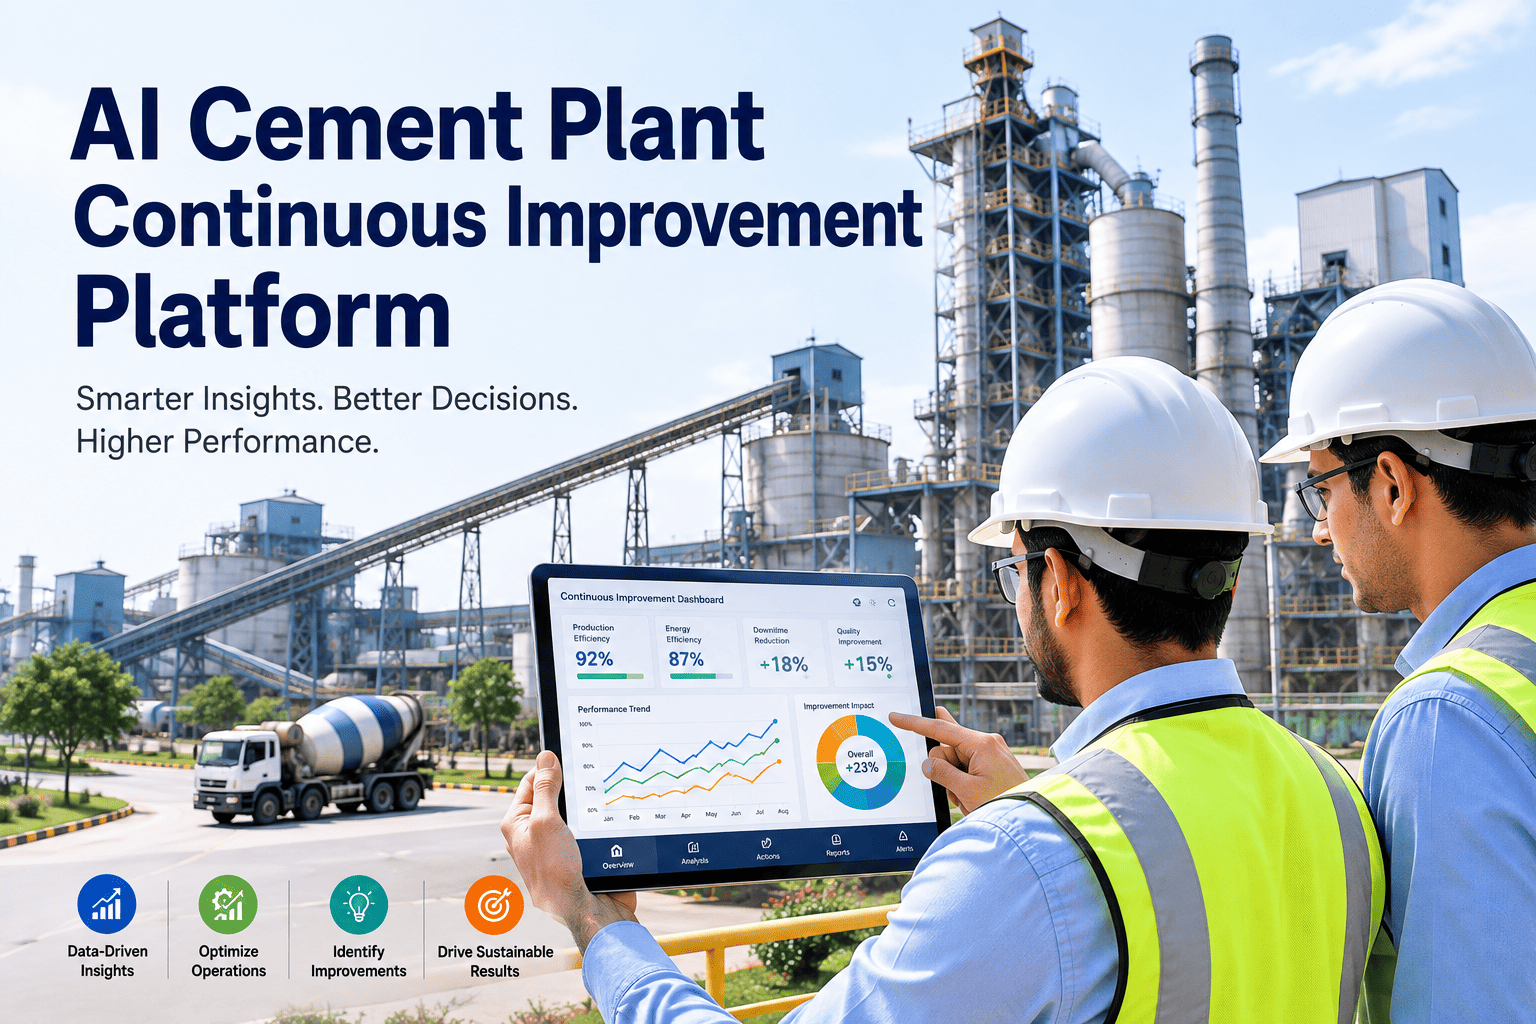
A Dashboard That Shows Whether Improvement Is Actually Happening
KPI walls in most plants get updated weekly or monthly, by hand, from whatever data someone had time to pull. iFactory keeps the core operational excellence metrics current continuously, so a KPI dashboard reflects this shift, not last month.
Stop Relying on a Monthly Snapshot to Know If Improvement Is Working
iFactory keeps the KPIs behind every improvement initiative updated continuously, so teams know within days, not months, whether a change is delivering the result it was meant to.
How AI Analytics Surface Opportunities Nobody Was Actively Looking For
A kaizen event can only improve what someone thought to bring up in the room. AI analytics continuously scan operational data across the whole plant, surfacing patterns and correlations that would be nearly impossible to spot through manual review alone.
What Changes When Continuous Improvement Gets Data-Driven
The core Lean and Kaizen principles do not change, but the mechanics of how a plant finds, prioritizes, and verifies improvement work look very different once AI analytics are part of the process.
| Element | Traditional CI Program | AI-Driven Continuous Improvement |
|---|---|---|
| Opportunity identification | Relies on team observation and periodic events | Continuously surfaced from live operational data |
| Prioritization | Based on team consensus or seniority | Ranked by data-estimated impact and effort |
| KPI tracking | Manual, updated weekly or monthly | Continuous, updated in near real time |
| Result verification | Assumed if the team feels it worked | Statistically confirmed against baseline data |
| Sustainment | Depends on team memory and habit | Automatically flagged if a metric drifts back |
Following One Improvement Idea Through the Full Cycle
Seeing the stages laid out individually helps, but it also helps to see how a single idea actually moves through the system from first flag to sustained result.
Where Does Your Plant's CI Program Currently Sit
Most plants recognize themselves somewhere in this progression. Knowing where you currently sit helps clarify what the next practical step actually looks like.
Continuous Improvement Applies Well Beyond the Production Line
Operational excellence initiatives often start on the production floor, but the same data-driven approach applies to nearly every department that touches plant performance.
Common Questions About AI-Driven Continuous Improvement
Does this replace Lean and Kaizen methodology, or work alongside it?
It works alongside existing methodology rather than replacing it, since the core Lean and Kaizen principles of eliminating waste and pursuing incremental improvement remain the foundation. What changes is how opportunities get identified and how results get verified, moving from manual observation and periodic review toward continuous, data-backed insight. Plants with an established Lean culture typically find the AI layer accelerates and sustains what their teams were already trying to do manually. Book a demo to see how AI analytics integrate with an existing Lean or Kaizen program.
How does the platform avoid flagging too many low-value insights and creating noise?
Insights are ranked by estimated impact and statistical confidence before they ever reach a team, filtering out normal day-to-day variation that would otherwise generate false alarms. The ranking also weighs recurrence, since a one-time anomaly is treated very differently from a pattern that has repeated across multiple shifts or weeks. Teams can also tune sensitivity thresholds for their specific area, so a high-volume line and a low-volume specialty process do not get held to the same flagging criteria. Contact support to review how insight thresholds get configured for different plant areas.
What data does the platform need access to before it can start surfacing insights?
The platform draws on existing operational data sources already present in most plants, including production and downtime logs, quality records, energy metering, and maintenance history, connecting to these systems rather than requiring a separate data collection effort. Plants with more mature data infrastructure typically see useful insights faster, but even facilities with fragmented data sources can start with the systems that are already digitized and expand connectivity over time. Book a demo to review what data sources your plant already has that can connect immediately.
How is a sustained result distinguished from a temporary improvement that will fade?
Sustained results are confirmed by continuing to track the relevant KPI well after an initiative is marked complete, rather than closing the loop the moment the metric first improves. If performance drifts back toward baseline at any point, the system automatically flags the initiative for reassessment instead of letting it quietly slip back to old behavior unnoticed. This ongoing verification is one of the biggest practical differences from a traditional kaizen event, where sustainment is often assumed rather than actively checked.
Can this platform support a formal operational excellence maturity assessment?
Yes, the continuous KPI tracking and initiative history the platform builds up over time provide concrete evidence for exactly the kind of maturity assessment most operational excellence frameworks call for, replacing anecdotal self-assessment with documented performance trends. This is particularly useful for plants working toward a formal certification or corporate operational excellence standard, since auditors and assessors generally respond better to continuous data than to a summary compiled just before the review. Contact support to discuss how platform data can support a formal maturity assessment process.
Make Continuous Improvement Actually Continuous
iFactory connects Lean and Kaizen methodology to live operational data, so improvement initiatives get prioritized by evidence, tracked to completion, and verified to actually hold.