A cement plant manager who only ever looks at their own plant's maintenance numbers is working with half the picture, because a metric only means something in comparison. Spending $8.50 per tonne on maintenance can look perfectly controlled on a standalone budget report while sitting in the bottom quartile against global peers running the same kiln and mill circuits for $5.50 per tonne, and the plant manager reading only their own dashboard has no way to know which one they are. Most cement groups running multiple sites find a fifteen to twenty-two percent OEE spread across plants operating identical equipment, and that gap is almost always a maintenance discipline difference rather than a technology difference. iFactory's AI benchmarking engine closes that visibility gap by comparing every plant, line, and equipment class against peer and industry-quartile data continuously, with the underlying methodology explained at iFactory support.
AI Analytics · Maintenance
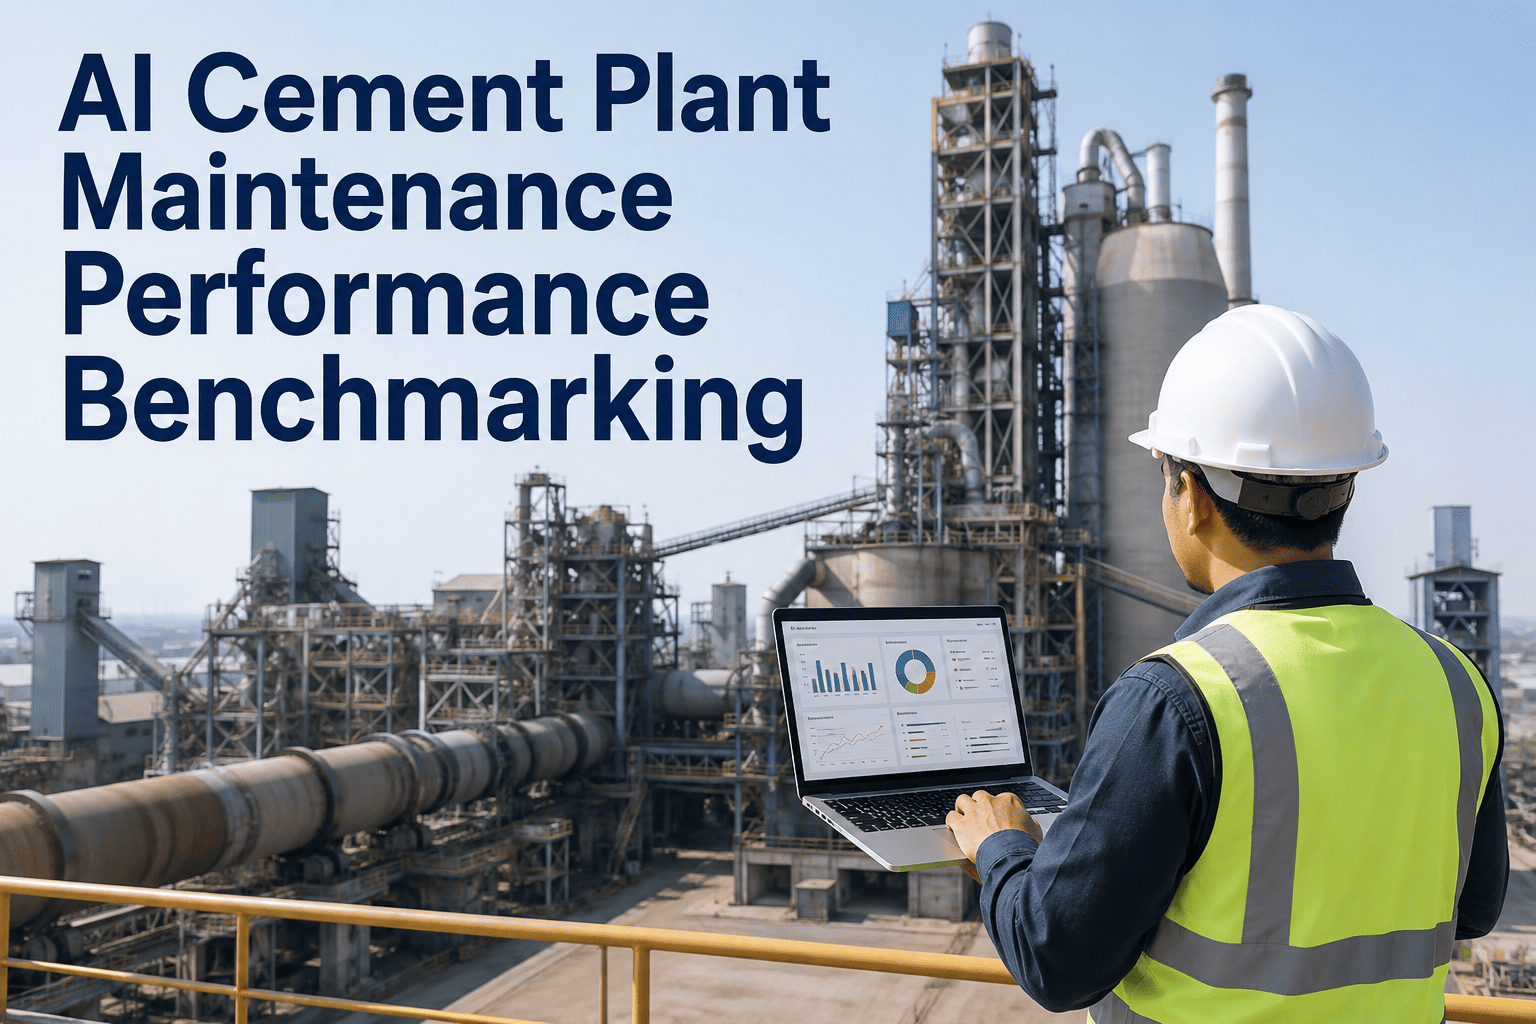
AI Cement Plant Maintenance Performance Benchmarking
Compare maintenance performance across plants, production lines, and individual equipment classes using AI analytics that benchmark every core KPI against peer data and industry quartiles, turning an isolated number into an improvement target.
15-22%
Typical OEE spread found across cement plants running identical equipment classes
15-25%
Share of total cement production cost consumed by maintenance and operating expense
4-6x
Cost of a reactive emergency repair compared to the same intervention performed as planned work
80%+
Planned maintenance ratio industry target, against a global average closer to 60-70%
Why a Single Plant's KPIs Mislead
A Number Without a Comparison Isn't an Insight
Maintenance teams already track plenty of numbers. What most cement operations lack is not data, it is the context to know whether that data represents strong performance, average performance, or a quietly expensive problem hiding behind an acceptable-looking figure.
01
Absolute Spend Hides Relative Position
A maintenance cost per tonne figure that looks stable year over year can still be sitting well below top-quartile peer performance, and nothing on a single-plant report will ever reveal that gap.
02
Site-Level Averages Bury Line-Level Problems
A plant-wide OEE figure can look acceptable while one specific mill circuit or kiln line is dragging the average down, a distinction that only becomes visible once performance is broken out and compared at the line and equipment level.
03
Best Practices Stay Trapped at One Site
A preventive maintenance schedule refined over years at one plant rarely makes it to a sister site without a deliberate benchmarking process to surface which site is actually outperforming and why.
04
Manual Reporting Lags the Decision Window
When cross-plant comparison depends on spreadsheets assembled monthly or quarterly, the underperforming line has often been draining budget for weeks before anyone at group level even sees the gap.
The Core Benchmarking Framework
Six KPIs Every Top-Quartile Cement Group Tracks Across Every Site
KPI
What It Measures
World-Class Benchmark
Common Global Average
OEE
Availability × performance × quality combined into one number per line
85-92%
Wide spread, often 15-22 points below peers on identical equipment
MTBF
Average operating time between unplanned failures by asset class
8-12% year-on-year improvement for top-criticality assets
Flat or declining at plants without cross-site trend comparison
MTTR
Time from failure detection to full restoration of operation
25-40% reduction achievable with automated digital work orders
Driven up by spare parts and contractor mobilization delay
Planned-to-Reactive Ratio
Share of maintenance work scheduled in advance versus responding to failure
Above 80% planned
60-70% planned, with many sites structurally reactive below 55%
PM Compliance
Share of scheduled preventive tasks actually completed on time
Above 90%
Often 38 points below target at plants using manual scheduling
Maintenance Cost per Tonne
Total maintenance spend normalized to clinker or cement output
Bottom-quartile cost position at top-quartile availability
$3 per tonne spread commonly found between sister plants
Two Plants Running the Same Kiln and Mill Circuits Can Sit Twenty OEE Points Apart, and Neither One Would Know It From Their Own Dashboard Alone.
iFactory's AI benchmarking engine compares every plant, line, and equipment class against peer and quartile data continuously, so the gap shows up before it costs another quarter of margin.
Reading the Comparison
What Quartile Positioning Actually Tells a Plant Manager
Top 25%
Setting the Internal Standard
The highest-performing site or line in the group becomes the internal benchmark, and AI analysis of what that site is actually doing differently, whether it is PM schedule discipline, spare parts availability, or technician routing, becomes the template for the rest of the group.
Median
The Realistic Near-Term Target
A site sitting well below the median has a clear, achievable first target before chasing top-quartile performance, and closing that gap alone is often where the largest and fastest cost savings are found.
Bottom 25%
Where Group Attention Should Concentrate
A site or line that consistently sits in the bottom quartile across multiple KPIs simultaneously, not just one, is the strongest signal that group-level intervention, whether investment, retraining, or process redesign, will deliver the highest return.
What Benchmarking Actually Surfaces
The Root Causes Behind Most Cross-Plant Performance Gaps
PM Schedule Discipline
The single largest driver of MTBF and OEE spread between sister plants running the same equipment is almost always how consistently preventive maintenance is actually executed on schedule, not what the schedule says on paper.
Spare Parts Positioning
MTTR differences between plants frequently trace back to which site has the right spare parts staged locally versus which one is waiting on a group-level or emergency order once a failure has already occurred.
Root Cause Analysis Depth
A large share of logged failure causes in legacy systems describe a symptom rather than the underlying failure mechanism, and plants that enforce deeper root cause analysis consistently show better repeat-failure rates on the same asset class.
Technician Routing and Skill Matching
Two plants with identical headcount can show very different MTTR performance depending on how effectively work orders are routed to the technician with the right specialization for that specific failure mode.
Field Example
A Four-Plant Cement Group Closing a $3.20-per-Tonne Cost Gap
A cement group operating four plants with broadly similar kiln and mill configurations had never had a normalized way to compare maintenance performance across sites, since each plant tracked its own KPIs using slightly different definitions and reporting cadences. Group-level reviews relied on quarterly spreadsheets assembled manually from each site, by which point any underperforming line had already been draining budget for months without a clear root cause identified.
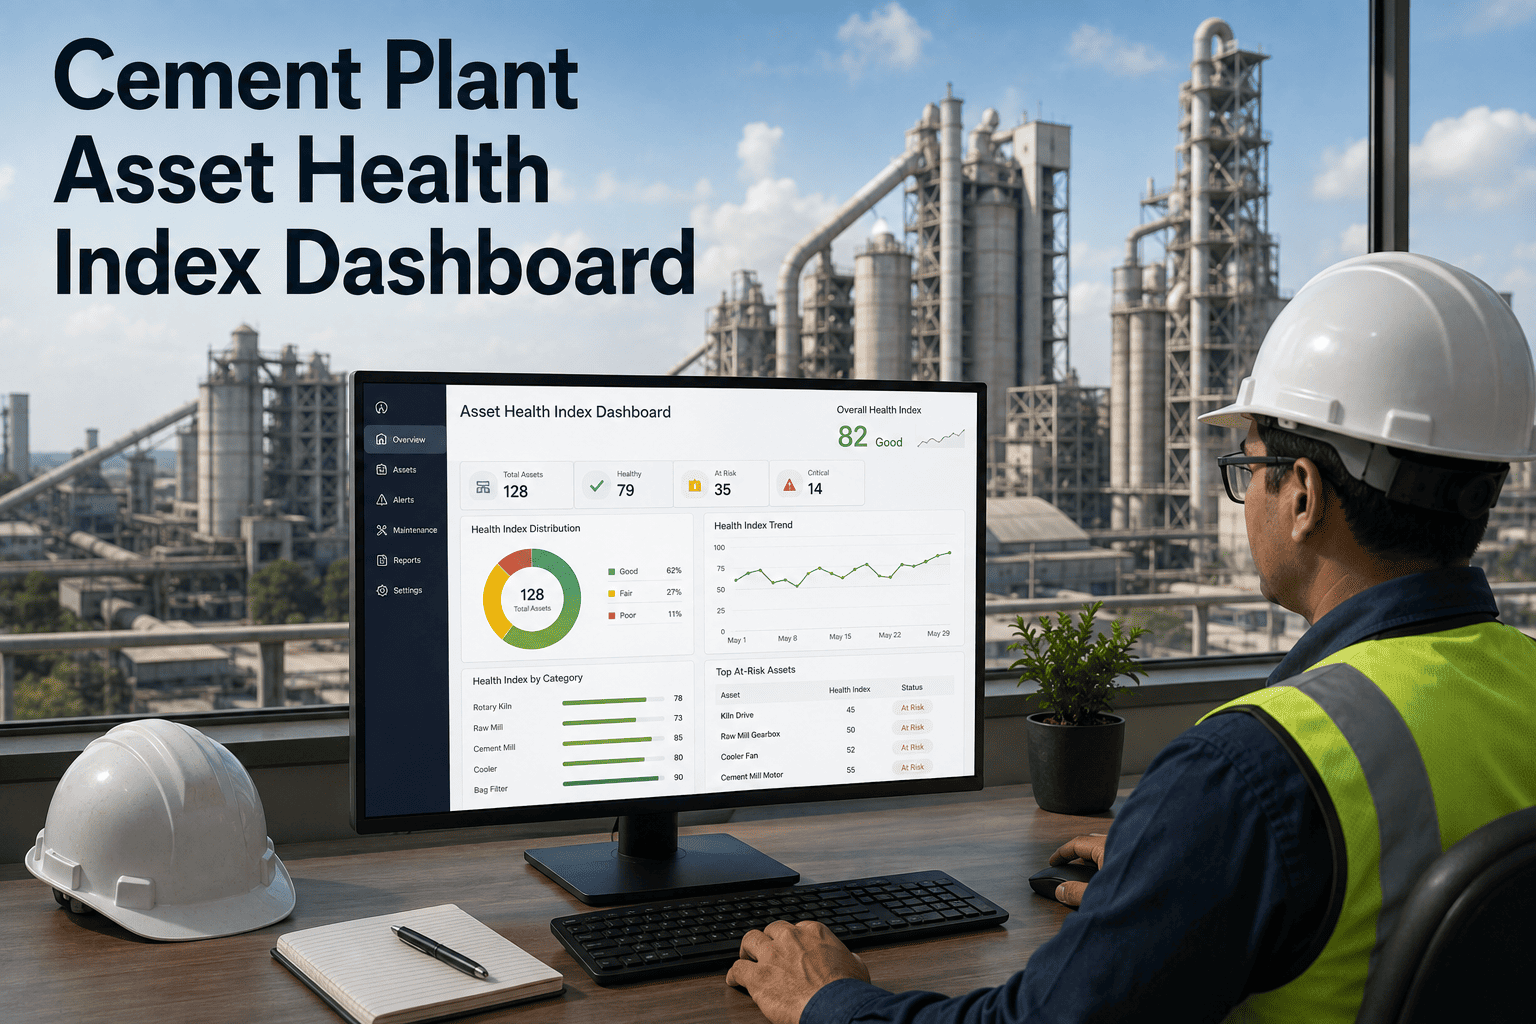
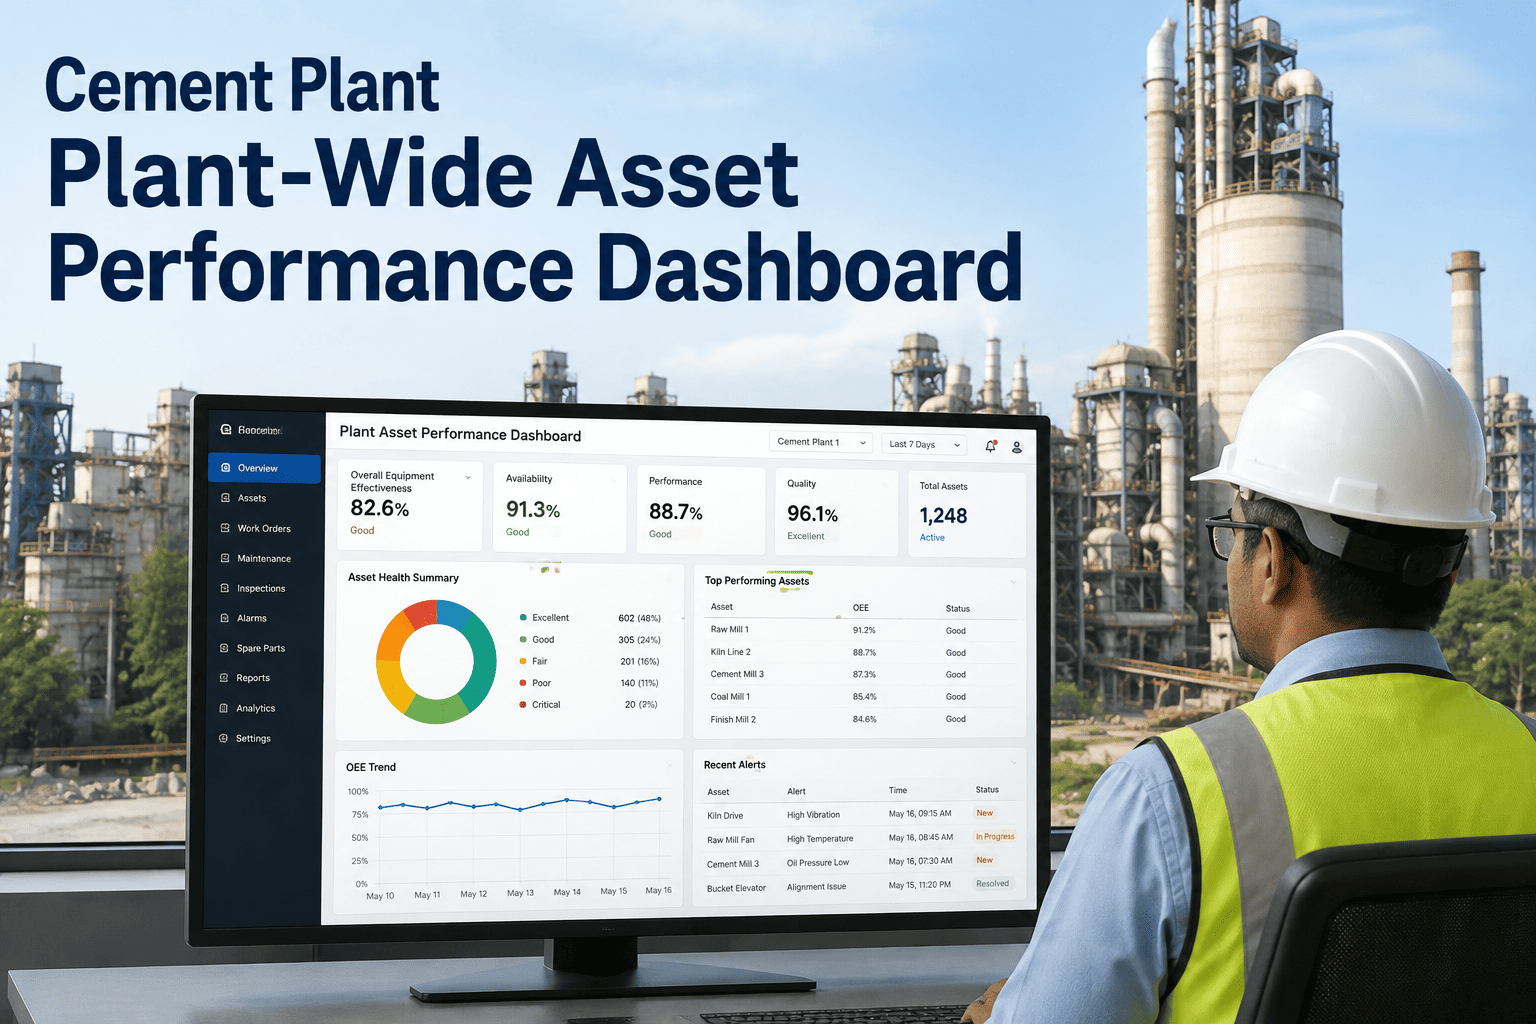
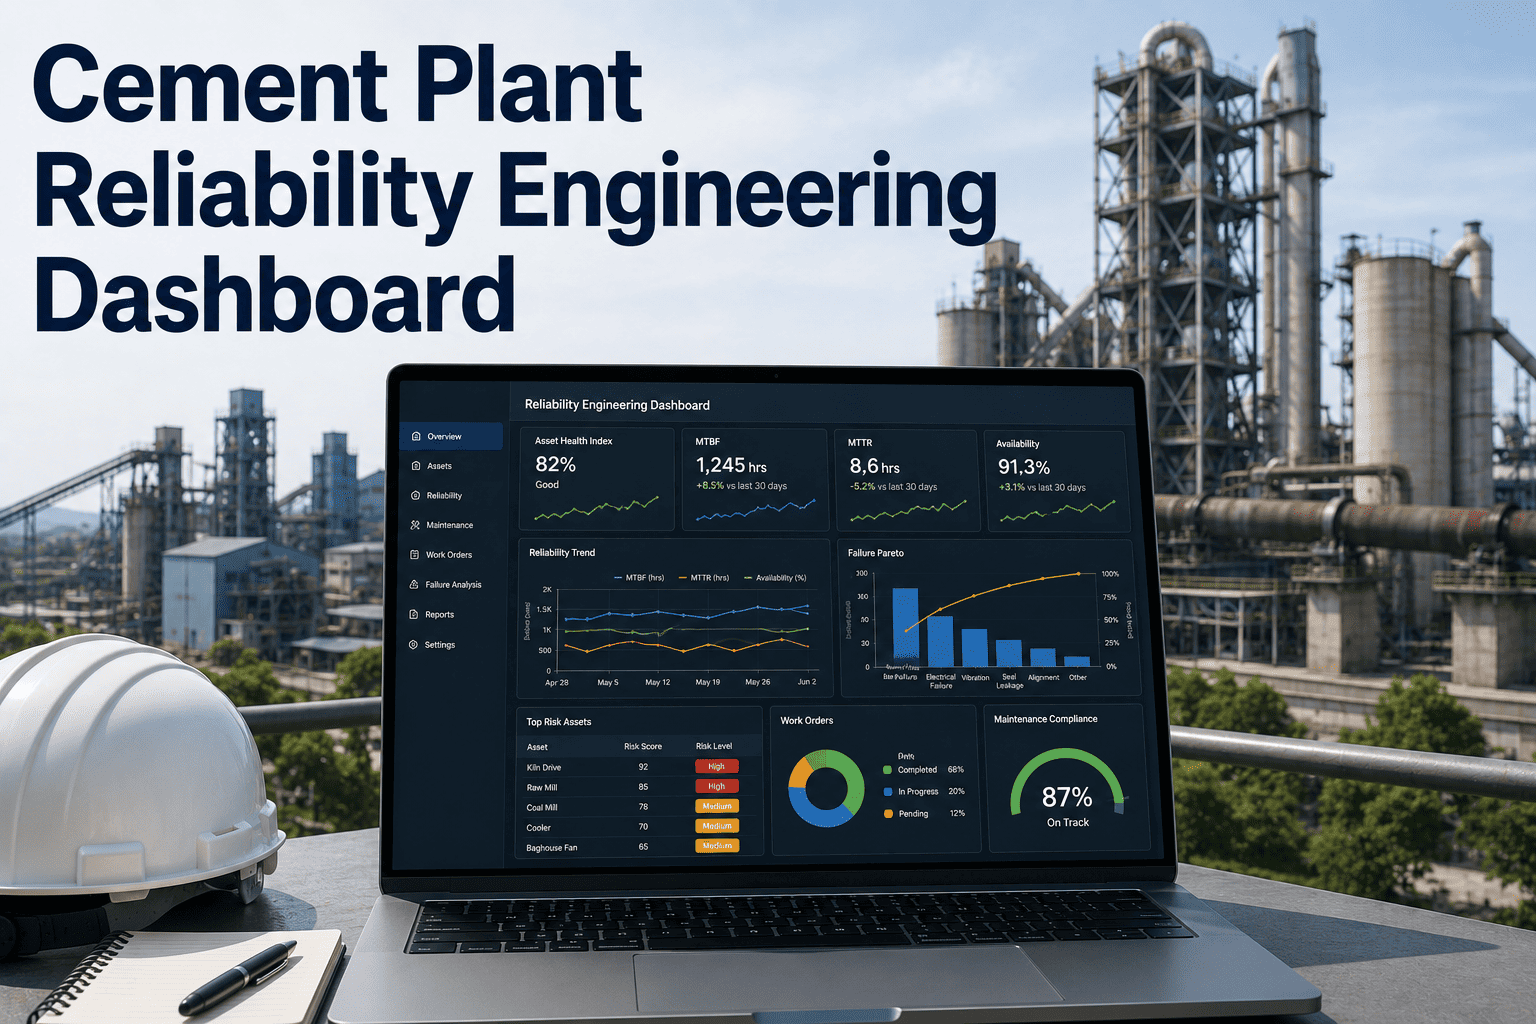
iFactory connected each plant's work order data into a centralized AI benchmarking dashboard that calculated OEE, MTBF, MTTR, PM compliance, and planned-to-reactive ratio automatically and continuously across all four sites using one consistent methodology. Within the first reporting cycle, the group discovered a $3.20-per-tonne maintenance cost gap between its best- and worst-performing plants, traced primarily to one site running a 54 percent planned maintenance ratio against 80 percent at the top-performing plant. The AI system identified which specific preventive maintenance patterns at the top-performing site correlated with its higher MTBF and lower reactive ratio, and the group standardized that PM schedule as the baseline across all four plants. The underperforming site's planned ratio rose from 54 percent to above 75 percent within two quarters, closing the majority of the cost-per-tonne gap without any new capital equipment investment.
$3.20/tonne
Maintenance cost gap identified between best and worst plants
54% to 75%+
Planned maintenance ratio improvement at the lagging plant
2 quarters
Time to close the majority of the cost gap
Frequently Asked Questions
What Multi-Site Cement Groups Ask Before Standardizing Benchmarking
How do you compare plants fairly when equipment ages and configurations differ?
Fair comparison starts with normalizing KPIs by asset class and production capacity rather than comparing raw totals across plants of different sizes or vintages, so a smaller or older plant is measured against realistic peer expectations rather than penalized for scale alone. The benchmarking engine groups equipment into like-for-like categories, such as comparable kiln capacities or mill types, and calculates quartile positioning within those groups, which is what makes a comparison between a newer and an older plant meaningful rather than misleading.
Does this replace the KPI reporting our plants already do individually?
It builds on top of existing work order and maintenance data rather than replacing how individual plants operate day to day, calculating the same core metrics, OEE, MTBF, MTTR, PM compliance, and planned-to-reactive ratio, automatically and consistently across every site instead of leaving each plant to define and report them independently. The main shift is moving from a manually assembled quarterly comparison to a continuously updated one, so group-level decisions are based on current data rather than a snapshot that is already months old by the time it reaches leadership.
How quickly can a multi-site group see its first benchmarking report?
Once each site's work order data is connected, KPI calculation and cross-plant comparison typically begin generating automatically within days rather than requiring a lengthy manual setup process, since the calculations draw directly from existing maintenance records instead of requiring new data entry. A group's first meaningful quartile comparison across sites is usually available within the first full reporting cycle, with the underlying trend data becoming more reliable as additional weeks of continuous data accumulate.
Can benchmarking go below the plant level, down to individual lines or equipment?
Yes, and this is often where the most actionable findings surface, since a plant-wide average can look acceptable while masking one specific kiln line or mill circuit that is significantly underperforming its peers elsewhere in the group. Breaking benchmarking down to the line and equipment class level is what lets a maintenance manager target the specific asset dragging down the site average rather than applying a generic improvement plan across an entire plant. To see how granular the comparison can go for your specific asset configuration,
book a demo.
What is the fastest way to act on a benchmarking gap once it's identified?
The most common and fastest-acting intervention groups take is standardizing the preventive maintenance schedule of the top-performing site as the new baseline across underperforming sites, since PM schedule discipline is consistently the largest single driver of the OEE and MTBF spread found between plants running comparable equipment. Spare parts positioning and technician routing improvements typically follow as a second wave once the PM standardization has closed the largest share of the gap. Reach out through
iFactory support for guidance on sequencing a specific multi-site rollout.
Stop Managing Every Plant as If It Were the Only One in the Group.
AI-driven benchmarking across every plant, line, and equipment class, turning an isolated KPI into a clear, continuously updated improvement target.

.png)