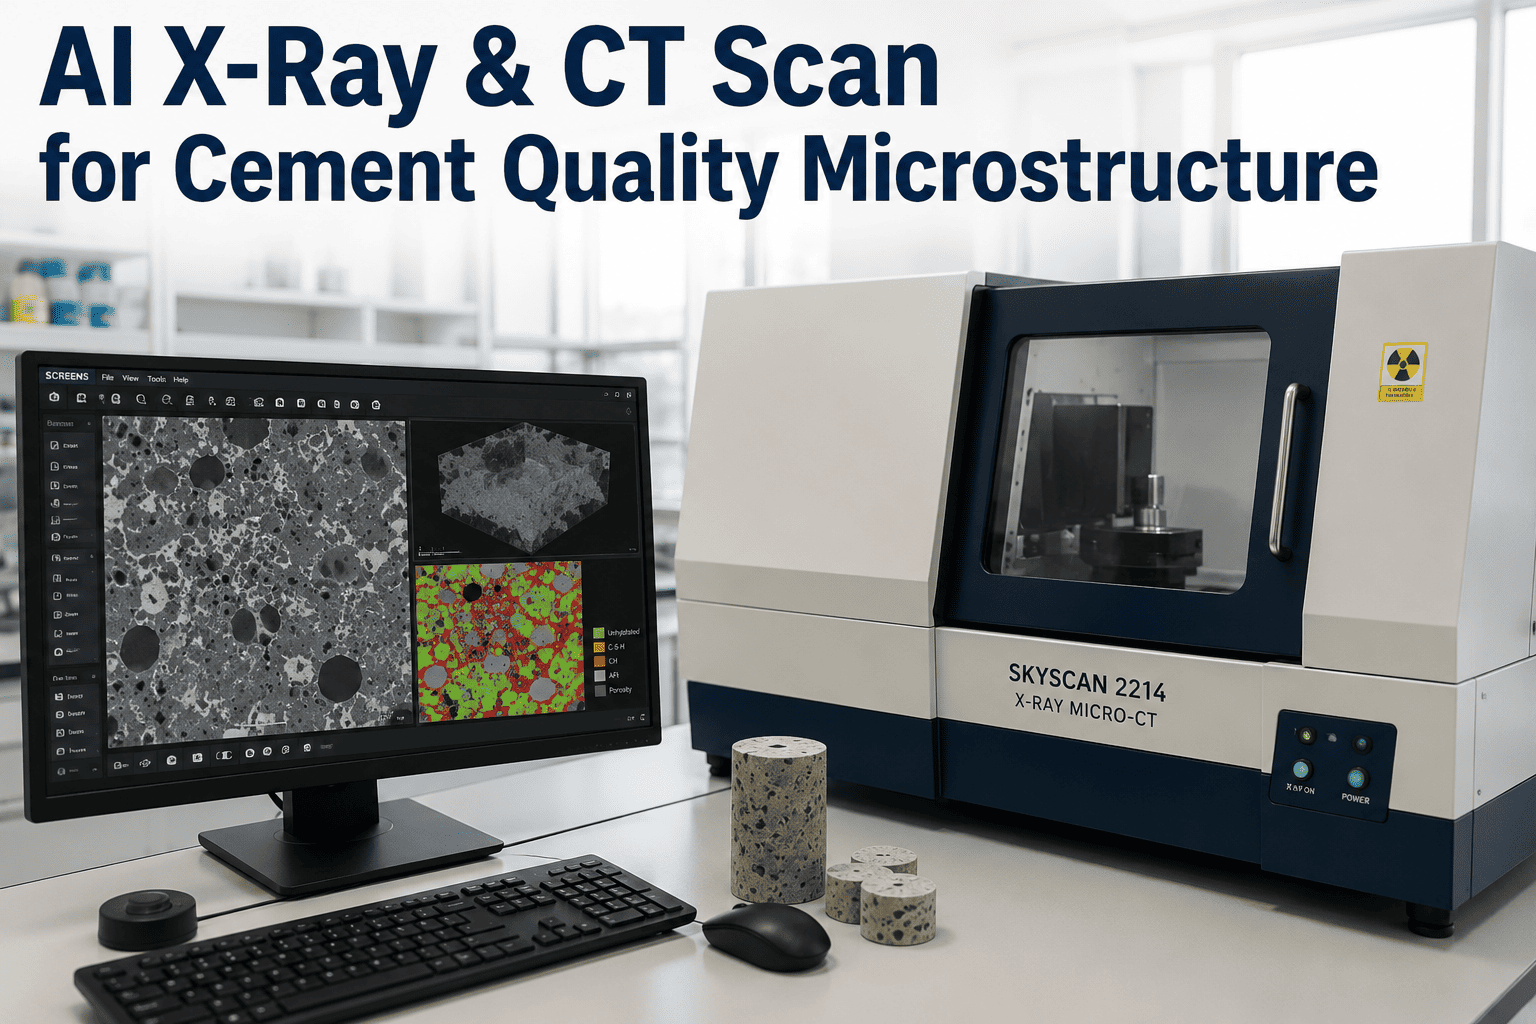
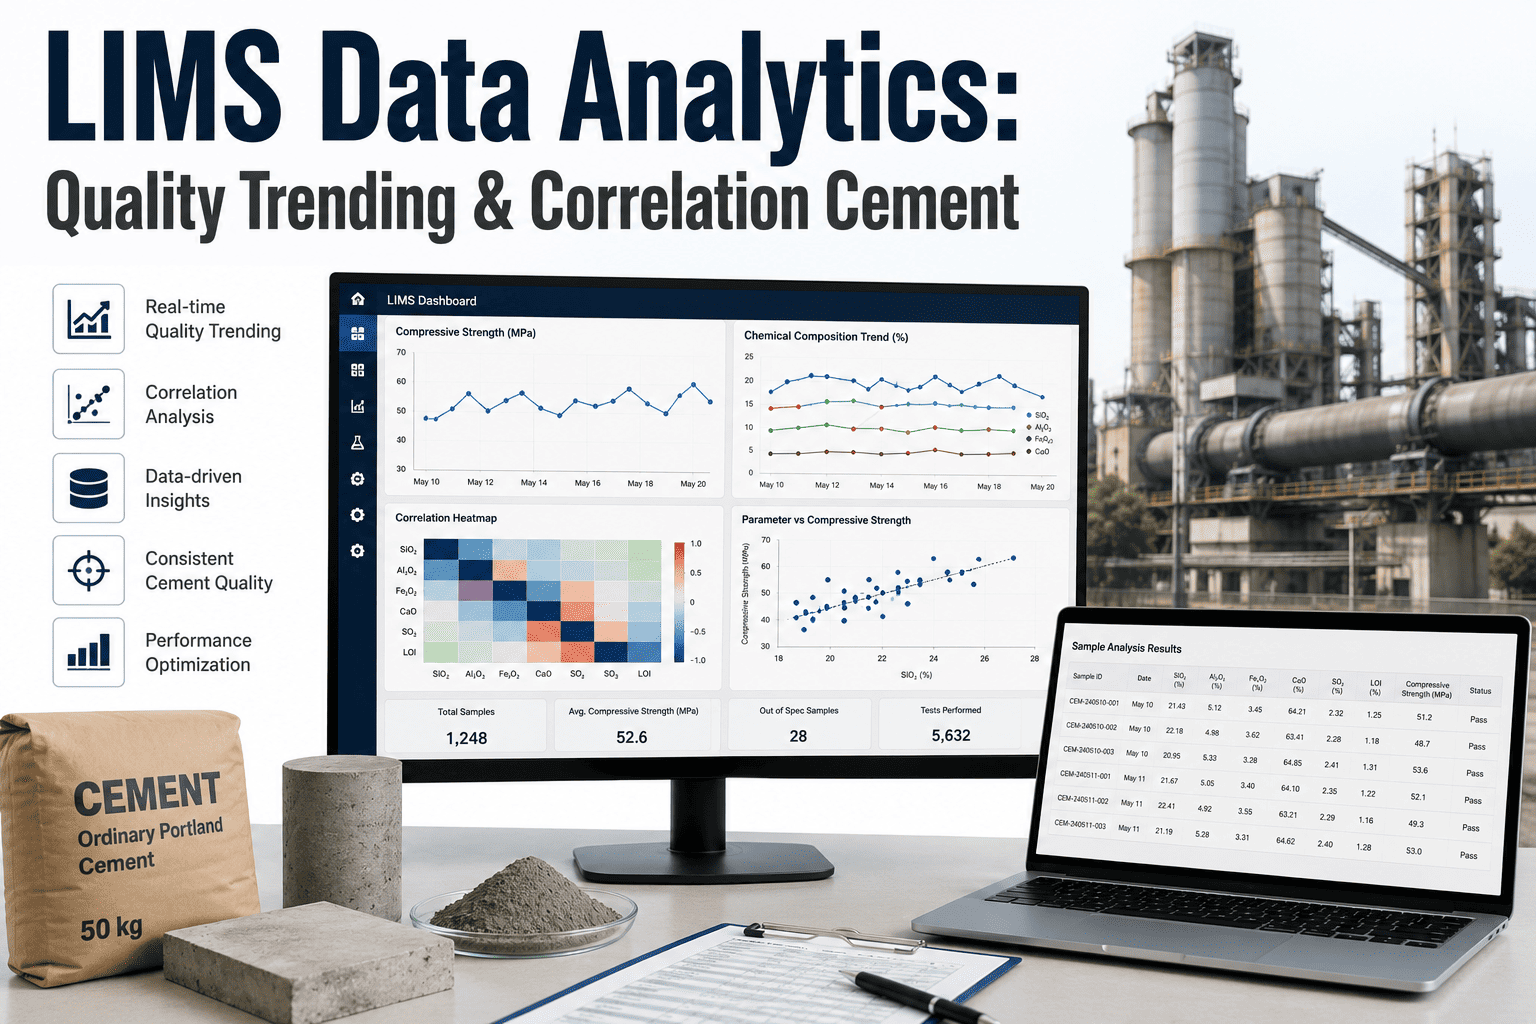
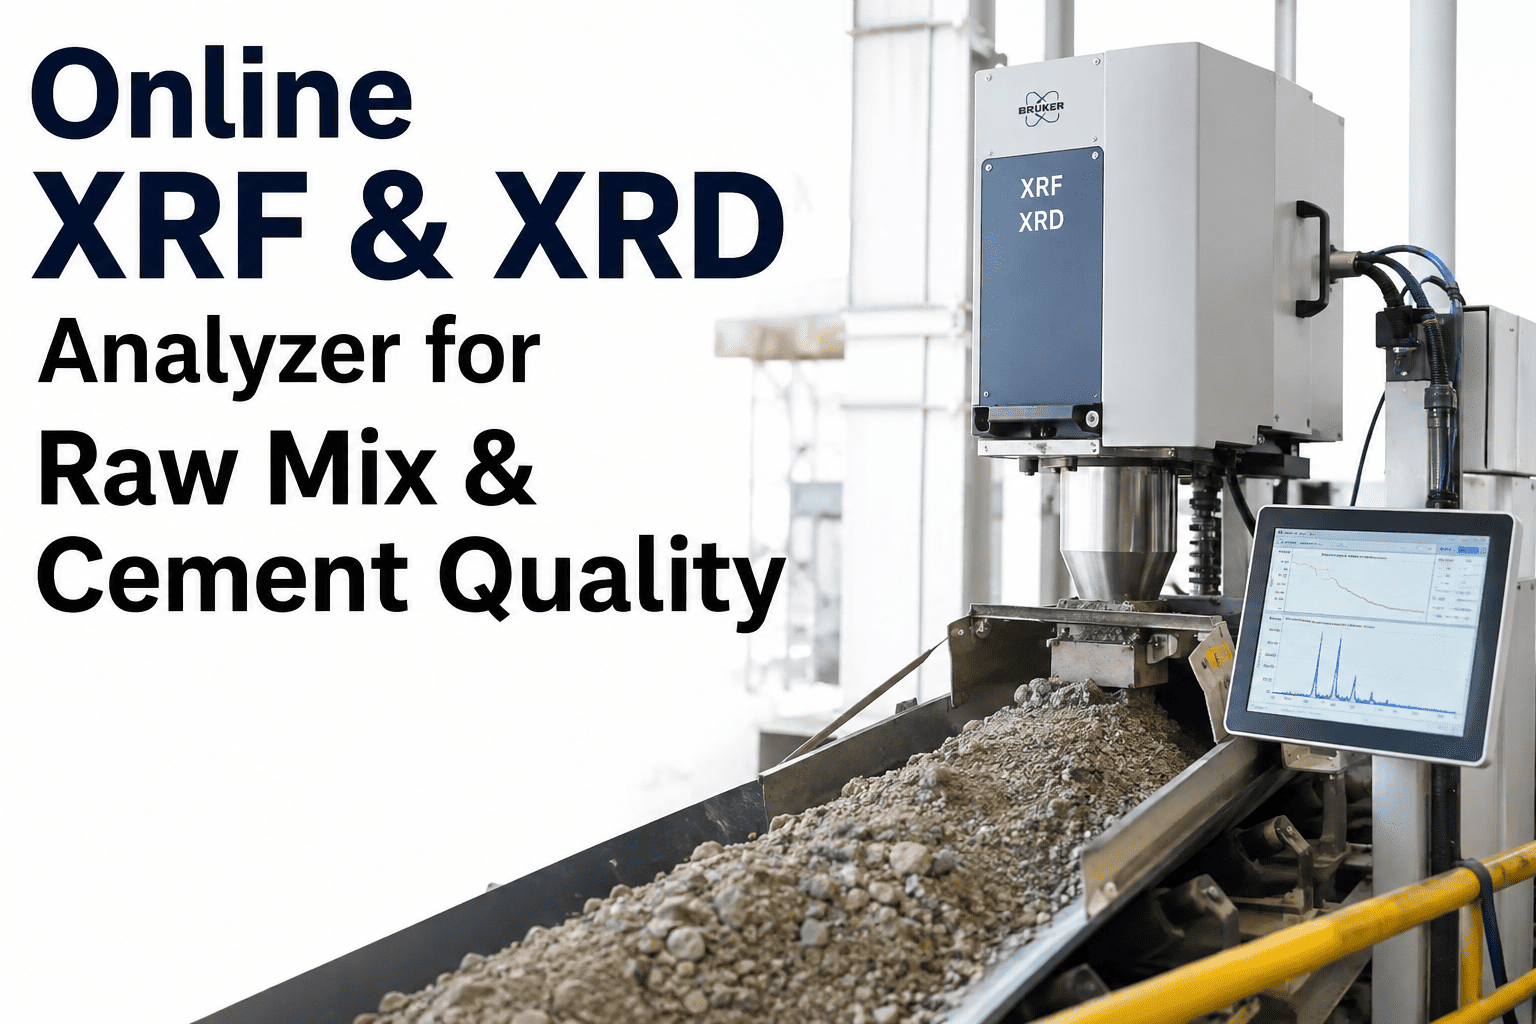
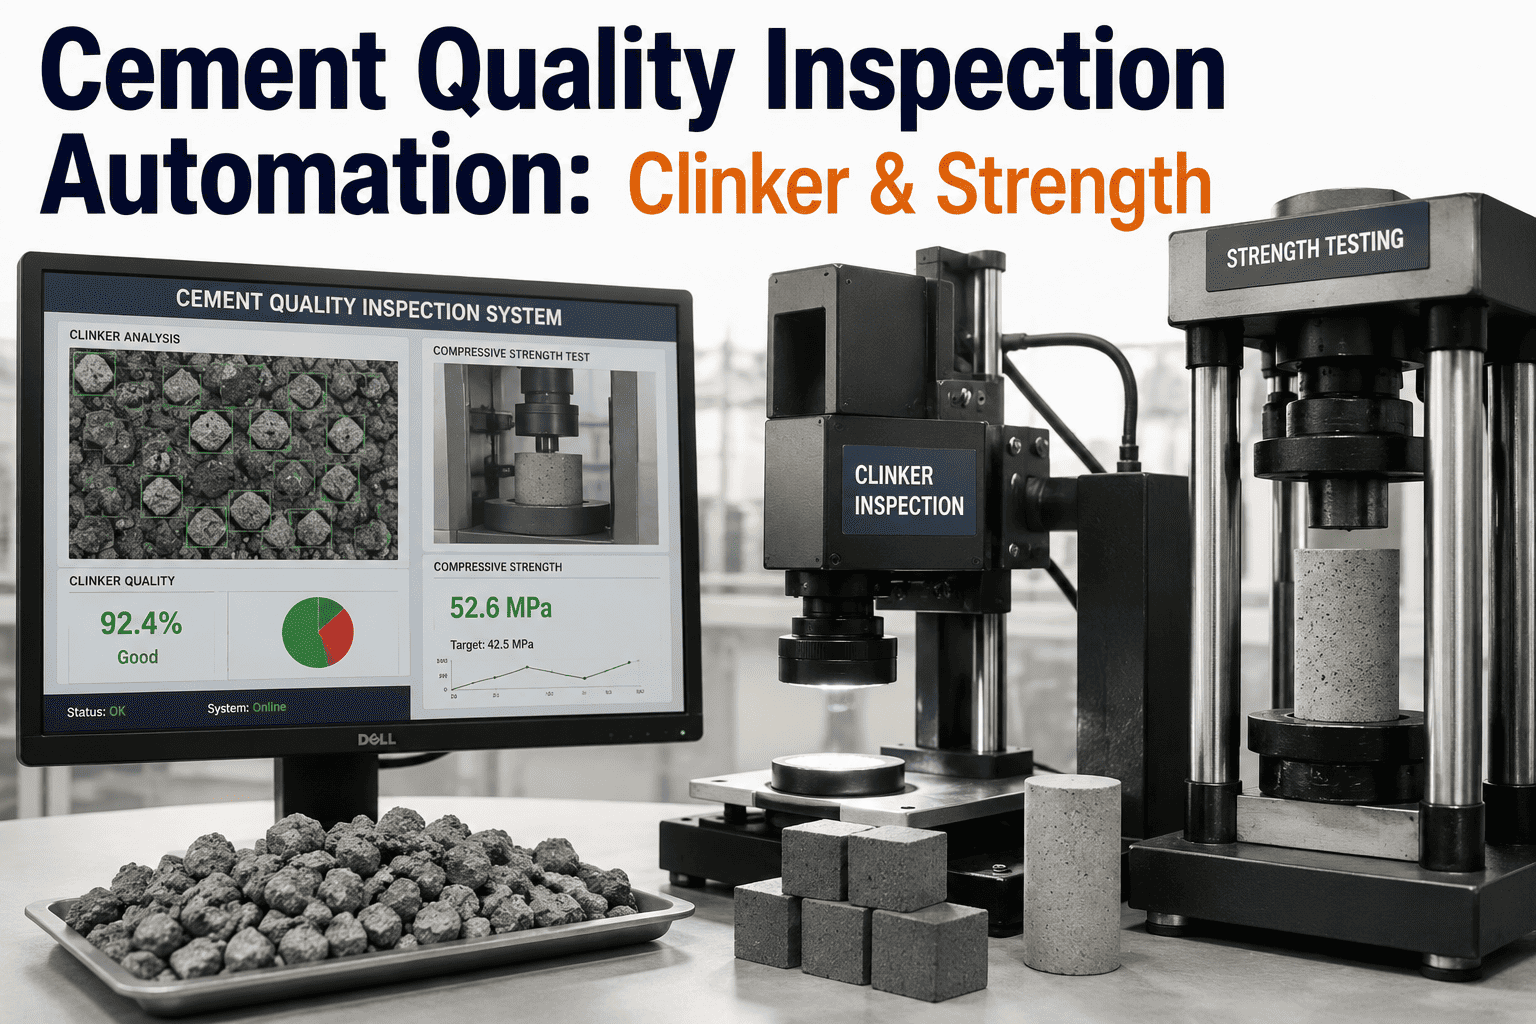
Most cement quality programs still calculate mineral phase content the indirect way: run an XRF scan for elemental composition, then apply the Bogue formula to estimate alite, belite, aluminate and ferrite content. The problem is that Bogue calculations were never designed to capture what actually happens inside a clinker grain. They cannot distinguish between the M1 and M3 polymorphs of C3S, or the alpha, beta and gamma forms of C2S, even though these polymorphs affect reactivity and strength development differently. Direct X-ray diffraction measures the true crystalline phase composition instead of estimating it, and X-ray CT goes a step further, revealing the three-dimensional pore network and hydration behavior that neither XRF nor XRD can see at all. Feeding both data streams into an AI-enhanced quality control pipeline turns two specialized lab techniques into one continuous read on clinker mineralogy and paste microstructure. Book a demo to see how iFactory applies AI to XRD and CT scan data for advanced cement quality characterization.
See the Phases Bogue Calculations Have Always Guessed At
XRF and the Bogue formula estimate mineral phase content from elemental data, but the estimate diverges from the real crystalline composition inside the clinker — sometimes significantly. Direct XRD phase quantification and X-ray CT pore-structure imaging give quality teams a measured, not modeled, view of the mineralogy and microstructure that actually determines strength, setting time and durability.
<7minFull clinker phase analysis by automated XRD
60secFree lime result turnaround on modern XRD systems
sub-µmResolution achievable with micro and nano-CT imaging
Why XRF-Based Bogue Estimates Leave Quality Teams Guessing
XRF quality control has been the industry default for decades because it is fast and well understood, but speed comes at the cost of precision on the phases that matter most for performance. Talk to support about where Bogue estimates have diverged from your actual clinker behavior.
Bogue Calculations Are Modeled, Not Measured
The Bogue formula derives phase content from bulk elemental concentrations using assumed stoichiometry, not from direct observation of the crystalline phases themselves — so the result is only ever as accurate as the assumptions behind it.
Polymorphs Are Invisible to Elemental Analysis
C3S can exist as the M1 or M3 polymorph and C2S as alpha, beta or gamma, each interacting differently with hydration and strength development. XRF cannot distinguish between them because it only measures elemental concentration.
Free Lime and Amorphous Content Go Unquantified
Free lime content correlates directly with expansion behavior, and amorphous phase content affects reactivity, yet neither is captured reliably by a Bogue calculation built around crystalline assumptions.
Pore Structure and Hydration Behavior Are Never Measured
Even a perfect phase analysis says nothing about how the paste actually hydrates, where microcracks initiate, or how porosity develops over time — information that only volumetric imaging like X-ray CT can provide.
Manual CT Segmentation Is Slow and Operator-Dependent
Where CT scanning is used, manual thresholding to separate pore, paste and aggregate phases is time-consuming and sensitive to noise, beam hardening and reconstruction artifacts, often requiring manual correction scan by scan.
What AI-Enhanced XRD and CT Analysis Adds to the Picture
iFactory applies machine learning on top of your existing XRD and CT instrumentation, automating the analysis steps that currently require manual interpretation and correlating both data streams against process and performance data. The result is a single pipeline that turns raw diffraction patterns and CT scan volumes into decision-ready mineralogy and microstructure metrics, rather than two separate techniques each requiring specialist interpretation.
01
Automated Rietveld Phase Quantification
AI-assisted Rietveld refinement quantifies alite, belite, aluminate, ferrite, free lime and amorphous content directly from XRD patterns, including distinguishing polymorphic forms that a Bogue calculation cannot separate.
02
Automated Pore and Phase Segmentation in CT Scans
Deep learning segmentation classifies pore, paste, aggregate and microcrack regions in CT volumes automatically, removing the manual thresholding step and its sensitivity to scan noise and reconstruction artifacts.
03
Porosity and Pore Size Distribution Mapping
Segmented volumes are converted into quantified porosity, pore size distribution and connectivity metrics, giving R&D teams a direct link between mix design changes and the resulting pore network.
04
Hydration Behavior Tracking Over Time
Time-lapse CT imaging combined with AI analysis tracks how hydrate phases and porosity evolve across curing periods, revealing hydration kinetics rather than a single snapshot.
05
Phase-to-Performance Correlation
Free lime, calcite content and polymorph ratios are correlated against measured expansion, loss on ignition and strength results, building a plant-specific model of which phases actually drive performance.
Bogue/XRF Estimation Compared to AI-Enhanced XRD and CT Analysis
| Capability |
Traditional XRF and Bogue Calculation |
AI-Enhanced XRD and CT Analysis |
| Phase Data Source |
Modeled from bulk elemental concentration using assumed stoichiometry. |
Measured directly from crystalline diffraction patterns via automated Rietveld refinement. |
| Polymorph Detection |
Cannot distinguish C3S or C2S polymorphic forms. |
Resolves M1/M3 and alpha/beta/gamma polymorphs and their differing reactivity. |
| Free Lime and Amorphous Content |
Estimated indirectly with limited reliability. |
Quantified directly, often in under 60 seconds per sample. |
| Pore Structure Visibility |
Not captured by elemental or phase analysis at all. |
Mapped in 3D via CT with porosity, pore size and connectivity metrics. |
| Hydration Insight |
Limited to indirect inference from strength testing over time. |
Directly observed through time-lapse CT imaging of hydrate phase evolution. |
| Analysis Consistency |
Manual CT thresholding, where used, is operator-dependent and artifact-sensitive. |
Automated segmentation applies consistent criteria across every scan. |
Stop Estimating Phase Composition. Start Measuring It.
iFactory layers AI on your existing XRD and CT instrumentation, automating phase quantification and pore-structure segmentation so your quality and R&D teams work from measured mineralogy instead of a Bogue-calculated approximation.
How Advanced Characterization Gets Integrated Into Your Lab
Deployment works with the XRD and CT instrumentation your lab already operates, layering AI analysis on top rather than replacing existing hardware.
1
Instrument Data Integration
Raw XRD pattern data and CT scan volumes are connected from your existing diffractometer and CT scanner into the analysis pipeline, with no changes to your current scanning procedure.
2
Reference Library Calibration
Rietveld refinement and CT segmentation models are calibrated against your specific clinker chemistry, mix designs and known reference samples to establish plant-specific accuracy.
3
Parallel Validation Against Manual Results
Automated phase quantification and pore segmentation run alongside your current manual analysis on the same samples, confirming agreement before manual review is scaled back.
4
Full Deployment With Performance Correlation
Automated analysis goes live across routine samples, with phase and pore-structure data continuously correlated against strength, expansion and durability test results.
Where Advanced Characterization Has Changed Quality Decisions
A plant experiencing intermittent expansion complaints had normal Bogue-calculated phase composition on every batch, leaving the quality team without a clear cause. Direct XRD analysis revealed free lime levels the Bogue estimate had consistently understated, tracing the issue to kiln burning zone temperature variability rather than raw mix design. Correcting kiln operation based on directly measured free lime data reduced expansion complaints by 68% over the following quarter.
68%Fewer expansion-related quality complaints
60secFree lime turnaround enabling same-shift correction
An R&D team testing new admixture formulations needed a faster way to evaluate pore structure impact than physical durability testing allowed. Automated CT segmentation quantified porosity and pore size distribution across dozens of trial mixes in the time previously needed for a handful of manual analyses, confirming that a specific superplasticizer dosage reduced average pore size and produced a more homogeneous pore distribution. Trial-to-decision time for new mix formulations dropped 55%.
55%Faster trial-to-decision time on new mix formulations
DozensOf trial mixes analyzed in the time of a handful manually
What Quality and R&D Teams Say
Our Bogue numbers always looked fine. Direct XRD showed us the free lime story the calculation had been hiding, and that changed how we run the kiln.
Quality Control Manager, Integrated Cement Plant
Manual CT segmentation used to be the bottleneck in every mix trial. Automating it let us test more formulations in a month than we used to manage in a quarter.
R&D Lead, Cement and Concrete Additives
We finally have a direct measurement instead of a modeled estimate for phases that matter most to reactivity. That's a different conversation with our process engineers.
Laboratory Director, Cement Manufacturing Group
Frequently Asked Questions
Does this replace our existing XRF-based Bogue calculation entirely?
Do we need new XRD or CT hardware, or can this work with our existing instruments?
In most cases the AI analysis layer connects to the diffractometer and CT scanner your lab already operates. The platform ingests raw diffraction patterns and CT volumes from your existing equipment rather than requiring new scanning hardware, though scan resolution and instrument calibration do affect the achievable analysis quality. Labs running older or lower-resolution systems may see a smaller accuracy gain until instrument upgrades are considered separately.
How does automated CT segmentation compare in accuracy to manual thresholding?
Manual thresholding is sensitive to scan noise, beam hardening and reconstruction artifacts, and results vary depending on who performs the segmentation. Automated deep learning segmentation applies the same criteria consistently across every scan, and is validated against your own manually segmented reference scans during calibration before being scaled up to routine use.
Can this help us understand hydration behavior over time, not just a single snapshot?
What does integration into our lab typically involve and how long does it take?
Integration starts with connecting your existing XRD and CT instrument data into the analysis pipeline, followed by calibration against your specific clinker chemistry and reference samples, then a parallel validation period comparing automated results to your current manual analysis before full deployment. Most labs complete this process within a few weeks depending on the number of reference samples available for calibration.
Measure Your Clinker Mineralogy. Stop Estimating It.
iFactory applies AI to your existing XRD and CT instrumentation, automating phase quantification, pore-structure segmentation and hydration tracking so quality and R&D decisions are based on direct measurement instead of a modeled approximation.
Automated Rietveld phase quantification including polymorph detection
Deep learning pore and phase segmentation for CT scan volumes
Time-lapse hydration tracking beyond a single snapshot
Works with your existing XRD and CT instrumentation