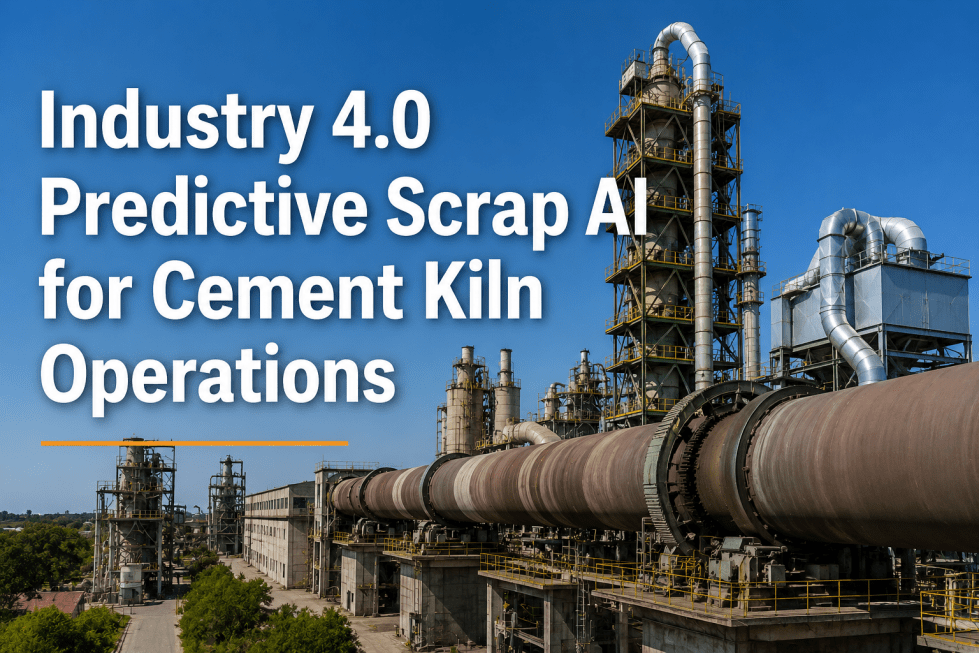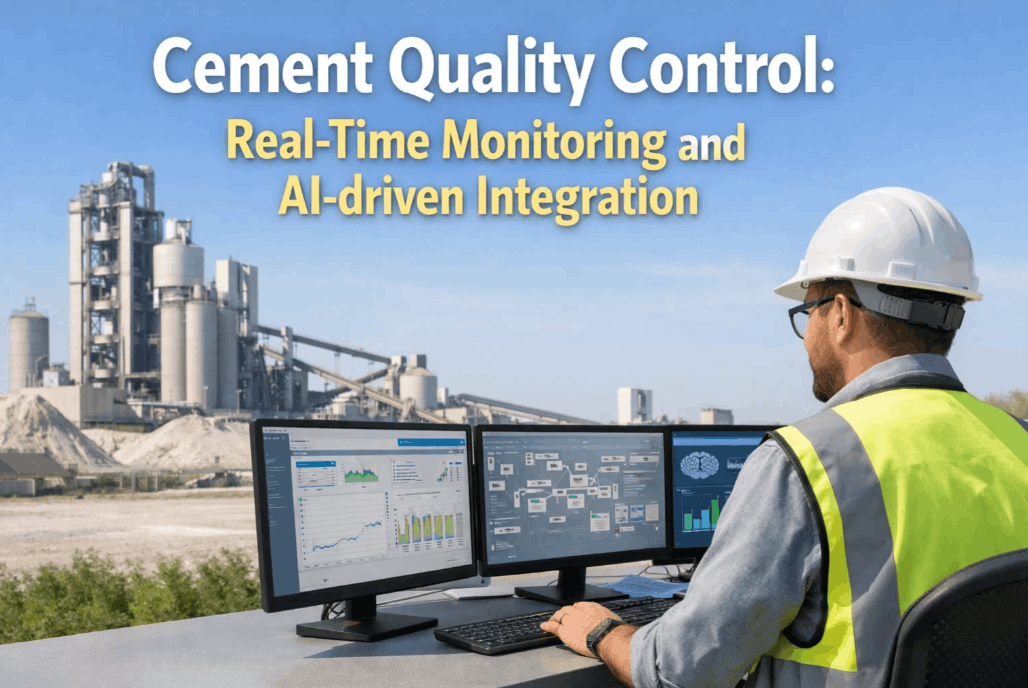
Statistical process control in cement kiln operations has historically meant manual charting of free lime, liter weight, SO3, and Blaine fineness at shift intervals, with control limits set annually and out-of-control signals discovered when the lab result arrives hours after the sample was taken. For a plant executive managing a 5,000+ tpd clinker line, the gap between what SPC promises and what it delivers is measured in off-spec clinker, reduced refractory life and avoidable kiln stoppages that erode both margin and credibility. The root cause is not the methodology — Shewhart control charts and Western Electric rules remain as valid as ever — but the impossibility of applying them manually at the volume and velocity of modern kiln operations. A single preheater tower generates 200+ process variables, a kiln produces clinker at 1.5 tons per minute across multiple raw mix designs, and process capability calculated quarterly from 25 samples misses every shift-level drift that occurs between sampling intervals. Autonomous SPC changes this by automating control chart generation, applying all eight Western Electric rules in real time, and continuously calculating Cp, Cpk, Pp, and Ppk from every ton of clinker produced — transforming SPC from a retrospective quality reporting function into a real-time process control system that plant executives and QA managers can trust for operational decisions, compliance audits, and continuous improvement initiatives. Plant executives evaluating autonomous SPC for their kiln lines can book a demo to review how the platform maps to their specific kiln configuration, raw material profile, and quality targets.
The Autonomous SPC Imperative for Cement Kiln Operations
Kiln operations present a uniquely challenging environment for statistical process control. The process is continuous, raw material chemistry varies with every quarry face and additive batch, fuel mix changes affect burning zone temperature profiles, and the time lag between a process disturbance and its appearance in clinker quality parameters can span 30 to 90 minutes through the preheater and kiln system. Manual SPC — with its shift-interval sampling, end-of-day chart review, and quarterly capability studies — cannot keep pace with the dynamics of a modern kiln line. The following table compares the traditional approach with the autonomous SPC model that plant executives are adopting to close the quality control gap.
- Control charts generated at shift intervals from lab sample results — out-of-control signals detected 4–8 hours after the assignable cause occurred, when affected clinker is already in the silo
- Western Electric rules applied visually by a QA engineer reviewing printed charts — typically only 2–3 of the 8 zone tests are checked due to time constraints, missing trends and patterns in the remaining parameters
- Cp and Cpk calculated quarterly from 25–50 physical samples — capability metrics that are 90 days stale by the time they reach the plant manager's monthly review
- Control limits reviewed annually and adjusted per raw mix design — limits remain static while raw material chemistry, fuel blend, and ambient conditions drift continuously
- Sample-based coverage of 1–3% of production — the 97–99% of unmeasured clinker carries process variation that is invisible until it produces off-spec product or a customer complaint
- Control charts updated in real time from inline analyzers, XRF, and process sensors — every ton of clinker updates X-bar, R, S, and individual moving range charts automatically with Shewhart limits computed from the current production window
- All eight Western Electric zone tests evaluated by AI inference engine on every new data point — rule violations flagged within 500 milliseconds with the specific rule number, zone location, and parameter identification
- Cp, Cpk, Cpm, Pp, and Ppk calculated continuously — capability metrics updated with every clinker sample and trended over user-selectable windows (shift, day, week, campaign) for live process visibility
- Control limits recalculated dynamically using a hybrid model — fixed specification-based limits combined with statistically computed limits from the most recent production data, adapting to raw material and process changes
- 100% of production data analyzed — every inline measurement, every lab sample, every process variable contributes to control charts and capability calculations for complete process visibility
How Autonomous SPC Delivers Defect Elimination Across the Kiln Process
Defect elimination in cement kiln operations requires moving from reactive quality control — catching off-spec clinker after it is produced — to predictive process control that prevents defect conditions from developing. Autonomous SPC achieves this through five interconnected capabilities that replace manual chart review and periodic analysis with continuous, real-time process surveillance and automated response.
Predictive Analytics and Machine Vision in the Autonomous SPC Framework
Autonomous SPC goes beyond traditional control chart automation by incorporating predictive analytics and machine vision into the quality control framework. Predictive models trained on historical kiln data identify process conditions that precede defect events — such as the specific combination of preheater exit temperature, tertiary air flow, and raw meal fineness that has historically produced free lime excursions — and alert operators and QA engineers before the defect develops. Machine vision systems monitoring kiln flame shape, clinker bed texture, and discharge grate condition provide additional quality signals that are integrated into the autonomous SPC control charts and capability calculations. The table below summarizes the predictive and vision capabilities that differentiate autonomous SPC from traditional automated SPC approaches.
| Capability | Traditional Automated SPC | Autonomous SPC with Predictive Analytics | Value to Plant Executive |
|---|---|---|---|
| Out-of-Control Detection | Evaluates Western Electric rules on lab sample data after the sample is analyzed — reaction time measured in hours | Evaluates rules on both process sensor data and lab sample data in real time; predictive models flag pre-defect conditions before the control chart rule is violated | Reduces defect-related clinker from hours of production to minutes — a pre-defect alert on free lime trend can save 50–100 tons of off-spec clinker per event |
| Process Capability Trending | Cp/Cpk calculated periodically from sample data — typical update frequency is quarterly or per campaign change | Continuous capability calculation from 100% of process and lab data; trending over multiple windows (shift, day, week, campaign, trailing 30 days) | Live capability visibility enables real-time process targeting decisions — a Cpk trend moving from 1.67 toward 1.33 is visible within hours rather than months |
| Root Cause Identification | Manual investigation triggered by out-of-control signals — QA engineer reviews control charts and process logs to identify assignable cause | AI correlation analysis identifies which process variables changed before the defect — root cause suggested automatically based on historical pattern matching | Reduces investigation time from hours to minutes and captures root cause knowledge that walks out the door with retiring engineers |
| Machine Vision Integration | Not available — clinker quality assessed through lab sampling and visual inspection by kiln operators | Vision models analyze flame shape, burning zone temperature distribution, clinker bed texture, and discharge grate condition — integrated as control chart parameters | Provides continuous quality signals between lab sampling intervals — flame instability visible on control charts within seconds rather than hours |
| Defect Prediction | No predictive capability — defects are detected after they occur through lab analysis or customer complaints | Predictive models generate defect probability scores for each quality parameter based on current process conditions and historical patterns | Enables proactive process adjustment — reducing defect rates by 30–70% depending on the parameter and process stability baseline |
Measured Impact: Autonomous SPC in Cement Kiln Operations
The metrics below represent average results from iFactory autonomous SPC engine deployments across cement kiln operations over a 12-month validation period. Individual results vary based on kiln configuration, raw material variability, existing SPC maturity, and deployment scope.
Industry Expert Perspective: Autonomous SPC in Cement Manufacturing
I spent nine years as a quality manager at a cement plant producing 1.8 million tons annually, and the most frustrating part of my job was the gap between what SPC could deliver and what we were able to achieve with manual methods. We had a state-of-the-art lab with XRF, XRD, and automated sample preparation, but our SPC process was still built around printed control charts that the shift chemist marked by hand and reviewed at the end of each shift. I would come in every morning and find a stack of charts with notes like "free lime trending high on line 2" — but the note was written eight hours after the trend started, and by that time the kiln had already produced 200 tons of clinker with elevated free lime. The autonomous SPC platform changed that completely. Now every sample updates every control chart automatically, all eight Western Electric rules are evaluated in real time, and I get an alert on my phone when a pre-defect condition is detected — not the next morning, but while the kiln is still running and the operator can make an adjustment. In the first month of deployment, the platform detected a Zone C violation on liter weight — six consecutive points trending downward — that was caused by a raw mill feed composition shift that had been developing over three days. The trend was visible on the manual charts in retrospect, but no one had identified it because the individual points were all within specification limits. The autonomous engine flagged it at the sixth point, the operator adjusted the raw mix proportioning, and the liter weight returned to target within two hours. We avoided a full shift of off-spec clinker that would have required selective silo management and potentially a customer quality complaint. That single event covered the platform cost for the first year.
Conclusion: Autonomous SPC as the Operational Standard for Cement Kiln Operations
Statistical process control was designed for an era when data was scarce and computing was expensive. The methodology — control limits, zone tests, and capability indices — remains as relevant today as when Shewhart published it in 1931, but the implementation must evolve to match the data environment of modern cement manufacturing. Kiln operations producing 5,000 tons of clinker per day across multiple raw mix designs generate far more process data than manual SPC methods can process, and the cost of that gap is measured in off-spec clinker, reduced process efficiency, and compliance risk that erodes operational performance and competitive position. Autonomous SPC closes this gap by bringing Shewhart's methodology into the age of AI — automating control chart generation, applying all eight Western Electric rules at sub-second latency, augmenting standard rules with AI-detected patterns and predictive alerts, and calculating capability indices continuously from 100 percent of production data. For plant executives and quality managers evaluating SPC modernization for their kiln operations, the evidence is clear: autonomous SPC delivers measurable defect reduction, process capability improvement, and audit-ready quality records that manual methods cannot match, and the deployment timeline — measured in weeks, not months — means the improvement can be realized within a single operating quarter.