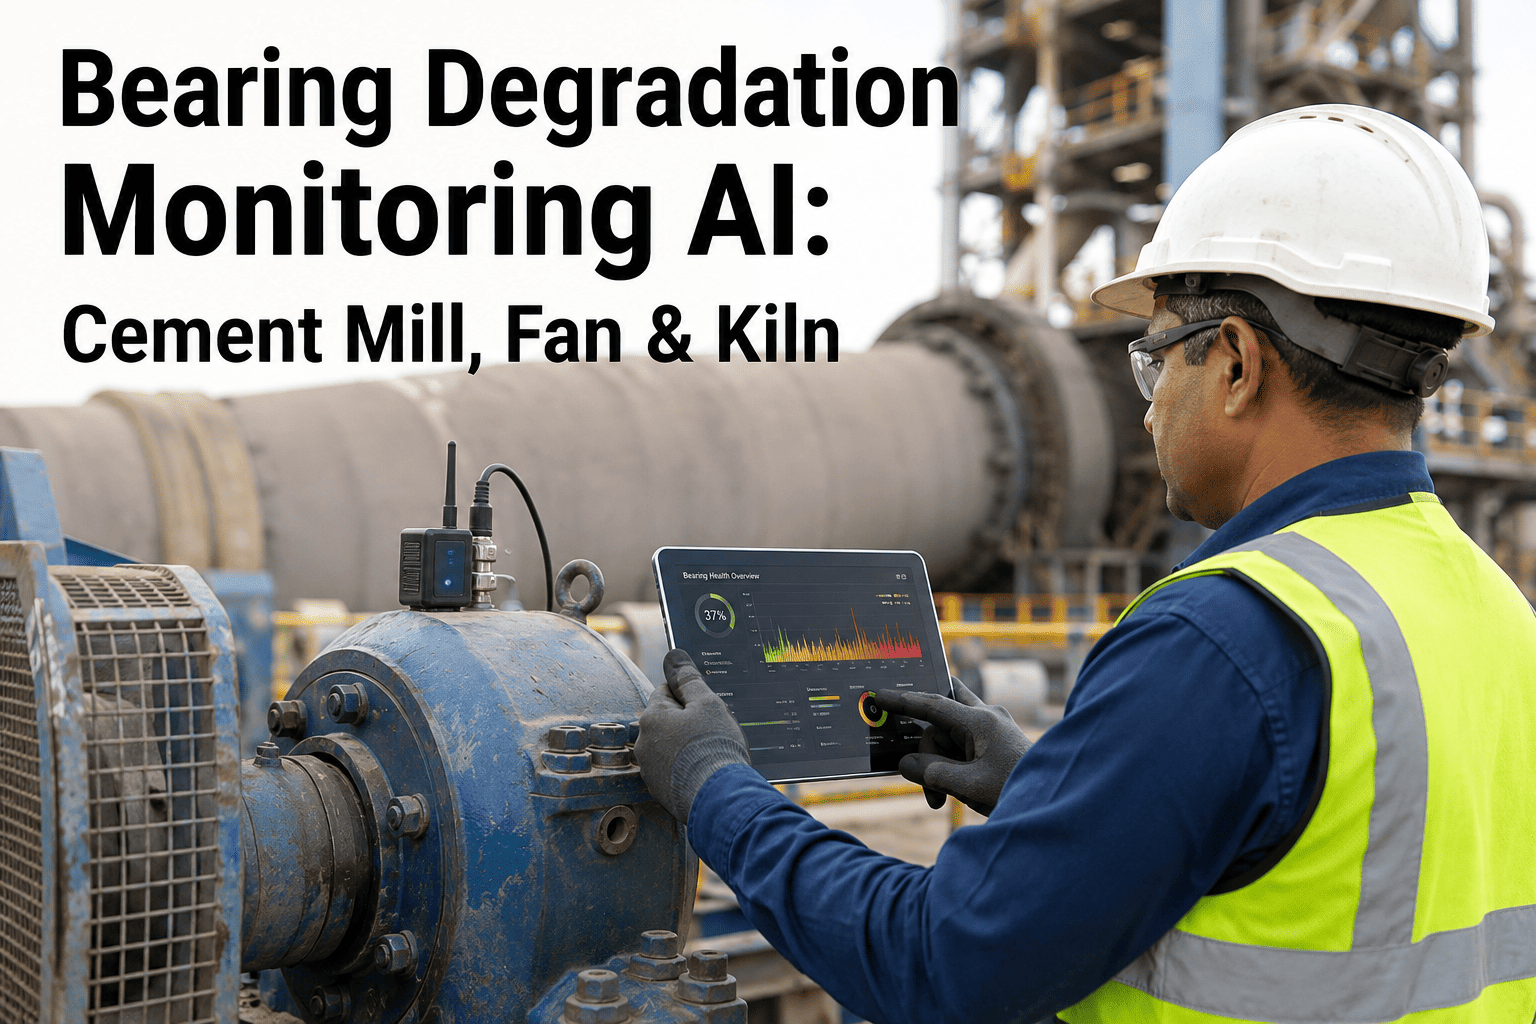
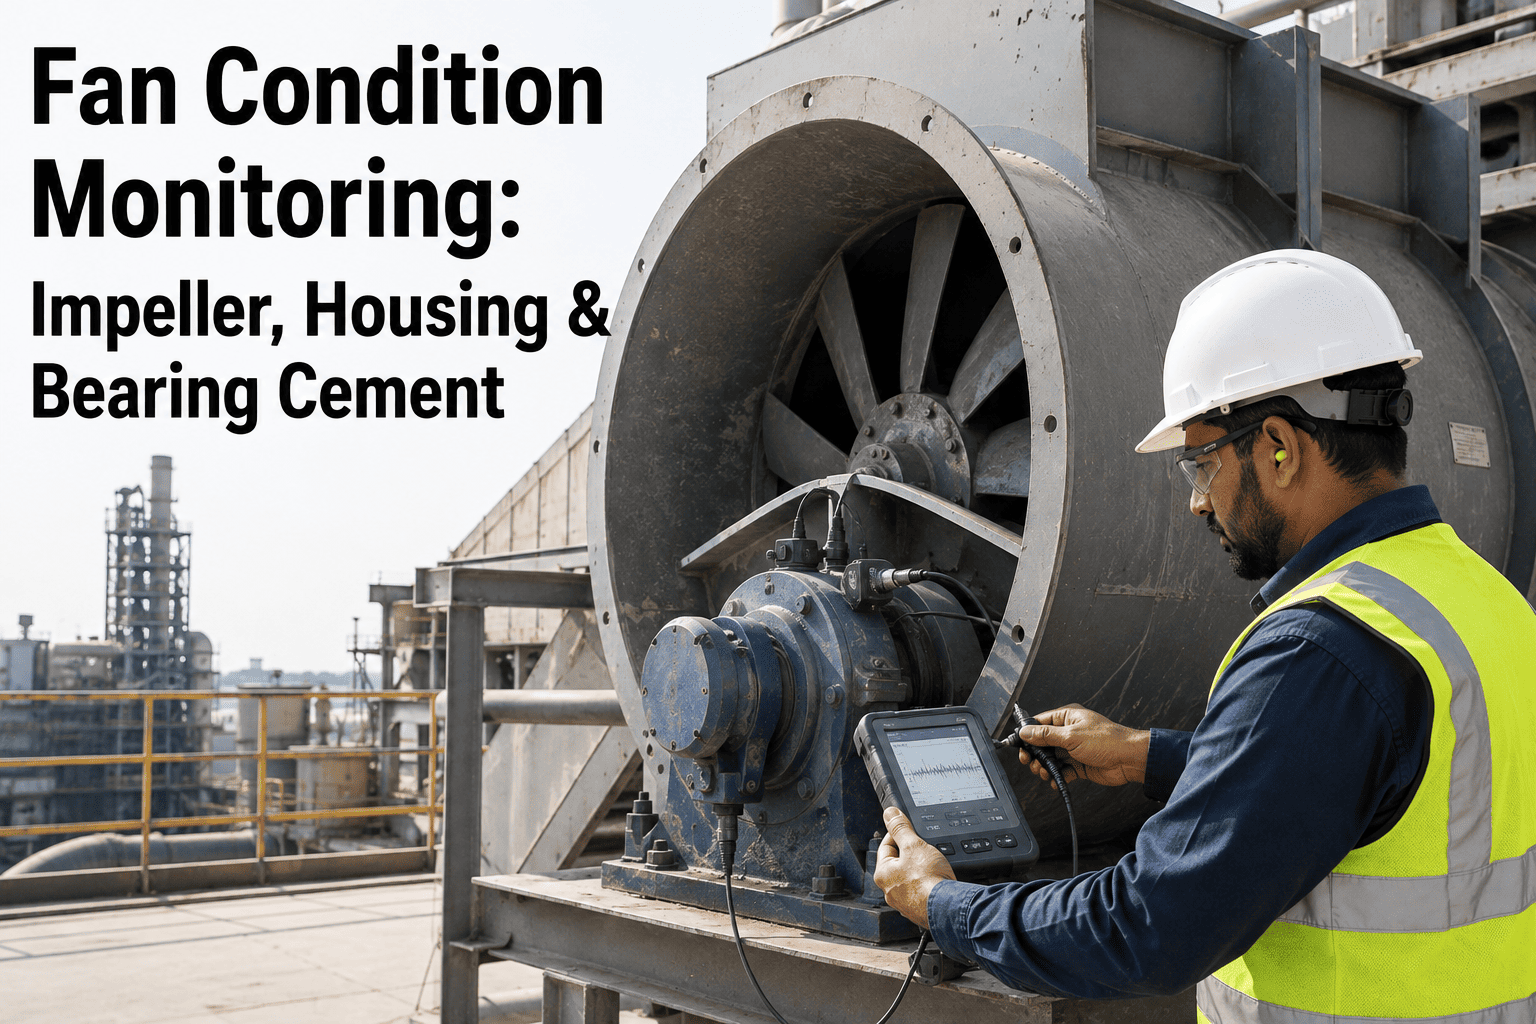
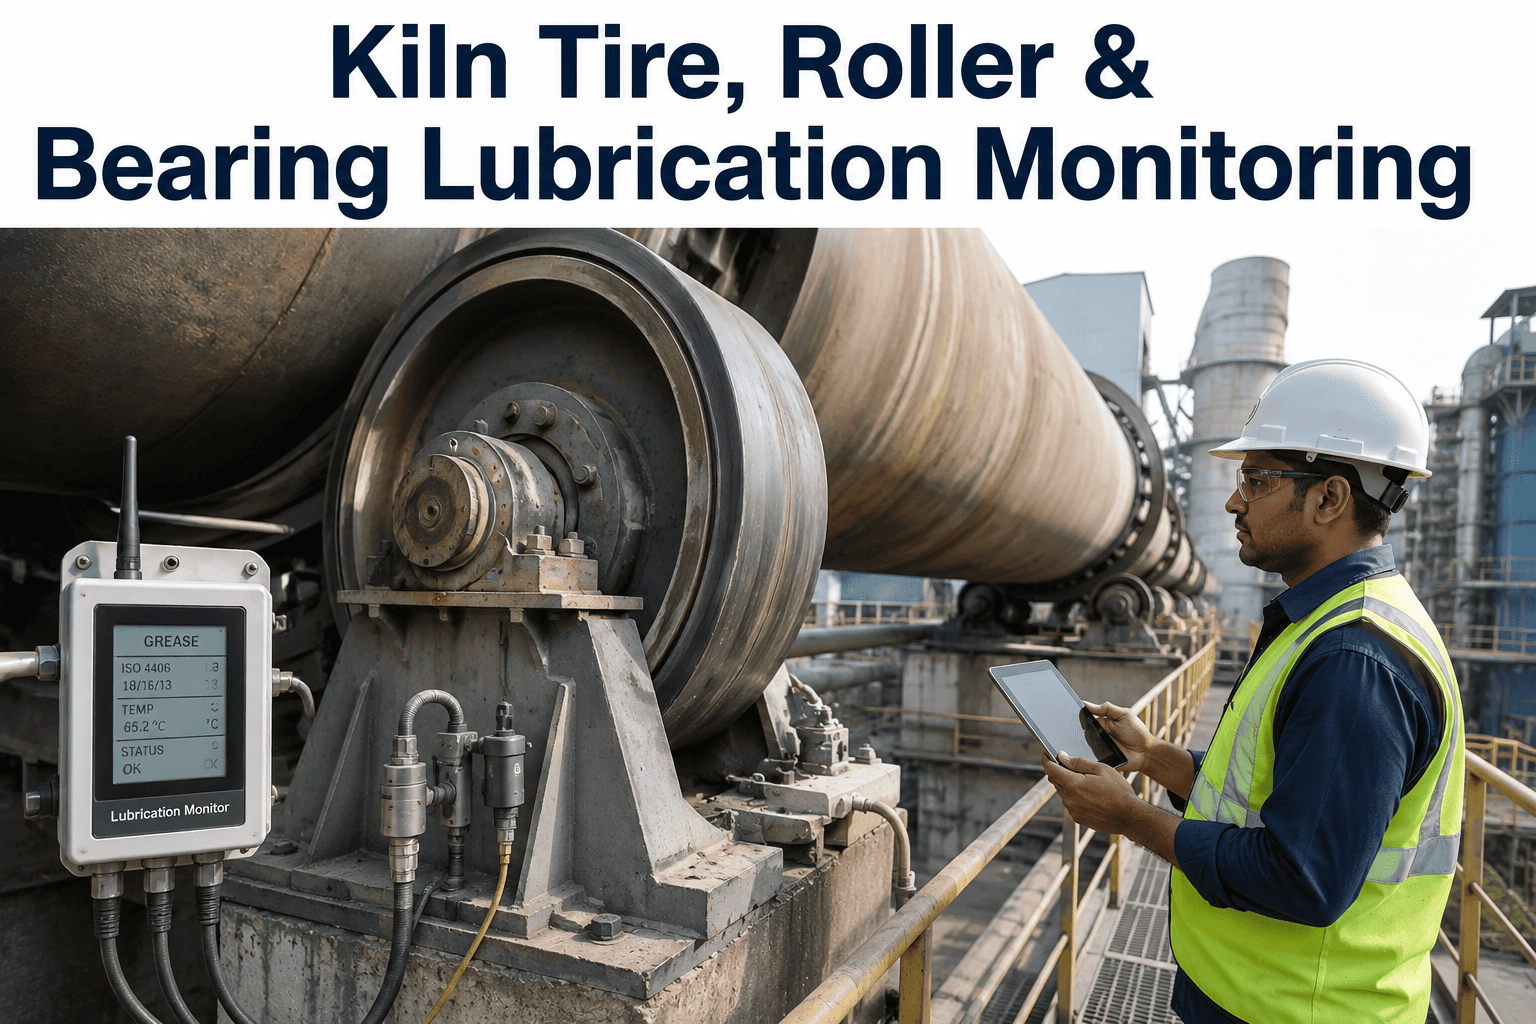
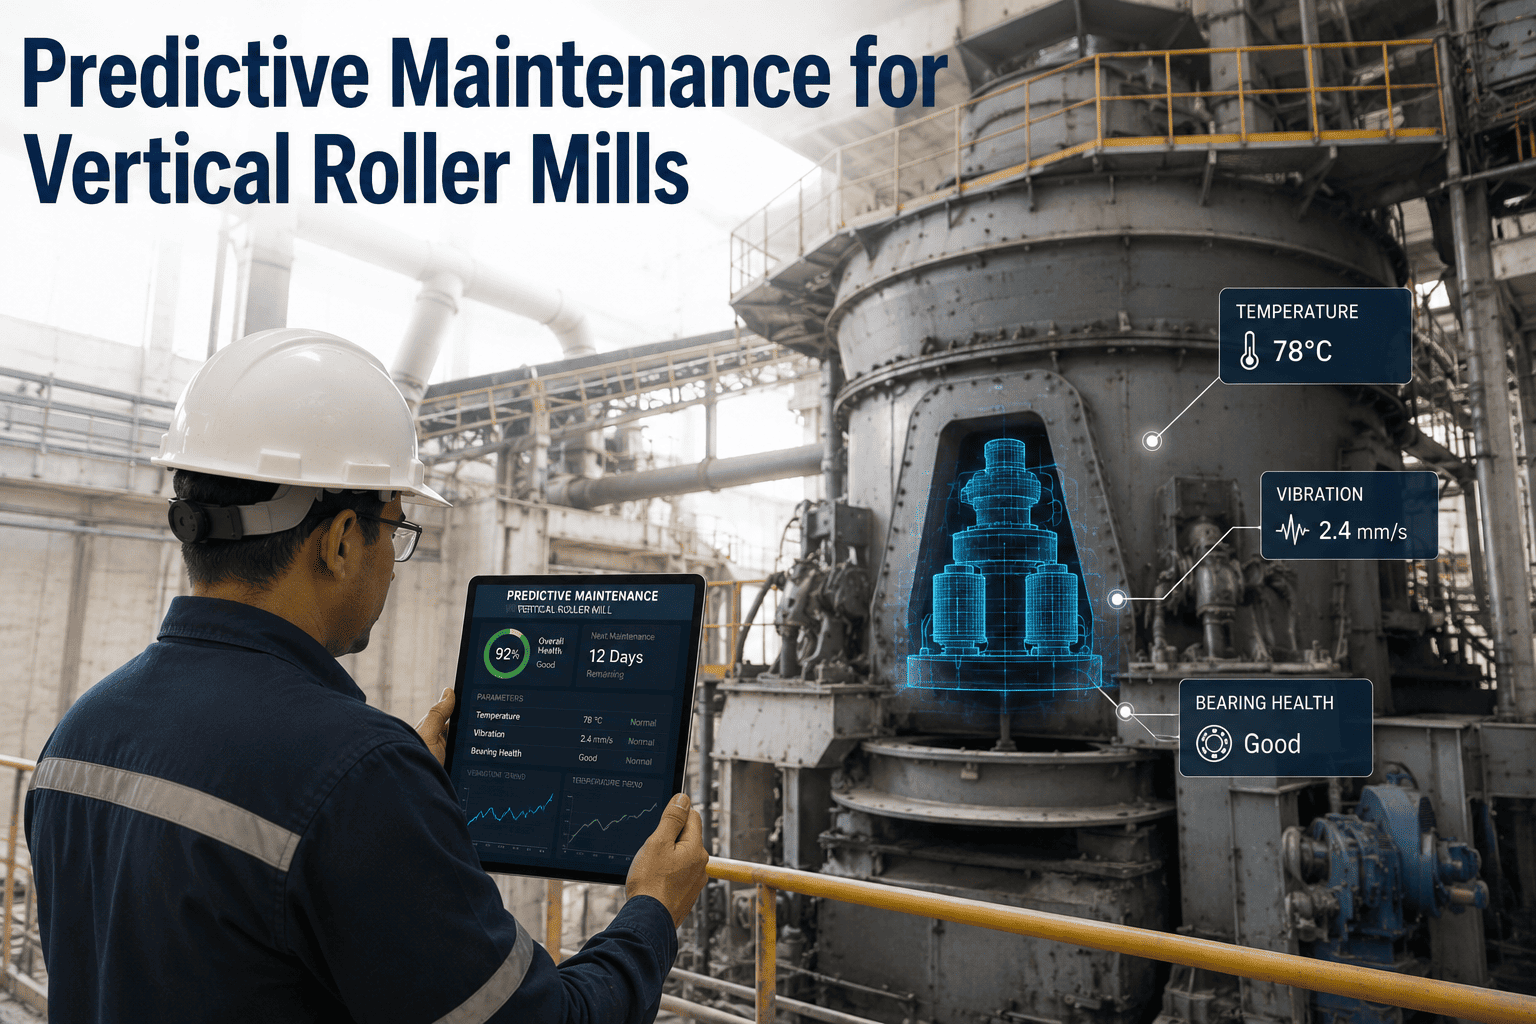
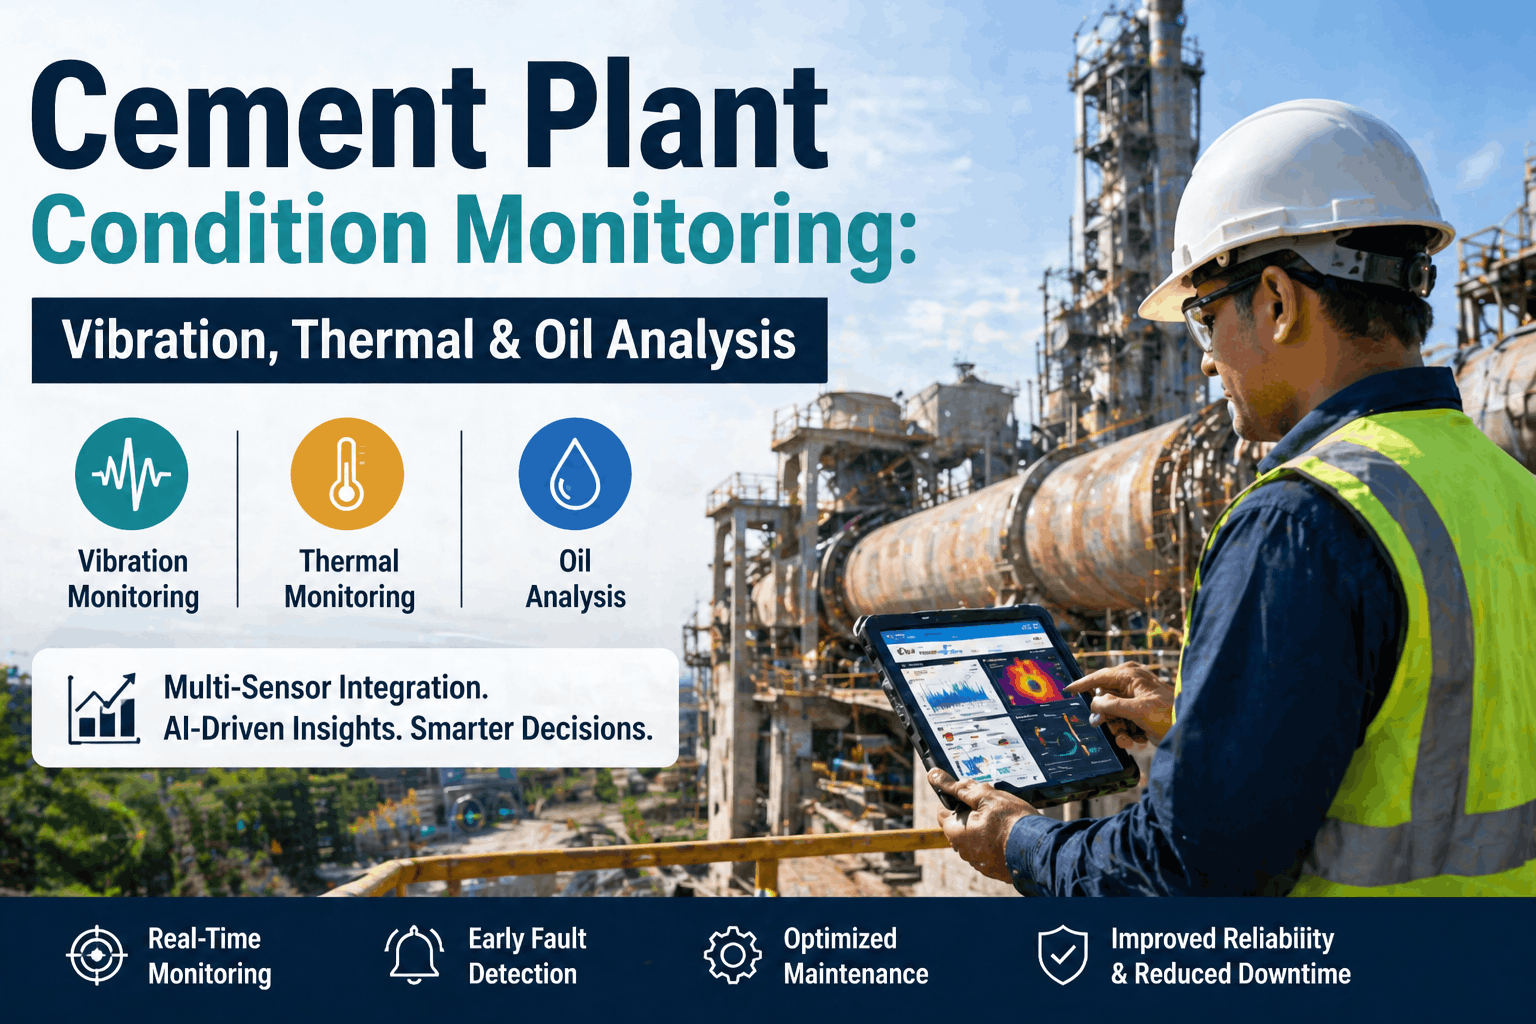
A bearing does not fail on the day it seizes. It fails in four distinct, measurable stages that begin weeks or months before anyone hears a noise or feels heat at the housing — and by the time a maintenance technician can detect degradation with their own senses, the bearing has already progressed past the stage where a scheduled, low-cost replacement was possible. Cement plant rotating equipment — mill trunnion bearings, ID fan bearings, kiln support roller bearings, cooler fan bearings — carries some of the highest failure consequence in the plant, because a single seized bearing on a kiln support roller or mill trunnion can force an unplanned shutdown measured in days, not hours. Book a session with the iFactory reliability team to see how AI-based bearing degradation monitoring catches the fault at Stage 1, not Stage 4.
Equipment Health · Bearing Degradation AI
Bearing Degradation Monitoring AI for Cement Mill, Fan, and Kiln Auxiliary Equipment
Fault staging, severity scoring, and remaining useful life prediction — built specifically for the bearings that carry the highest failure consequence in a cement plant: mill trunnions, ID fan bearings, kiln support rollers, and cooler fan bearings.
1
Early Ultrasonic Signal
2
Vibration Signature Onset
Why Bearing Failure Is the Costliest Rotating Equipment Event
The True Cost of a Seized Bearing on Mill, Fan, or Kiln Support Equipment
A bearing failure is rarely just a bearing failure. On a mill trunnion, a seized bearing can damage the trunnion journal surface itself, turning a bearing replacement into a machining and re-surfacing job measured in weeks. On an ID fan, a bearing seizure at operating speed can destroy the shaft, the impeller, and the housing in the same event, converting a planned bearing swap into a full fan rebuild. On a kiln support roller, bearing degradation that goes undetected can allow roller misalignment to progress, which in turn accelerates tire and shell wear across the entire kiln support system. The consequence multiplier is the reason bearing condition monitoring delivers disproportionate return relative to its cost — the bearing itself is inexpensive, but the collateral damage from a bearing that fails in place is not.
Mill trunnion bearing failure
7–21 day repair window
Trunnion journal damage frequently requires in-situ machining before a new bearing can be fitted
ID fan bearing seizure
Full rotor damage risk
Seizure at operating speed can destroy shaft and impeller in the same event, not just the bearing
Kiln support roller bearing
Shell and tire wear cascade
Undetected degradation allows misalignment to accelerate wear across the full support system
Cooler fan bearing
Clinker temperature impact
Reduced cooling airflow from a degrading fan bearing affects clinker quality before the fan trips
Detection lag with manual rounds
Weeks between checks
Periodic vibration rounds miss the early stage of degradation entirely between collection dates
Reactive replacement cost premium
3–6x planned cost
Emergency bearing procurement, expedited freight, and overtime labour inflate reactive repair cost
The Four-Stage Bearing Fault Progression
From First Detectable Signal to Catastrophic Failure — What AI Monitoring Catches at Each Stage
Bearing degradation follows a well-documented, physically consistent progression. Understanding the four stages is the foundation of any bearing monitoring programme, because the value of AI-based monitoring is almost entirely a function of how early in this progression the fault is caught — and each stage caught earlier saves an order of magnitude in both repair cost and unplanned downtime risk.
Stage 1
Ultrasonic and High-Frequency Signal — Weeks to Months Before Failure
The earliest detectable sign of bearing degradation is a change in high-frequency ultrasonic emission and the appearance of very small amplitude spikes in the ultrasonic frequency band, generated by microscopic surface fatigue beginning at the rolling element and raceway contact points. This stage produces no detectable change in overall vibration amplitude, no audible sound, and no temperature rise — it is invisible to every inspection method except continuous high-frequency AI vibration analysis. A bearing caught at Stage 1 can be scheduled for replacement at the next planned maintenance window with zero unplanned downtime risk.
Stage 2
Vibration Signature Onset — Weeks to Failure
As surface fatigue progresses to visible spalling of the raceway or rolling element surface, distinct frequency-domain signatures begin appearing in the standard vibration spectrum — ball pass frequency of the outer race, ball pass frequency of the inner race, and their harmonics become identifiable above the noise floor. This is the stage at which traditional periodic vibration monitoring programmes typically first detect the fault, provided the collection interval happens to fall within this window. AI monitoring running continuously identifies the exact date these signatures emerge, rather than discovering them at the next scheduled route.
Stage 3
Audible and Broadband Degradation — Days to Weeks
Spalling has progressed to the point where the bearing generates audible sound at the housing — a rumble, rattle, or grinding noise depending on the fault location — and broadband vibration amplitude rises noticeably across the full frequency spectrum, not just at the specific fault frequencies. This is the stage at which an experienced technician performing a manual inspection round might first notice something is wrong by listening at the bearing housing, but by this point the fault is well advanced and the remaining time to failure is measured in a much narrower window than at Stage 1 or 2.
Stage 4
Thermal Onset and Imminent Failure — Hours to Days
Internal clearance has degraded to the point where friction generates a measurable temperature rise at the bearing housing, detectable by touch or infrared. This is the final stage before seizure, cage failure, or complete loss of rolling element function. A bearing detected at Stage 4 by manual inspection — the point at which most reactive maintenance programmes first learn of the problem — offers little to no scheduling flexibility and carries the highest risk of secondary damage to the shaft, housing, or connected equipment.
Severity Scoring
Converting Raw Vibration Data Into a Single Actionable Priority Score
Raw vibration spectra and ultrasonic trend lines are not directly actionable for a maintenance planner who is not a vibration analyst. iFactory's AI models translate the fault-stage detection described above into a single severity score per bearing, combined across sensor types and normalised against the specific bearing's baseline signature, so that a planner can prioritise across the entire fleet of monitored bearings without needing to interpret a spectrum plot.
Severity 1–2
Baseline / Watch
No fault frequencies present or amplitude within normal baseline variation. No action required beyond continued monitoring.
Severity 3–5
Early Degradation
Stage 1 or early Stage 2 signature detected. Schedule replacement at next planned maintenance window — no urgency.
Severity 6–8
Active Degradation
Stage 2 or Stage 3 signature confirmed with trend acceleration. Plan replacement within the current maintenance cycle.
Severity 9–10
Critical / Imminent
Stage 3 or Stage 4 signature with rapid trend acceleration. Immediate work order generated with maintenance supervisor notification.
Severity scores update continuously as new sensor data arrives, and every score carries a trend arrow showing whether the bearing's condition is stable, degrading slowly, or degrading rapidly — the trend direction is frequently more actionable than the absolute score for planning purposes.
See Fault Staging on Your Own Bearing Fleet
iFactory Maps Every Monitored Bearing Against the Four-Stage Fault Model in Your First Week
Connect your existing vibration sensors or deploy new wireless sensors on your highest-consequence bearings — mill trunnions, ID fans, kiln support rollers, cooler fans — and iFactory's AI begins building individual baseline signatures immediately, with fault staging and severity scoring live within days of sensor connection.
Remaining Useful Life Prediction
From Severity Score to Scheduled Replacement Date — How RUL Prediction Works
A severity score tells a planner how bad things are right now. Remaining useful life prediction tells them how long they have to act. iFactory's RUL models are trained on the degradation trajectory of the specific bearing type, load condition, and operating speed, using historical failure data from comparable bearings across the fleet combined with the individual bearing's own trend history since baseline.
Trajectory modelling
The model does not simply extrapolate the current trend linearly — bearing degradation typically accelerates non-linearly once Stage 2 begins, and the RUL model accounts for this acceleration curve using patterns learned from prior failure events on similar bearing classes.
Confidence banding
Every RUL prediction is presented as a confidence band, not a single date — for example, 70 to 95 percent probability of failure within a specified window — because presenting false precision on a physical failure process creates more planning risk than an honest range.
Continuous refinement
As new sensor readings arrive, the RUL window narrows and updates automatically. A bearing predicted at 90 to 120 days remaining at Severity 5 will have its window tightened and re-forecast as it approaches and crosses into Severity 6 or higher.
Maintenance window alignment
The RUL prediction is cross-referenced against the plant's existing planned maintenance calendar automatically, flagging whether a predicted failure window falls before, during, or after the next scheduled shutdown — the single most useful output for a planner scheduling parts and labour.
Monitoring by Equipment Type
Sensor Placement and Fault Signature Priorities Across Mill, Fan, and Kiln Bearings
Each rotating asset class in a cement plant presents a different bearing loading condition, speed range, and dominant failure mode, and effective monitoring accounts for those differences rather than applying a single generic threshold across every bearing in the plant.
Mill trunnion bearings
Low-speed, high-load hydrodynamic or antifriction bearings. Monitoring prioritises oil film thickness trending alongside vibration, since trunnion bearings frequently show lubrication-related degradation before classical rolling element fault frequencies emerge.
ID fan bearings
High-speed antifriction bearings under continuous dynamic load. Monitoring prioritises envelope analysis and high-frequency demodulation to catch early Stage 1 spalling before it produces the imbalance signature that dominates fan vibration spectra.
Kiln support roller bearings
Extremely high load, low speed. Monitoring correlates bearing vibration trend with roller alignment and load distribution data, since misalignment across the support system frequently accelerates bearing wear on specific rollers disproportionately.
Cooler fan bearings
Moderate speed, high thermal and dust exposure environment. Monitoring includes contamination-related fault signatures alongside standard fatigue signatures, since dust ingress is a significant secondary degradation driver in this application.
Preheater fan and auxiliary drive bearings
Variable-speed operation with frequent start-stop cycles. Monitoring accounts for the additional fatigue loading that repeated startup transients place on bearings relative to continuously running equipment.
Automated Response Routing
What Happens Automatically When a Bearing Crosses a Severity Threshold
Detection without routed action produces a dashboard nobody checks in time. iFactory's workflow rules translate every severity change into the correct action for the correct person automatically, without a planner needing to review the dashboard proactively every day.
Bearing crosses into Severity 3–5
Bearing added to next planned maintenance window parts list automatically
Reliability engineer notified for trend confirmation, no urgent action required
Bearing crosses into Severity 6–8
Work order created with target completion inside current maintenance cycle
Maintenance planner notified with RUL prediction window attached
Bearing crosses into Severity 9–10
Urgent work order created with priority flag and maintenance supervisor notified immediately
Operations notified of load reduction or shutdown scheduling options if applicable
From the Reliability Floor
Every plant I have worked with had a vibration programme before they had an AI monitoring programme, and the question I always get is why the AI system catches things the manual route missed. The honest answer is that the manual route was never the problem — a skilled vibration analyst can read a spectrum as well as any model. The problem was the interval. A monthly route means a bearing can move from a clean baseline to Stage 3 between two collection dates, and nobody sees it happen until the technician is standing at the housing hearing the noise that Stage 3 produces. Continuous monitoring does not out-analyse a good technician, it simply never misses the window between visits. The second thing that changes with AI monitoring is prioritisation across a large bearing population. A plant with four hundred monitored bearings cannot have an analyst reviewing four hundred spectra every week, but a severity score sorted highest to lowest takes thirty seconds to scan, and that is the difference between a programme that scales and one that quietly falls behind as the sensor count grows.
Rajiv Balasubramaniam
Senior Reliability Engineer · Vibration Analyst Category III · 19 years in rotating equipment reliability across cement and heavy industry · Former Reliability Lead, multi-plant cement group in South Asia · Specialist in bearing failure analysis and predictive maintenance programme design
Manual Rounds vs AI Monitoring
How Detection Timing Changes the Outcome of the Same Bearing Fault
The table below shows how the same underlying bearing fault plays out differently depending on when it is detected — the physical fault progression is identical, but the detection method determines which stage it is caught at, and the stage determines the cost.
| Detection Method |
Typical Detection Stage |
Scheduling Flexibility |
Relative Repair Cost |
| Reactive — operator notices sound or heat |
Stage 3–4 |
None — immediate action required |
Highest — 3 to 6x baseline |
| Monthly manual vibration route |
Stage 2–3 |
Limited — depends on route timing |
Moderate — 1.5 to 2.5x baseline |
| Continuous AI vibration and ultrasonic monitoring |
Stage 1–2 |
Full — schedule at next planned window |
Baseline — planned replacement cost only |
Reliability Team Questions
Bearing Degradation Monitoring — Frequently Asked
How many sensors does a typical mill, fan, or kiln support system need for effective bearing monitoring?
Sensor count depends on the bearing arrangement and criticality of the specific asset, but a general rule is one triaxial sensor per bearing housing on critical rotating equipment, with additional sensors where load is asymmetric across multiple bearings on the same shaft. A mill typically requires sensors at each trunnion bearing plus the pinion bearing set. An ID fan typically requires sensors at both drive-end and non-drive-end bearings. A kiln support system requires sensors at each roller bearing given the load distribution differences across rollers. iFactory's deployment team conducts a criticality assessment of your specific asset configuration and recommends a sensor count and placement plan before installation begins.
Book a session with our deployment team to review sensor placement for your specific equipment configuration.
Can this system work with our existing vibration sensors, or do we need to replace our current hardware?
iFactory's AI models are sensor-agnostic and are designed to ingest data from most existing wired and wireless vibration sensor infrastructure, including many common industrial accelerometer and wireless vibration sensor brands already deployed in cement plants. In most cases, the existing sensor network can be connected to iFactory's platform without hardware replacement, with only a data integration step required. For bearings that are not currently monitored, iFactory can recommend and deploy new wireless sensors as part of the onboarding process.
Contact our support team with your current sensor inventory for a compatibility assessment.
How accurate is the remaining useful life prediction, and how far in advance can it reliably forecast failure?
RUL prediction accuracy improves as a bearing progresses through the fault stages, since more degradation data becomes available to refine the trajectory model — early Stage 1 predictions carry wider confidence bands measured in months, while Stage 2 and Stage 3 predictions narrow to weeks and days respectively as the failure mode becomes clearer. The models are continuously validated against actual replacement and failure events across the monitored fleet, and prediction confidence is always presented as a range rather than a single date, since presenting false precision would create more planning risk than value. Prediction accuracy also improves over time on a specific bearing population as the model accumulates more site-specific failure history.
Book a demo to see actual RUL accuracy data from comparable cement plant deployments.
Will this system generate false alarms, and how does it distinguish real bearing degradation from normal operating variation?
False alarm management is one of the most important design considerations in any condition monitoring system, since a system that alarms too frequently loses operator trust and gets ignored regardless of accuracy. iFactory's models establish an individual baseline signature for each bearing over an initial learning period, accounting for that specific bearing's normal variation across load, speed, and process conditions, rather than applying a generic threshold across all bearings of a given type. Alarms are triggered on statistically significant deviation from the bearing's own established baseline combined with the presence of recognised fault frequency signatures, not on raw amplitude alone. This combination substantially reduces false alarms compared to simple threshold-based vibration alarms.
Reach out to our support team to review false alarm rate data from existing deployments.
How does bearing monitoring integrate with our existing CMMS and maintenance planning process?
iFactory's platform integrates with common CMMS systems to automatically create work orders when a bearing crosses a defined severity threshold, populate the work order with the specific bearing identification, current severity score, and RUL prediction window, and update the work order status as the bearing's condition changes prior to the scheduled repair. This integration eliminates the manual step of a reliability engineer reviewing a monitoring dashboard and separately logging a work request, which is frequently the point where early-stage detections are lost between systems. For plants without an existing CMMS, iFactory's built-in work order module can serve as the primary maintenance tracking system for monitored equipment.
Book a session with our integration team to discuss your specific CMMS configuration.
Every Bearing Failure Was Detectable at Stage 1. Most Are Caught at Stage 4.
Move Your Bearing Fleet From Reactive Replacement to Scheduled, Planned Maintenance
iFactory connects to your existing vibration sensors or deploys new ones on your highest-consequence bearings, builds individual fault-stage baselines within days, and routes severity-based alerts directly into your maintenance planning process — so the next bearing failure on your mill, fan, or kiln support system is a scheduled parts order, not an unplanned shutdown.