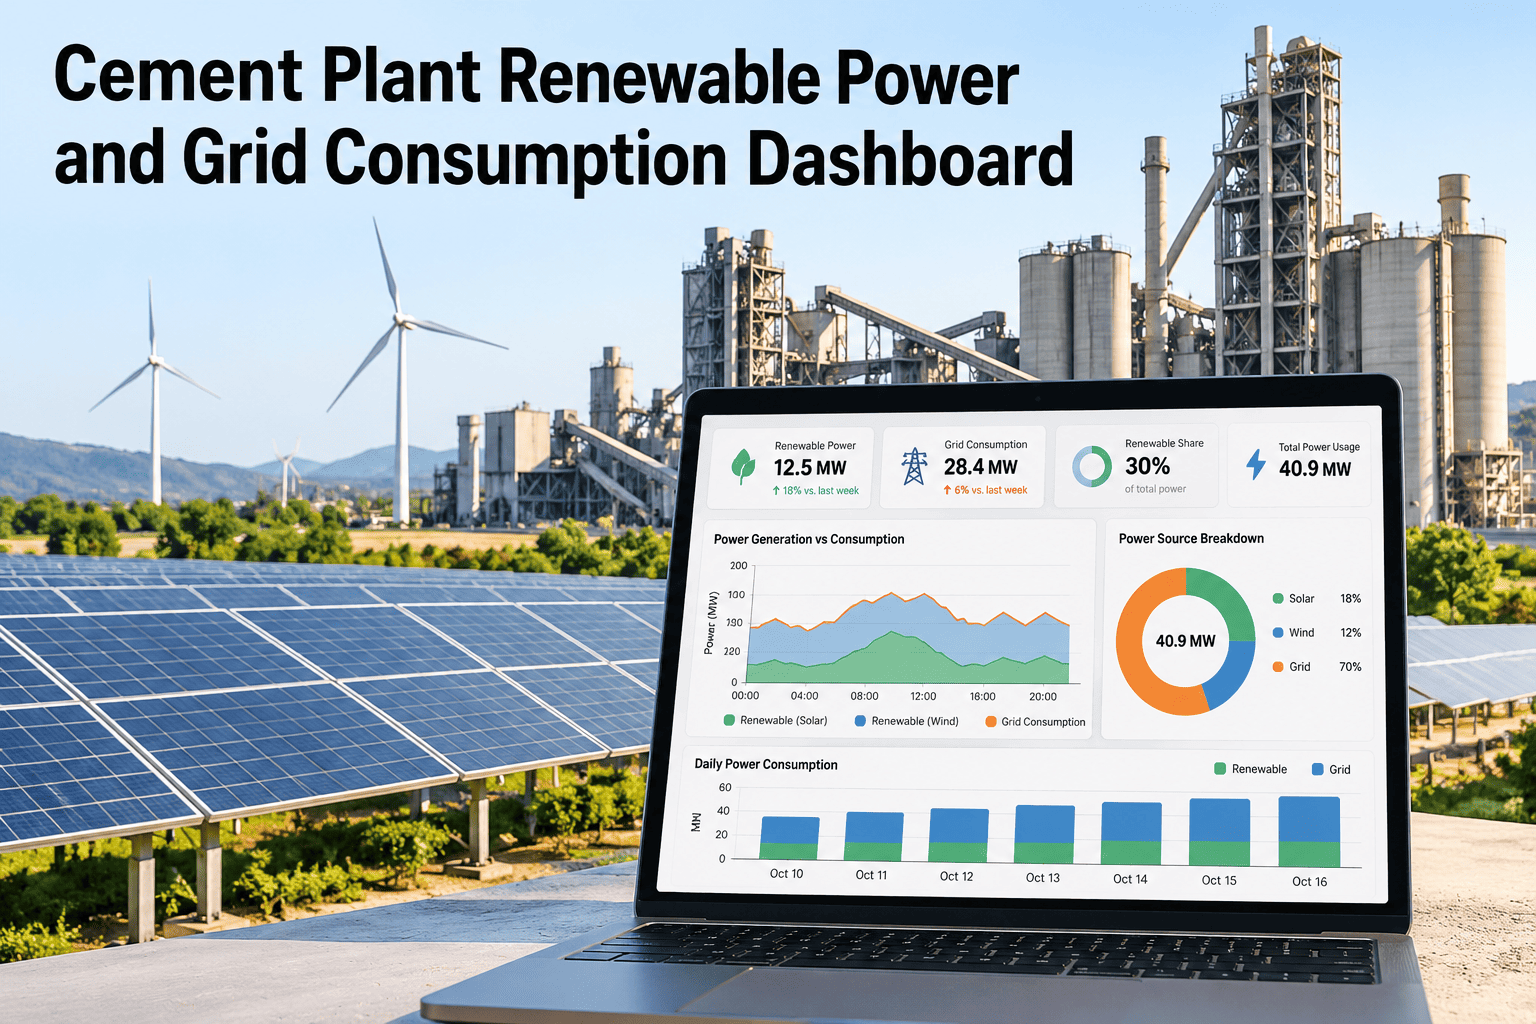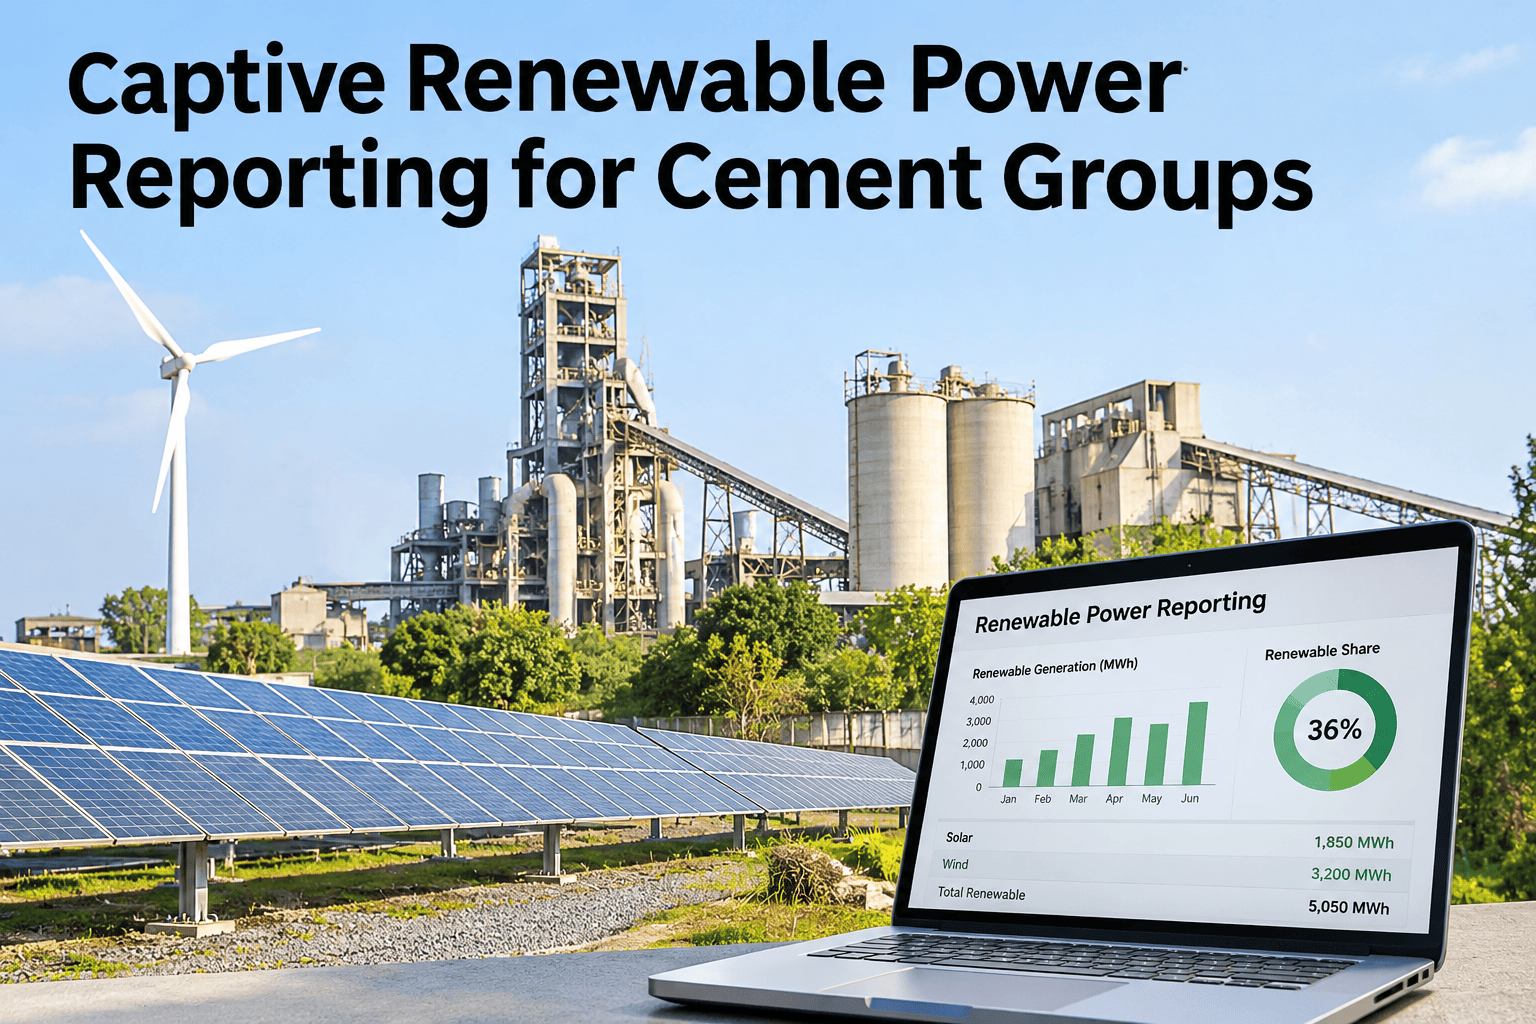
A cement group running solar, wind and waste heat recovery across a dozen plants faces a reporting problem most single-site operations never see — each asset generates its own data, in its own format, and someone at group level has to roll it all up into one number the board actually trusts. Waste heat recovery alone can supply a meaningful share of a plant's electricity at near-zero marginal cost once it is built, and major cement groups across India and Pakistan have been expanding captive solar, wind and WHRS capacity through 2026 specifically to manage this. Reporting that captive mix cleanly, site by site and rolled up to the group, is what turns a sustainability target into a number operations can actually be held to. Energy and sustainability teams who want to see their own site hierarchy mapped into one group view can walk through a captive power reporting setup with our team.
One Reconciled Renewable Share, Across Every Site
iFactory, an on-premise AI platform for cement group energy management, rolls up solar, wind and waste heat recovery generation against consumption at every site into one group-level reporting view.
Why Does Group-Level Renewable Reporting Break Down So Often?
Each site typically reports its own generation and consumption in its own spreadsheet, on its own schedule, using its own definitions of what counts toward renewable share. Rolling those up by hand means someone at group level is reconciling different formats, different meter types and different reporting periods every single cycle — and the resulting number is only as reliable as the weakest site's data. Ask our team how your current site reports would roll up into one group view.
From Asset to Site to Group
Each site's own asset hierarchy — individual solar arrays, wind turbines, WHRS units and grid connections — rolls up to a site total, and site totals roll up to the group figure the board actually reviews.
See Your Own Site Hierarchy Rolled Up Into One View
Share your current site-level generation and consumption reports, and we will show how they consolidate.
What Gets Allocated, and Where It Can Go Wrong
| Data type | Source | Common allocation error |
|---|---|---|
| Solar generation | Inverter or plant meter | Curtailment periods not distinguished from downtime |
| WHRS generation | Generator meter | Counted twice if also logged under kiln process data |
| Grid import | Utility meter or billing data | Billing period does not align with reporting period |
| Site consumption | Sub-metering by area | Unmetered loads estimated rather than measured |
What the Board Actually Wants to See
The Group Figure That Was Quietly Wrong for Two Quarters
A group's reported renewable share held steady for two quarters before a data audit found one site had been reporting its WHRS output against an outdated kiln run-time baseline, overstating that site's contribution to the group figure.
One Reconciled Figure, Built From Every Site's Own Data
Site & Asset Hierarchy
Solar, wind, WHRS and grid data are organized under the same structure at every site.
Automated Reconciliation
Generation and consumption are checked for gaps and stale baselines before roll-up.
Group KPI Dashboard
Renewable share, cost avoided and WHRS availability are tracked by site and consolidated.
Turnkey On-Premise Deployment
Energy data stays on your own infrastructure, with no outside cloud dependency.
What Energy Teams Ask About Captive Power Reporting
Can this handle different renewable asset types across sites?
Yes. Solar, wind and WHRS each generate differently and are metered differently, so the hierarchy is built to hold each asset type's own data while still rolling up to a consistent site and group figure. Ask how your specific asset mix would map into the hierarchy.
How often should the group figure be reconciled?
Most groups reconcile monthly at minimum, with continuous checks for obviously stale or missing site data in between, rather than waiting for a quarterly roll-up to catch a gap. Ask support about reconciliation cadence.
Does this calculate cost avoided, or only renewable share?
Both, when tariff data is connected — the same reconciled generation and consumption figures that produce renewable share can also be compared against prevailing grid tariffs to estimate avoided cost. Discuss cost avoided reporting for your group.
How does WHRS data get reconciled against kiln operation?
WHRS generation is checked against kiln run-time records, since WHRS output should track kiln operation closely, and a mismatch between the two is usually the first sign of a stale baseline or a metering issue. Ask how this check works for your WHRS units.
Can new sites be added to the group hierarchy later?
Yes. A new site is added to the same hierarchy structure, and once its own meters are connected it is included in the group roll-up without requiring the reporting logic for existing sites to change. Discuss adding a new site to your reporting group.
Give the Board One Renewable Share Figure Everyone Trusts
See solar, wind, WHRS and grid data reconciled site by site and rolled up into one group view.