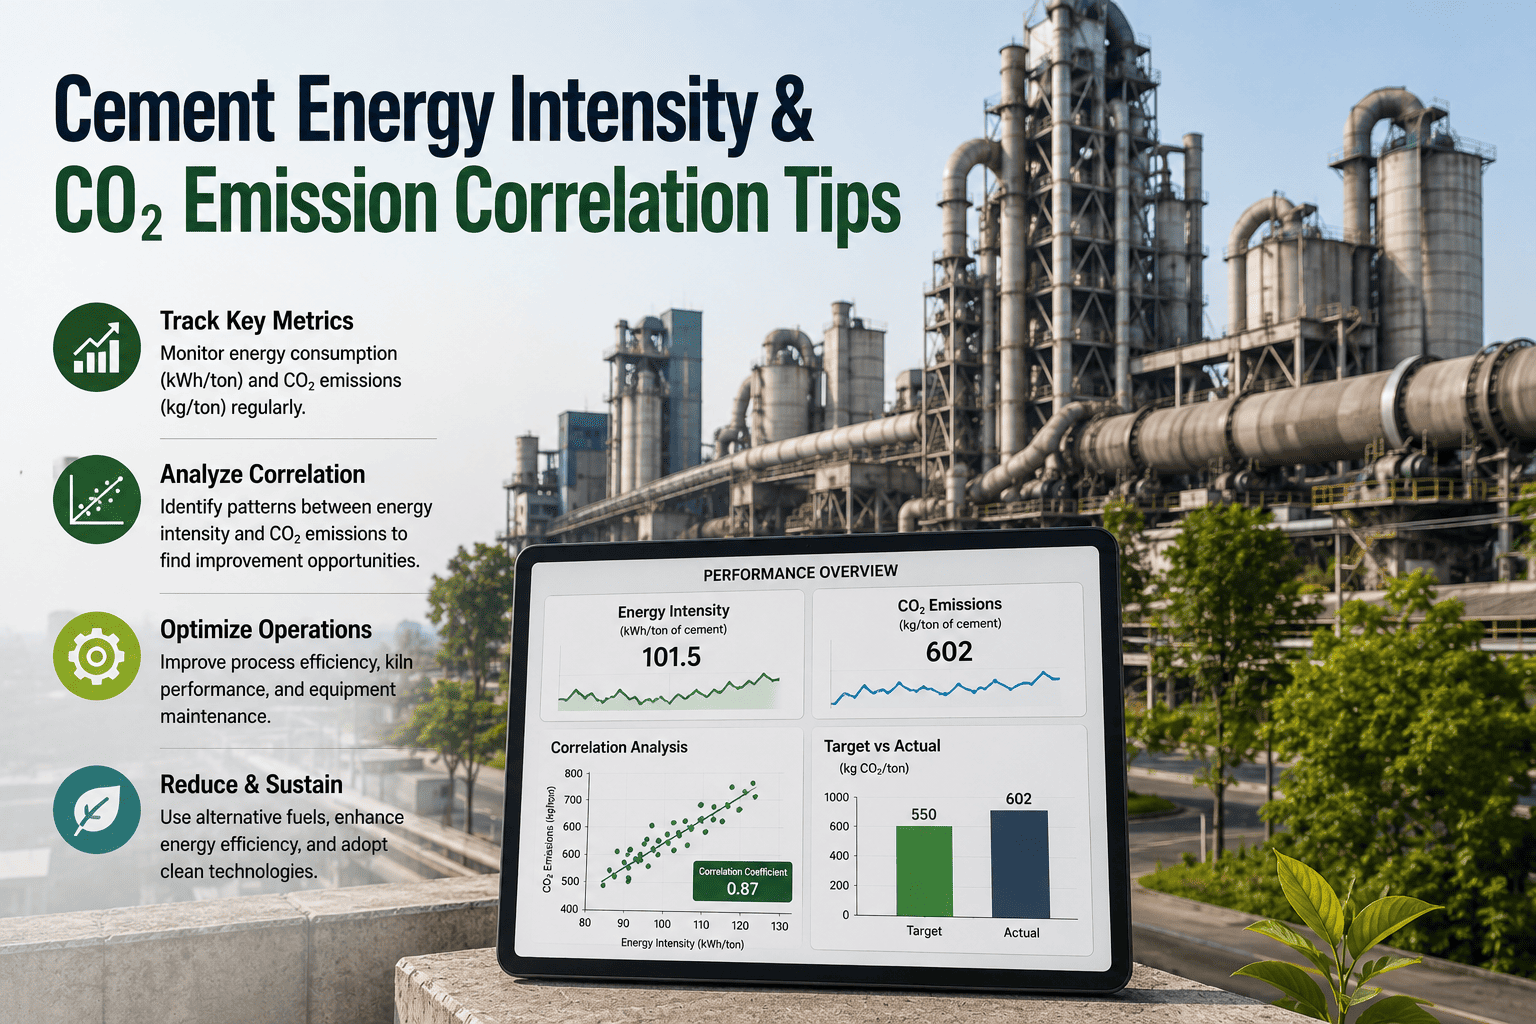
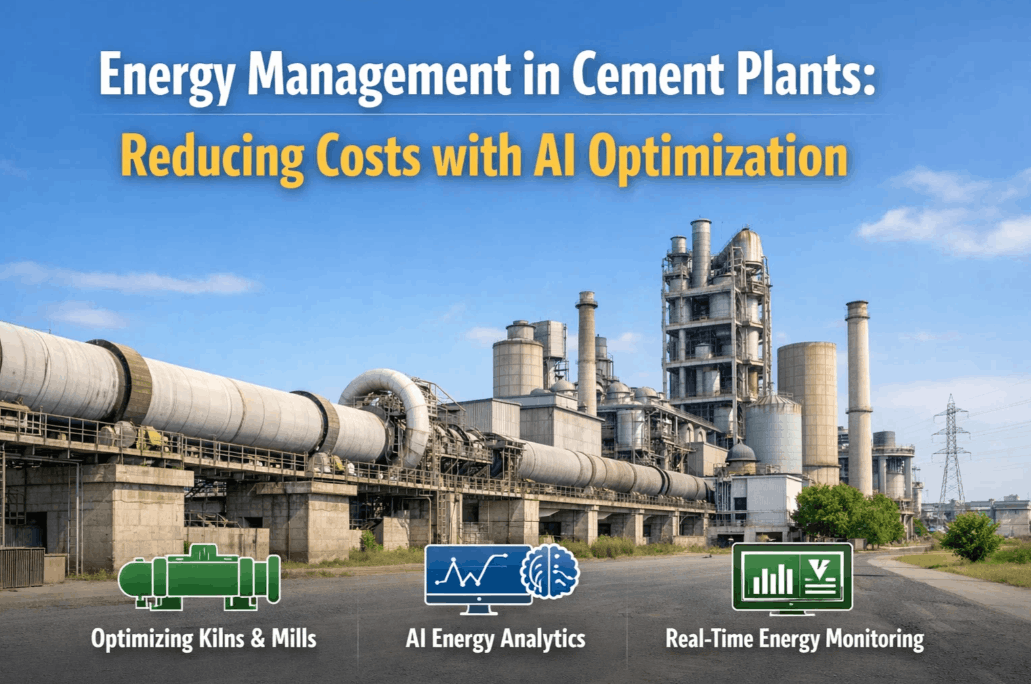
Every cement plant tracks two numbers that quality and energy teams have historically treated as separate reports: gigajoules burned per tonne of clinker, and kilograms of CO2 released per tonne of cement produced. Decades of kiln data across hundreds of plants show these two numbers do not move independently — when thermal fuel consumption per tonne drops, the emission factor almost always drops with it, because fuel combustion alone accounts for roughly 40% of a typical cement plant's total carbon footprint, second only to the calcination reaction itself. Energy managers who run efficiency projects and carbon reporting as two disconnected workstreams end up duplicating audits, missing shared savings that a single fix could unlock twice over, and publishing numbers to corporate and to regulators that don't reconcile with each other by year end. Plants that get ahead on both fronts are the ones that stopped asking "what's our energy intensity" and "what's our emission factor" as two separate questions, and if your kiln data still lives in two disconnected spreadsheets, walking through what a merged energy-carbon view looks like on a quick demo call is the fastest way to see the gap.
ENERGY MANAGEMENT · CEMENT
Energy Intensity and CO2 Are Not Two Metrics — They Are One Signal Read Twice
A plant-by-plant look at why gigajoules per tonne of clinker and kilograms of CO2 per tonne of cement track each other so closely, and how integrated monitoring turns one efficiency fix into a measurable double win for cost and carbon.
3.6 GJ/t
Typical thermal energy needed per tonne of clinker under current fossil-fired kiln practice
40–50%
Share of total plant CO2 that comes from the calcination reaction itself, before fuel is even burned
0.52–0.95 t
Range of CO2 released per tonne of cement across global plants, depending on clinker ratio and fuel mix
Up to 60%
Decarbonization potential researchers attribute to combined efficiency, fuel-switching, and capture measures
01
The Physics Behind the Correlation
Why a Kiln That Burns Less Fuel Almost Always Emits Less Carbon
Cement chemistry makes the energy-carbon link almost unavoidable. Producing one tonne of clinker means heating raw meal to roughly 1,450°C, and every gigajoule needed to get there and hold that temperature is supplied almost entirely by fossil fuel — coal, petroleum coke, or increasingly a blend that includes alternative fuels. That combustion step alone contributes close to 40% of the plant's direct emissions. A second, chemically unavoidable source sits alongside it: calcining limestone releases CO2 as calcium carbonate breaks down into calcium oxide, contributing roughly 40 to 50% of total emissions regardless of how efficient the kiln is. The remaining share comes from electricity for grinding and material handling, plus product cooling and transport.
This split matters because it explains a pattern energy managers see constantly in their own data: a kiln upgrade that cuts specific thermal energy consumption — the GJ burned per tonne of clinker — reduces the combustion-linked share of emissions almost one-for-one, while leaving the calcination-linked share untouched unless the clinker ratio itself changes. That is precisely why energy intensity and emission intensity correlate so tightly on a plant's own historical trendline, but why two plants with identical thermal efficiency can still report very different total emission factors if one uses a higher-clinker cement mix than the other.
Where a Tonne of Cement's CO2 Actually Comes From
Calcination · ~45%
Fuel Combustion · ~40%
Power, Cooling, Transport · ~15%
02
Regional Benchmarking
How Energy Intensity and Emission Factors Compare Across Regions
Published plant studies show a wide spread in both numbers, and the spread itself is informative — it tells you how much headroom exists between a plant running best-available technology and one running legacy kiln lines. The table below lines up thermal energy intensity against the clinker emission factor for the ranges most commonly reported in industry literature, so a plant can see roughly where its own numbers should sit relative to global practice before assuming its current performance is "normal."
| Region / Practice Tier |
Thermal Energy Intensity |
Clinker Emission Factor |
Typical Kiln Technology |
| Best-available dry kiln, preheater/precalciner |
~2.9 GJ/tonne clinker |
~0.52 t CO2/tonne clinker |
Modern dry process, 5–6 stage preheater |
| India, typical modern plant |
3.6–4.0 GJ/tonne clinker |
~0.56 t CO2/tonne clinker |
Dry process with partial waste heat recovery |
| European Union, regulated fleet |
3.5–4.5 GJ/tonne cement |
~0.72 t CO2/tonne clinker |
Mixed dry process, higher alternative fuel share |
| United States, national average |
4.0–4.7 GJ/tonne clinker |
~0.75 t CO2/tonne clinker |
Mixed dry and legacy wet kilns still in service |
| Legacy wet-process kiln |
~7.0 GJ/tonne clinker |
Highest in class |
Wet process, minimal heat recovery |
The pattern across every row is consistent: the lower the thermal energy intensity, the lower the clinker emission factor, and the gap between the best-available-technology row and the legacy wet-process row is more than double on both metrics simultaneously. That is the correlation showing up at the industry level, not just inside a single plant's trendline — which is exactly why a joint energy-carbon reduction plan tends to outperform a plan that optimizes only one variable.
SEE YOUR OWN KILN DATA MAPPED
Stop Reconciling Two Spreadsheets That Should Be One Dashboard
Bring your last twelve months of kiln fuel logs and emission reports to a working session, and see them merged into a single energy-carbon view you can actually act on.
03
Joint Reduction Levers
Four Levers That Move Energy Intensity and Emissions Together
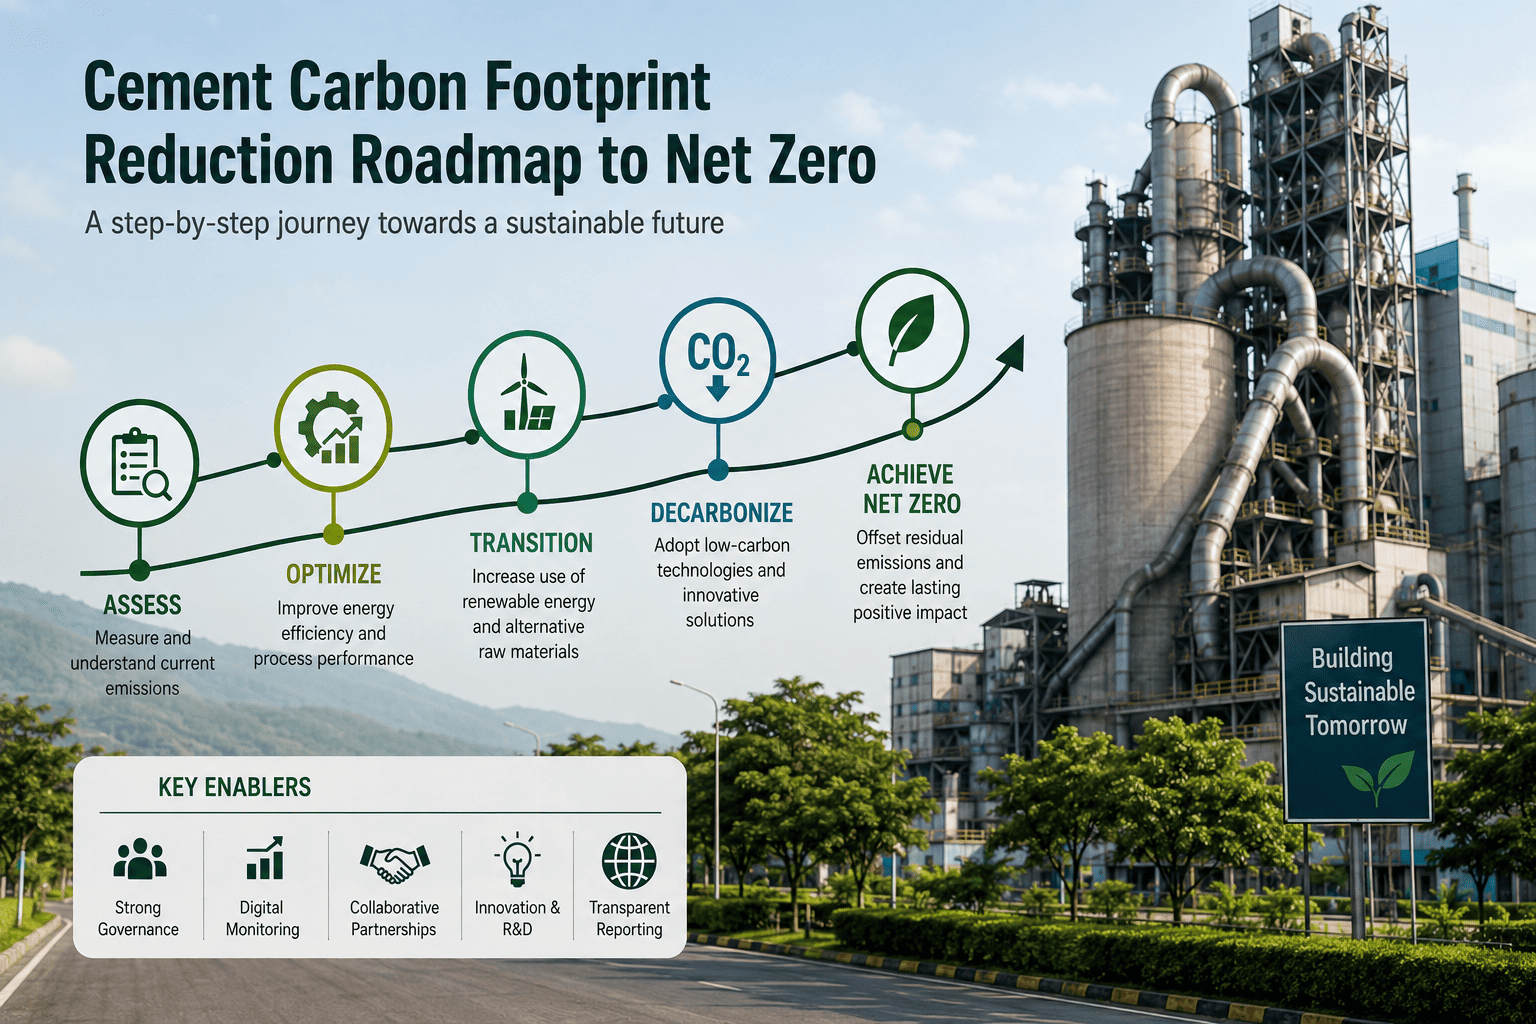
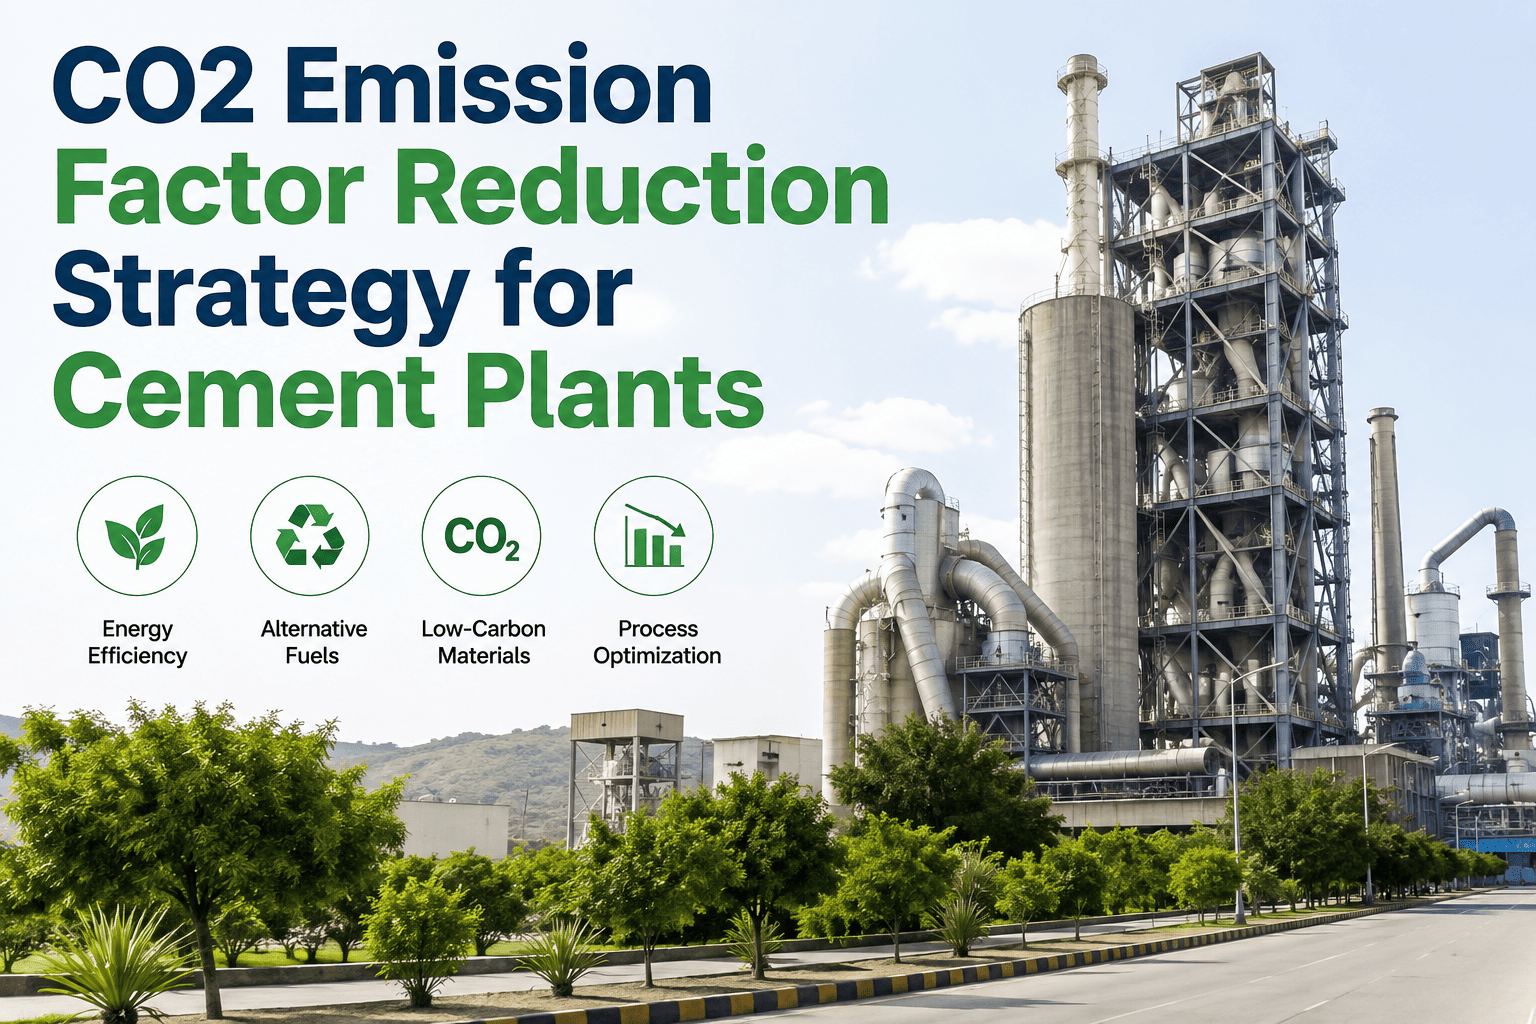
Not every efficiency project delivers a carbon co-benefit, and not every emission-reduction project saves energy cost — but a specific set of levers reliably does both, which is why plants building an integrated management approach tend to prioritize these first.
LEVER 01
Waste Heat Recovery From Kiln Exhaust
Capturing sensible heat from preheater exhaust and clinker cooler air to generate power or preheat raw meal directly cuts the GJ/tonne figure at the source. Because that saved energy would otherwise have come from fuel combustion, the emission factor drops in near-direct proportion — this is typically the single highest-leverage joint lever available to a plant that hasn't already installed it.
LEVER 02
Alternative Fuel Substitution
Replacing a portion of coal or petcoke with refuse-derived fuel, biomass, or sewage sludge changes the emission factor of the combustion share even when total thermal energy input stays flat, because biogenic fuel fractions are treated differently in most carbon accounting frameworks. Plants running blended fuel streams have documented measurable reductions in fuel-related CO2 per tonne of clinker from this lever alone.
LEVER 03
Clinker-to-Cement Ratio Reduction
Blending in supplementary cementitious materials — fly ash, slag, calcined clay — reduces the clinker fraction per tonne of finished cement, which lowers both the calcination-linked and combustion-linked emissions simultaneously, since less clinker means less limestone calcined and less fuel burned to produce it. This lever touches both halves of the correlation at once, which is rare.
LEVER 04
Preheater and Precalciner Stage Upgrades
Moving from a 4-stage to a 5- or 6-stage preheater configuration, or adding a precalciner, is a capital project with a well-documented energy payback — but it also compounds with every other lever on this list, because a more thermally efficient kiln makes alternative fuel combustion more stable and waste heat recovery more productive per unit of exhaust volume.
04
Co-Benefit Quantification
Turning One Fix Into a Number Two Departments Can Both Report
The practical value of tracking energy intensity and emissions together shows up at budget and audit time. A single waste heat recovery retrofit, once commissioned, produces two separate line items that used to require two separate justification processes — a fuel cost saving the energy team reports to plant finance, and an emission reduction the sustainability team reports to corporate ESG disclosure. When those two numbers are calculated from the same underlying meter data instead of two independently maintained models, they stop drifting apart over time and stand up better to external audit.
Energy Team Reports
Fuel cost avoided, GJ/tonne reduction, payback period on capital spend
Sustainability Team Reports
Tonnes CO2 avoided, progress against Scope 1 target, disclosure-ready figures
Shared Source of Truth
One metered dataset feeding both reports, reconciled automatically instead of manually cross-checked each quarter
Plants that consolidate this reporting typically find the reconciliation exercise that used to consume days of two teams' time each quarter shrinks to a review step, simply because the numbers were never allowed to diverge in the first place.
05
Building the Monitoring Loop
What an Integrated Energy-Carbon Monitoring Setup Actually Looks Like
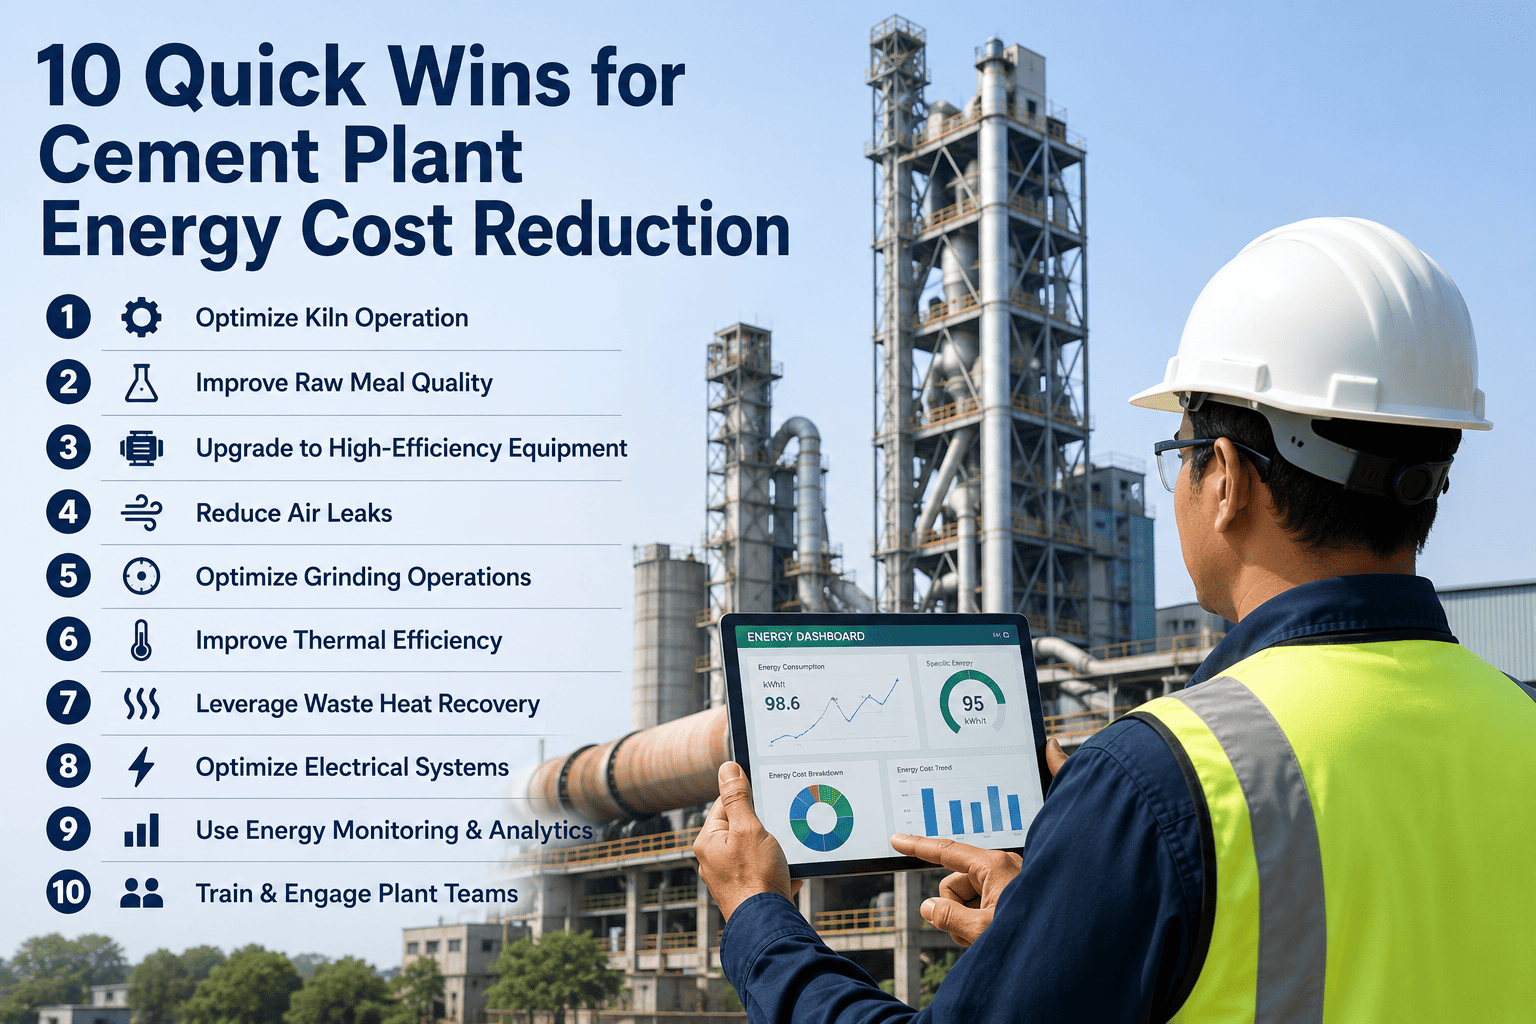
Integration does not mean replacing existing kiln instrumentation — it means routing the data that already exists into a shared model that calculates both metrics from the same inputs, on the same schedule, at the same granularity.
1
Meter Fuel and Power at the Same Interval as Production Data
Thermal energy intensity and emission factor calculations both require fuel input matched against clinker or cement output for the same time window — hourly or per-batch is standard practice, since daily averages smooth over exactly the swings that matter for root-cause analysis.
2
Apply One Emission Factor Model, Not Two
Use a single cement-based or clinker-based calculation methodology consistently across the energy and sustainability teams, so a change in raw material lime content or fuel blend updates both the cost model and the carbon model from the same source calculation.
3
Trend Both Metrics on the Same Chart
Plotting GJ/tonne and kg CO2/tonne on a shared timeline makes divergence visible immediately — if emissions rise while energy intensity holds flat, that signals a fuel-mix or raw-material shift worth investigating before it shows up in a quarterly report.
4
Feed Both Numbers Into the Same Project Business Case
When evaluating a capital project, quantify the fuel-cost payback and the emission-reduction value together in one proposal, so the true return includes both benefits instead of only the one the sponsoring department cares about.
Frequently Asked
Energy-Carbon Integration Questions Plant Teams Ask First
Do we need new sensors to correlate energy intensity with emissions, or can we use what we already have?
Most plants already meter the fuel flow, power draw, and production tonnage needed for both calculations — the gap is almost always in how that data is modeled afterward, not in the instrumentation itself. Fuel and power readings that already feed your energy dashboards can be routed into an emission-factor calculation using the same time-stamped records, which avoids installing duplicate metering. Where a genuine gap exists, it is usually around alternative fuel composition tracking, since biogenic content needs to be logged separately for accurate carbon accounting. A quick
demo can walk through what your current instrumentation already covers.
Why do two plants with the same thermal energy intensity sometimes report different emission factors?
Thermal energy intensity only governs the fuel-combustion share of emissions, which is roughly 40% of the total — the calcination share, driven by the clinker-to-cement ratio and raw material chemistry, moves independently. A plant blending in more supplementary cementitious material can hold the same GJ/tonne figure as a peer plant while reporting a meaningfully lower emission factor, simply because less limestone is being calcined per tonne of finished cement. This is exactly why tracking only one metric gives an incomplete picture of where a plant actually stands.
How long does it take to see a measurable correlation once we start tracking both metrics together?
A reliable trendline typically emerges within one to two full production quarters, since both metrics need enough data points across varying fuel mixes, raw material batches, and kiln operating conditions to separate real correlation from short-term noise. Plants that already have historical fuel and production logs can often backfill a year or more of trend data immediately, which shortens the time to a usable baseline considerably. From there, any new efficiency project shows its dual impact on both curves within the reporting period it goes live.
Which lever gives the fastest combined payback on energy cost and emissions for a mid-sized plant?
Waste heat recovery from kiln exhaust is generally the fastest-paying joint lever for plants that have not yet installed it, because it reduces fuel-derived energy demand directly rather than requiring a fuel-mix or raw-material change that takes longer to validate. Alternative fuel substitution can deliver a faster emissions-only result in some regions, but the cost payback depends heavily on local fuel pricing and available waste-fuel supply. The right answer depends on your current kiln configuration, and reviewing your specific baseline during a
support session is the most reliable way to rank the options for your plant.
Does integrating energy and carbon reporting change how we report to regulators or corporate ESG teams?
The underlying disclosure requirements themselves don't change, but the reliability of the numbers going into those disclosures generally improves once both are calculated from a single data source rather than two independently maintained spreadsheets. Auditors tend to raise fewer follow-up questions when a plant can show that its energy cost figures and its emission figures trace back to the same metered inputs, since discrepancies between separately maintained models are one of the most common findings in external reviews. Most plants find the integration work pays for itself the first time it removes a reconciliation flag from an audit cycle.
ONE DATASET · TWO REPORTS · ZERO RECONCILIATION
Your Fuel Logs Already Contain Your Carbon Story
iFactory maps your kiln's energy intensity and emission factor from the same source data, so every efficiency project shows its cost savings and its carbon reduction side by side — automatically, every reporting cycle.