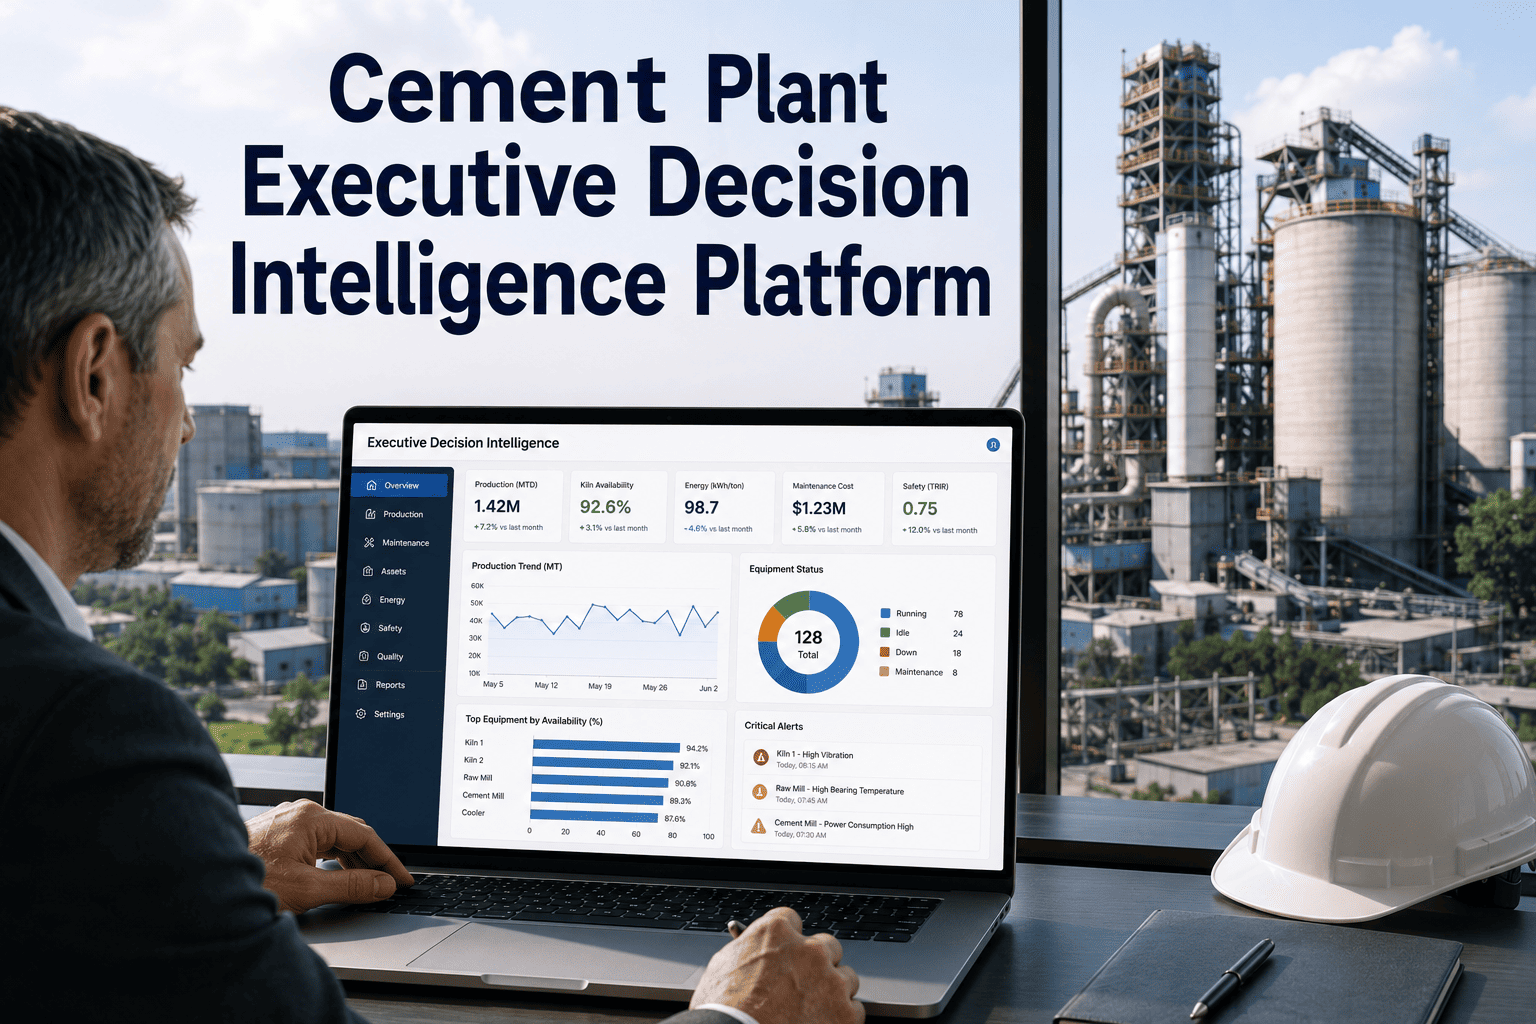
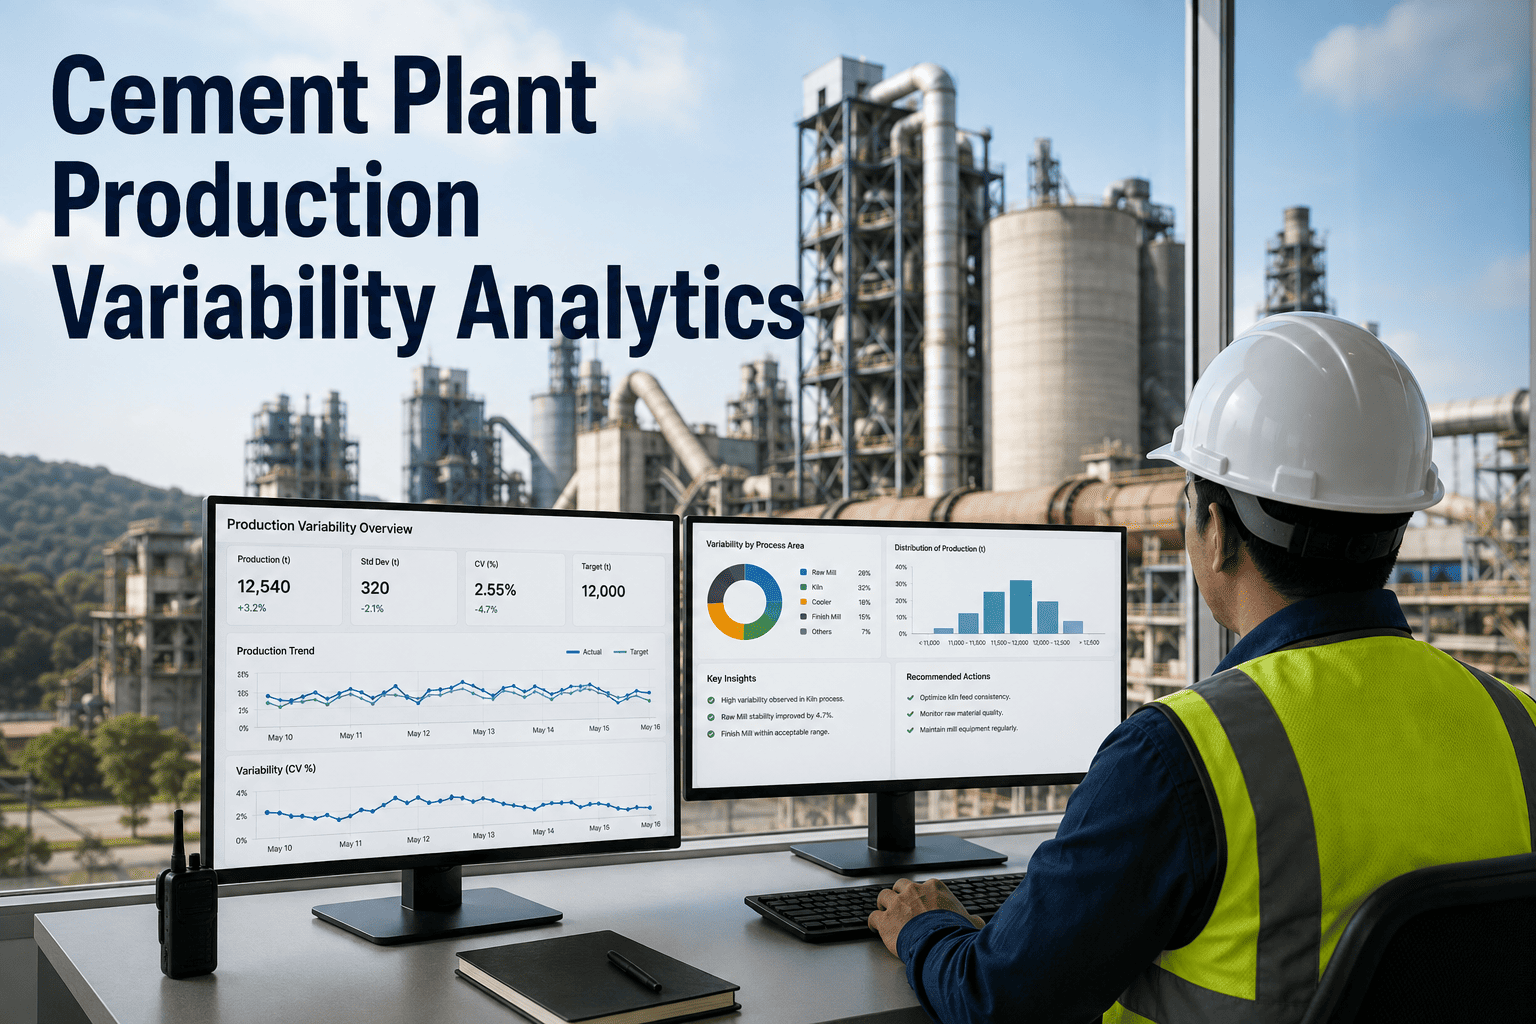
A plant director walking into a Monday leadership meeting usually has four separate reports in front of them — a production summary from operations, a cost report from finance, a maintenance backlog from the CMMS, and an energy consumption chart from the utilities team — and the real decision, like whether to defer a shutdown or approve overtime for a critical repair, requires mentally combining all four under time pressure. iFactory's Executive Decision Intelligence Platform brings production, maintenance, energy, and financial data into one continuously updated view built for exactly that kind of decision, with full platform access through iFactory support.
AI Decision Intelligence · Cement Plant Leadership
Production, Maintenance, Energy, and Financial Data — One Screen, Not Four Meetings
iFactory's executive platform combines operational and financial data into a single continuously updated view, so plant leadership makes decisions based on the current state of the plant instead of last week's separate reports.
Production
94.2%
of Monthly Target
Maintenance Cost
$4.12
Per Ton, Trending Down
Energy Intensity
102.6
kWh/Ton, Above Target
Risk Alerts Open
3
Requiring Executive Review
Why Executive Decisions Lag Plant Reality
By the Time Four Reports Reach the Same Table, the Numbers Are Already a Week Old
Every function in a cement plant has good reporting. Production tracks tonnage and downtime, maintenance tracks work orders and backlog, energy tracks consumption against production, and finance tracks cost against budget. The problem isn't any single report — it's that each one is compiled on its own schedule, by its own team, in its own format, and by the time all four land on an executive's desk for a shutdown-or-continue decision, the underlying situation on the plant floor may have already changed. A decision about whether to approve emergency repair overtime needs the current maintenance risk, the current production impact, and the current cost implication together, in the moment, not reconstructed from four documents written on four different days.
iFactory's decision intelligence platform is built around that reality. It doesn't try to replace the detailed reports each function already relies on — it pulls the metrics that matter most for cross-functional decisions into one continuously current view, so a plant director or general manager can see the whole picture at the moment a decision actually needs to be made.
Four Data Domains, One Executive View
What Gets Combined Into Every Executive Decision Panel
01
Production Performance
Current output against the monthly target, downtime trends, and utilization by line give leadership a real-time read on whether the plant is on pace.
02
Maintenance and Reliability
Open risk alerts, backlog health, and reliability trends surface the maintenance issues genuinely significant enough to warrant executive attention.
03
Energy and Sustainability
Energy intensity per ton, fuel mix, and emissions trends are tracked against both internal targets and regulatory reporting requirements.
04
Financial Performance
Maintenance cost per ton, budget variance, and the cost impact of open production or reliability issues connect operational decisions directly to the numbers finance reports upward.
Decision Support in Practice
Turning a Cross-Functional Judgment Call Into a Single Combined View
When a decision spans multiple functions, the platform assembles the relevant data from each domain into one panel, so the tradeoff is visible at a glance instead of requiring a round of phone calls.
Example Decision: Defer Kiln Shutdown by 48 Hours or Proceed Now?
Production Impact
Deferring risks 340 tons of lost output if the refractory issue worsens before the delayed stop.
Maintenance Risk
Current risk score for the flagged zone is elevated but not yet critical, based on the latest thermal trend.
Cost Comparison
Proceeding now costs an estimated $38,000 in expedited parts; deferring risks a larger unplanned repair scope.
Recommendation
Proceed with the planned stop now, based on the combined risk and cost comparison across both scenarios.
Big Decisions Deserve the Full Picture, Not Whichever Report Reached You First.
iFactory combines production, maintenance, energy, and financial data continuously, so plant leadership decisions are grounded in the current state of the plant.
How the Platform Is Built
Five Systems Combined Into One Continuously Updated Executive View
1
Production and DCS data — tonnage, downtime, and utilization figures are pulled continuously from the plant's control systems rather than compiled at the end of each shift.
2
CMMS and risk scoring data — maintenance backlog, work order status, and the plant's composite risk scores feed the reliability panel of the executive view.
3
Energy metering systems — fuel and electricity consumption by process area are tracked against production output to calculate current energy intensity.
4
ERP and financial systems — budget, actual spend, and cost variance data connect operational metrics to the financial reporting leadership already tracks.
5
Cross-domain decision templates — recurring decision types, such as shutdown timing or overtime approval, have pre-built panels that assemble the relevant data automatically when needed.
Before vs. After
Executive Visibility — Separate Reports vs. iFactory Combined Intelligence
Function
Separate Departmental Reports
iFactory Decision Intelligence
Data Currency
Each report compiled on its own schedule, often days apart from the others
Production, maintenance, energy, and financial data updated continuously
Decision Preparation
Staff manually assemble data from four sources ahead of a leadership decision
Relevant cross-functional data pre-assembled into a single decision panel
Cost Visibility
Operational tradeoffs are discussed without a clear real-time cost comparison
Financial impact of each option is shown alongside the operational data
Response Time
A cross-functional decision can take days to gather input from every department
The combined view is available immediately when a decision needs to be made
Consistency
Each function reports its own numbers, occasionally in conflict with each other
Every panel draws from the same underlying operational and financial data
Measured Outcomes
What Plant Leadership Sees After Deploying Decision Intelligence
3.5 hrs
Weekly Prep Time Saved
Staff report a meaningful reduction in time spent manually assembling cross-functional data ahead of leadership review meetings.
28%
Faster Cross-Functional Decisions
Having production, maintenance, energy, and cost data combined into one panel shortens the time from a decision point being raised to a resolution.
1 view
Replacing Four Separate Reports
Production, maintenance, energy, and financial reporting are unified into a single continuously current executive dashboard.
14%
Reduction in Avoidable Overtime Costs
Better-informed shutdown and repair timing decisions, made with full cost visibility, reduce reliance on last-minute emergency approvals.
Continuous
Data Refresh Across All Domains
Production, maintenance, energy, and financial figures update as new data arrives, keeping the executive view current between formal reporting cycles.
4
Departmental Systems Unified
Operations, maintenance, energy management, and finance data are combined into consistent, comparable metrics for leadership review.
Field Case
Approving a $38,000 Expedited Repair in One Meeting Instead of Three Days of Emails
A cement plant's general manager faced a decision on whether to approve expedited parts shipping for a kiln refractory repair or wait for standard delivery and risk a longer unplanned stoppage if the condition worsened first. Under the previous process, this kind of decision typically took two to three days, as the plant director requested input separately from maintenance on repair urgency, from production on the tonnage impact of each timeline, and from finance on the cost difference between expedited and standard shipping. With the decision intelligence platform already tracking all three data streams, the general manager pulled up the pre-built shutdown decision panel during the daily operations call and had the combined risk, production impact, and cost comparison in front of them immediately. The expedited repair was approved in that same meeting, and the kiln was back in operation two days sooner than the standard-shipping scenario would have allowed.
3 days → 1 meetingDecision turnaround time
$38,000Expedited repair cost, approved with full context
2 daysFaster return to full kiln operation
Frequently Asked Questions
Executive Decision Intelligence Platform — What Plant Leaders Ask First
Does this replace the detailed reports each department already produces?
No — production, maintenance, energy, and finance teams continue producing the detailed reports they rely on for day-to-day management within their own function. The executive platform sits above those reports, pulling the specific metrics most relevant to cross-functional decisions into one combined view, so leadership isn't required to read four full reports to understand a single tradeoff. Detailed department-level reporting remains available for anyone who wants to drill into the underlying numbers.
Book a Demo to see both levels of detail together.
How are the pre-built decision panels created?
Common cross-functional decisions — such as shutdown timing, overtime approval, or capital repair versus deferred maintenance — are configured as templates during setup, based on which data points your leadership team typically needs when facing that kind of decision. Templates are built collaboratively with your plant leadership so the panel reflects how your team actually weighs the tradeoff, rather than a generic industry default.
Can this integrate with our ERP and financial systems, not just plant floor data?
Yes — the platform connects to common ERP and financial systems to pull budget, actual spend, and cost variance data alongside the operational data from your DCS, CMMS, and energy metering systems. This is what allows a decision panel to show both the operational tradeoff and its financial consequence side by side.
Contact support to confirm compatibility with your specific ERP platform.
Who at the plant typically has access to this platform?
Access is generally configured for plant directors, general managers, and senior functional leaders across production, maintenance, energy, and finance, since the platform is built for decisions that span those functions. Access levels can be scoped so each user sees the detail relevant to their role, from a full cross-functional view for the plant director to a more focused view for a department head.
How long does deployment take for a full executive platform?
A single-plant deployment connecting to existing DCS, CMMS, energy, and ERP systems typically takes four to six weeks, covering data integration, decision panel template configuration with your leadership team, and validation against recent real decisions to confirm the combined view reflects what leadership actually needs. Multi-plant deployments generally take six to ten weeks depending on how many separate financial and operational systems are involved.
Book a Demo for a timeline specific to your organization.
The Best Decisions Happen When Leadership Sees the Whole Plant, Not Four Separate Slices of It.
Production, maintenance, energy, and financial data combined into one continuously current executive view — live in as little as four weeks.