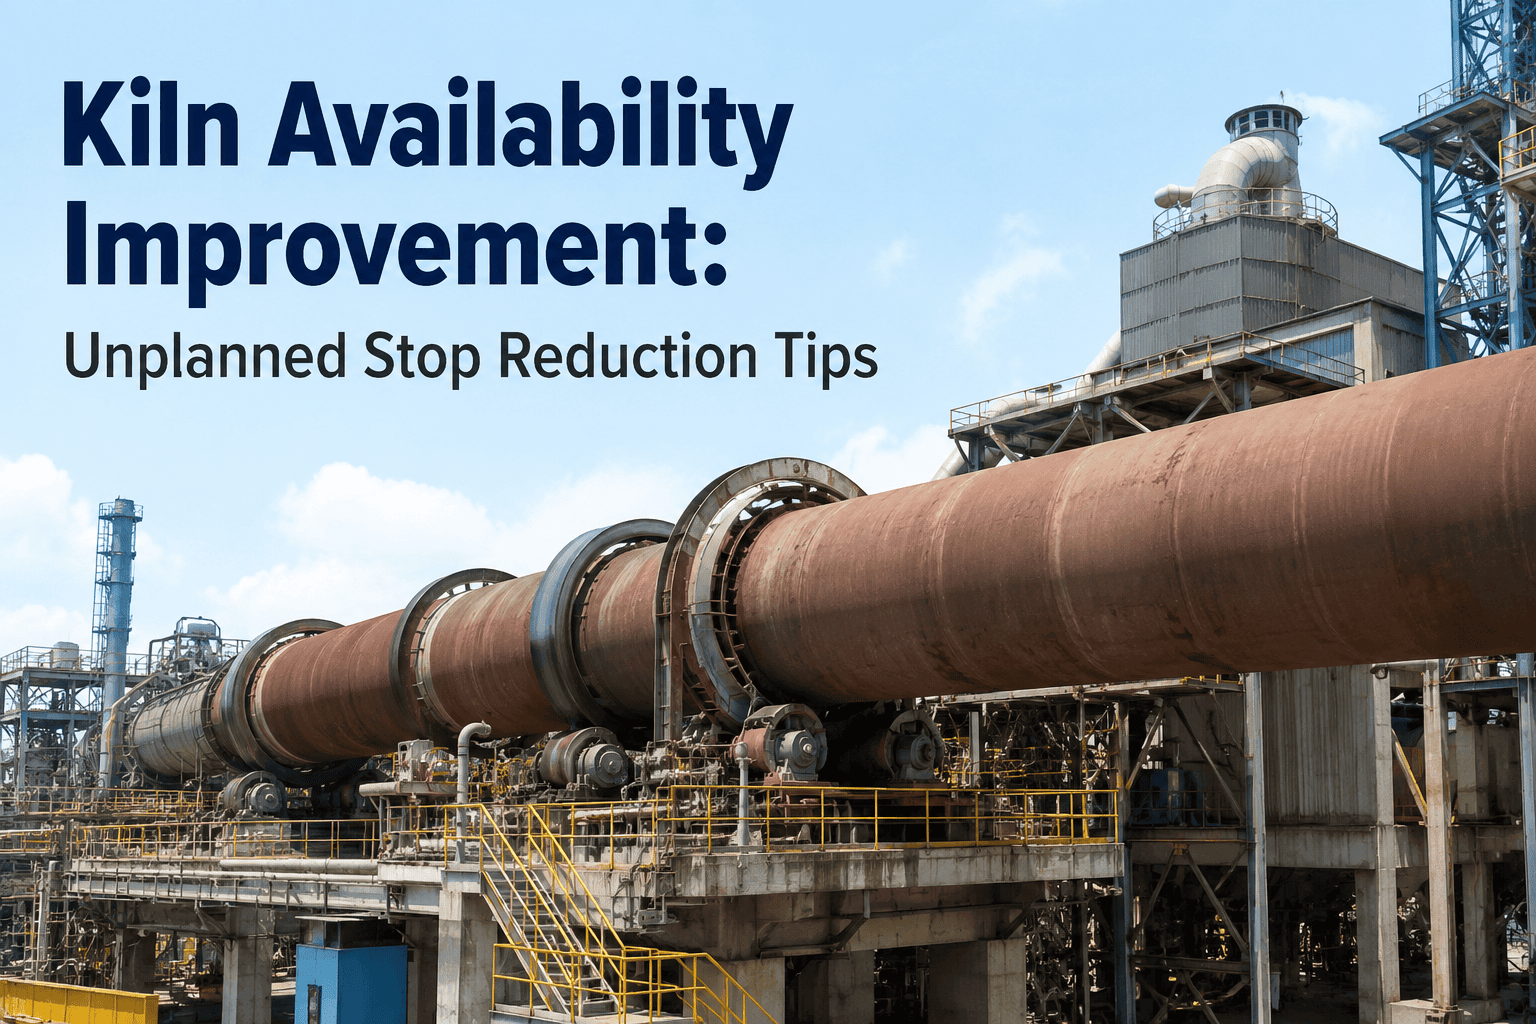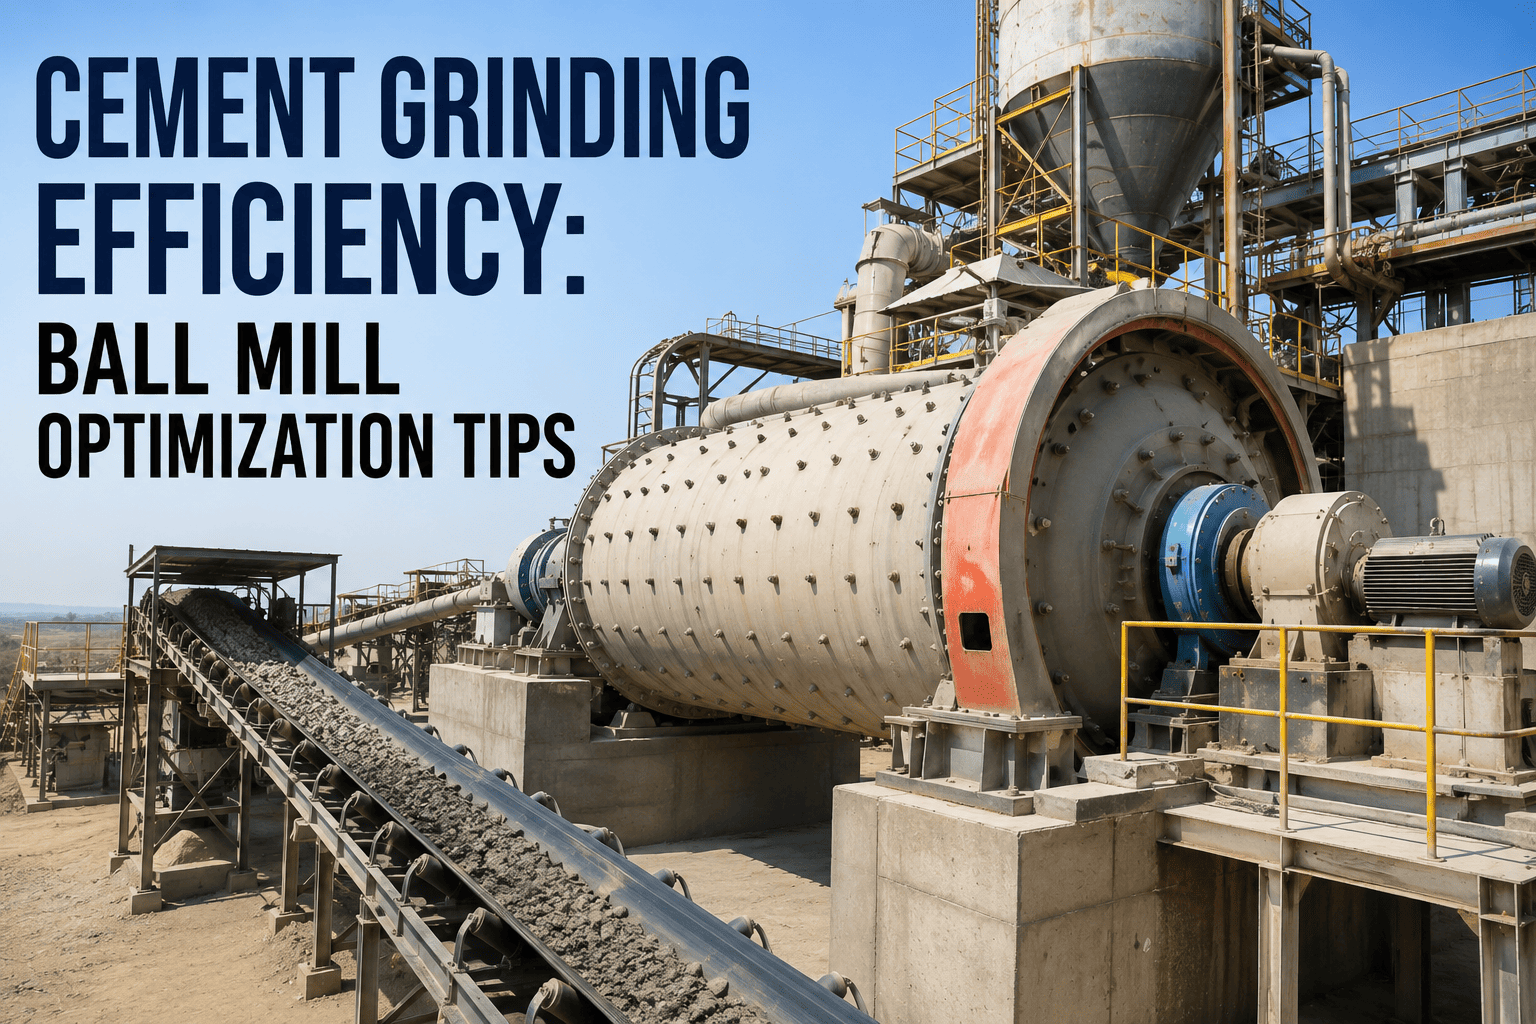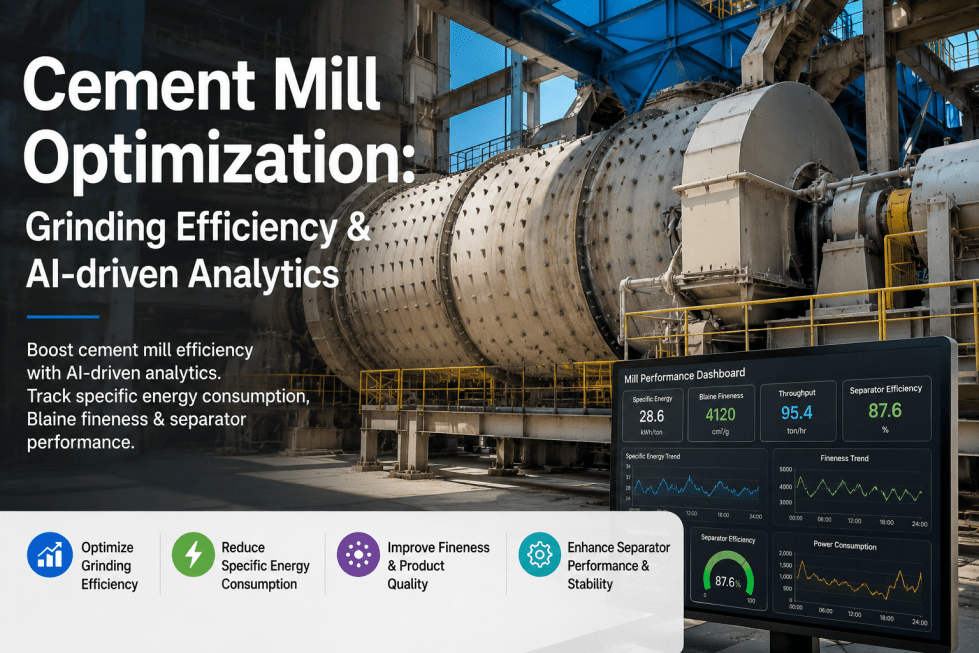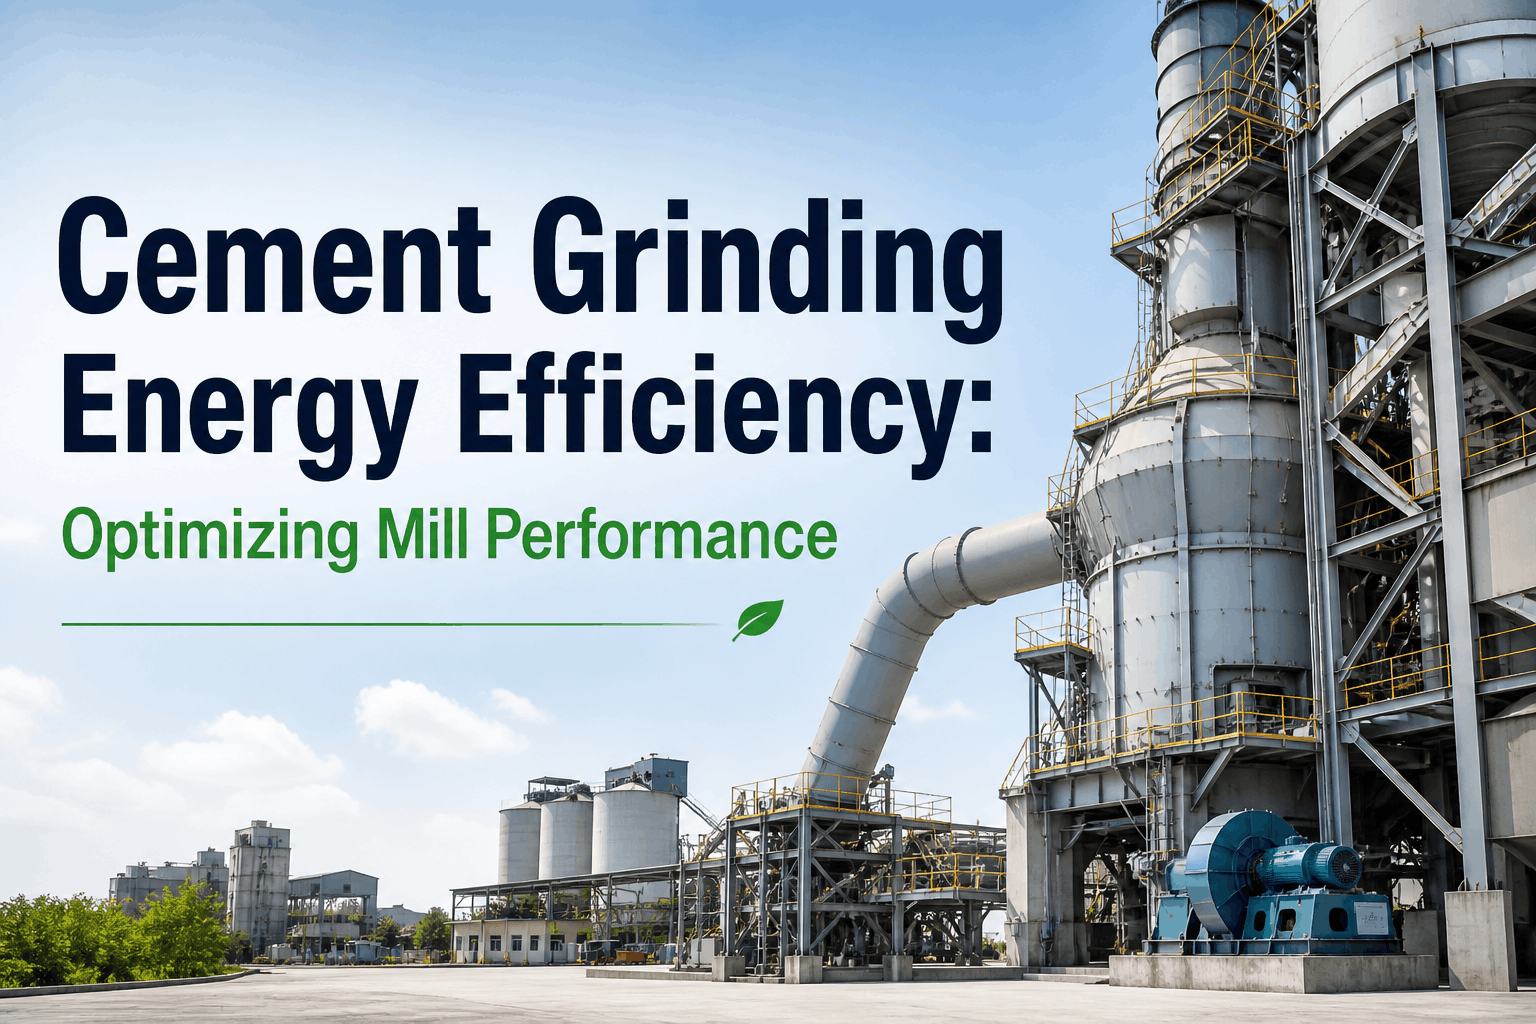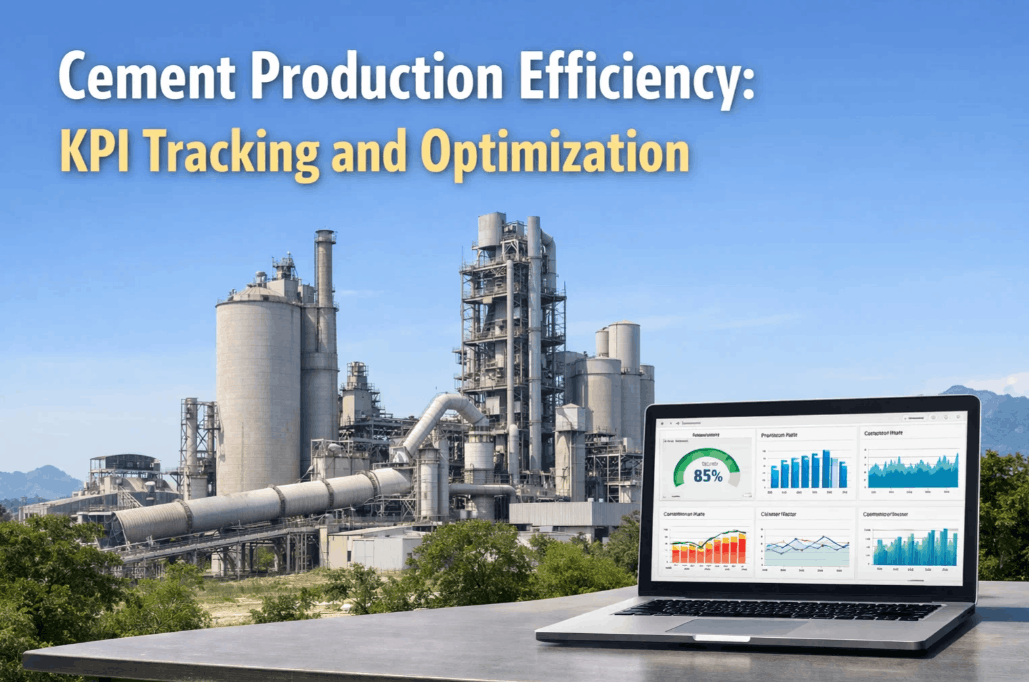
A 6,500 TPD cement plant can look busy on every shift report and still be losing a third of its production capacity to nobody in particular. The kiln shows 90% availability, the mill hits its feed rate, the lab signs off on clinker quality — and yet the combined OEE lands at 74%, eleven points below what the same equipment is capable of. That gap does not live in one department. It hides across the kiln line, the raw mill, the cement mill, and the packing plant simultaneously, and closing it starts with measuring each line the same way — book a demo to see section-level OEE tracking running against your own plant's live data.
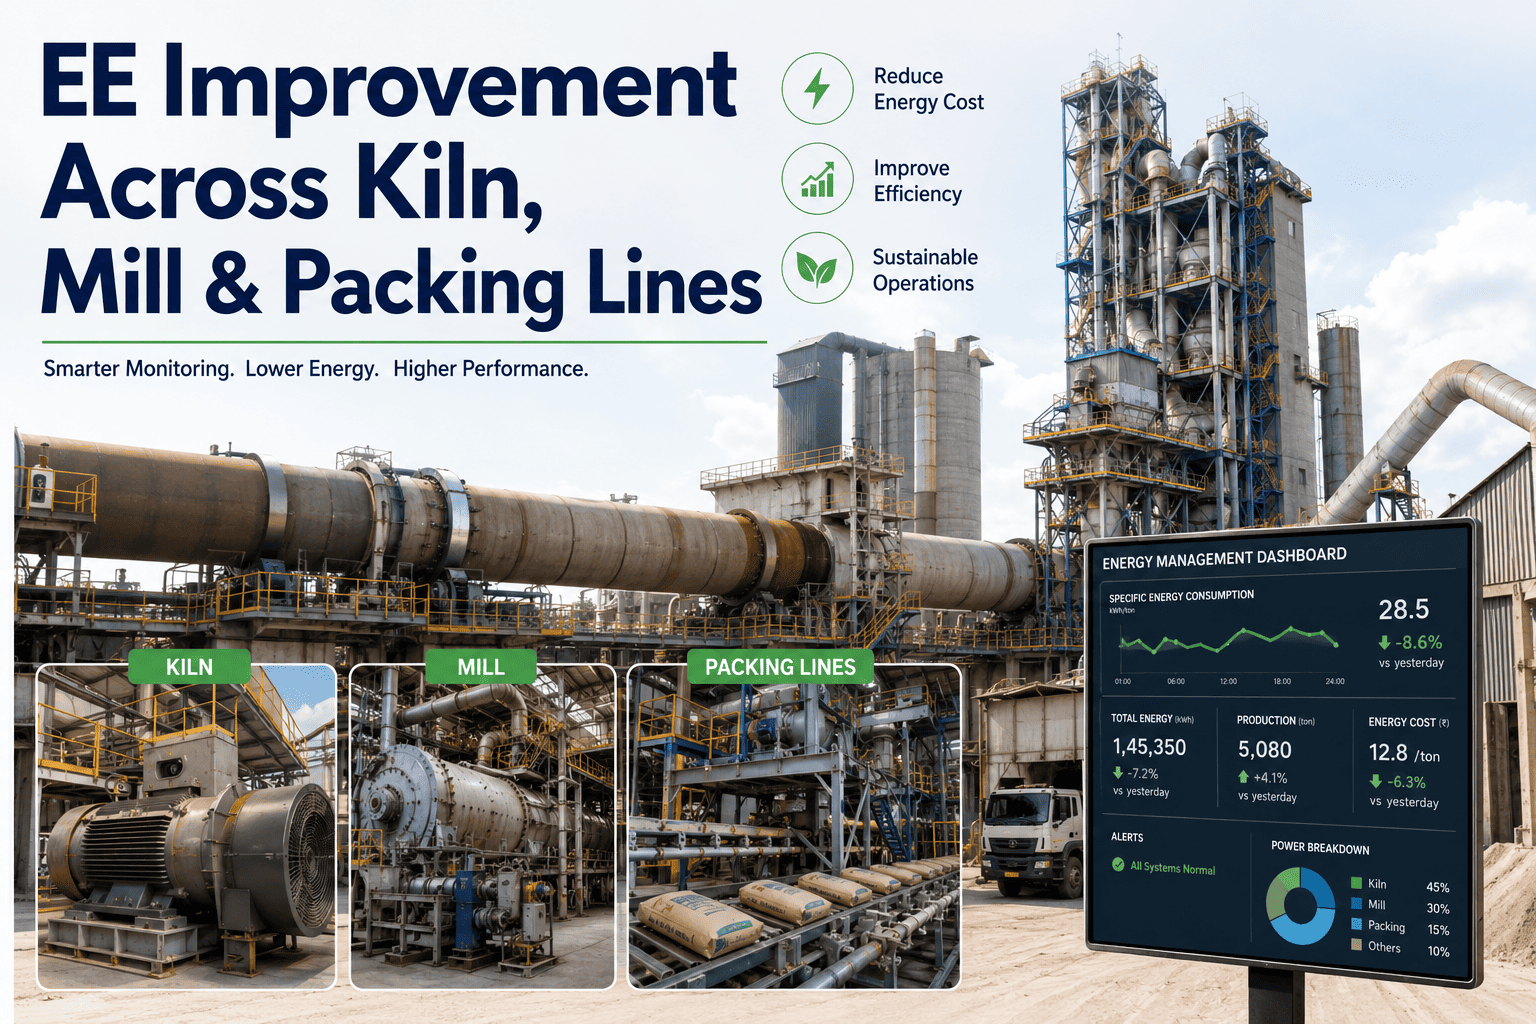
OEE Improvement Across Kiln, Mill & Packing Lines
Improve Overall Equipment Effectiveness across every cement plant production line — kiln, raw mill, cement mill, and packing plant — with availability, performance, and quality strategies built for each stage's actual failure modes.
Where Your Plant Sits Against the World-Class Benchmark
The global benchmark for cement plant OEE is well documented and consistent across independent studies: most plants operate between 65 and 75 percent, while world-class producers sustain 85 percent or higher. That ten-to-twenty-point gap is not a rounding error — on a 5,000 TPD line, it represents four to six million dollars in unrealized annual production capacity sitting inside equipment the plant already owns.
The Three Factors That Multiply Into Your OEE Score
OEE is not a single measurement — it is Availability multiplied by Performance multiplied by Quality, and weakness in any one factor drags the entire score down even when the other two look strong. A kiln can run 90 percent availability and still post a mediocre OEE if performance or quality is quietly leaking value underneath.
Availability
Actual run time against planned production time — the share of the schedule the equipment was physically able to run.
Performance
Actual output speed against design or nameplate rate — how close the line ran to its true capacity while operating.
Quality
Good product produced against total product produced — output that met spec without rework, rejection, or blending.
OEE
The single score that reveals which factor is actually costing the plant the most.
Where OEE Loss Actually Happens Across the Plant
Most debottlenecking effort gets pointed at the kiln because it is the most visible, most expensive asset on site. But research across cement operations consistently shows raw mills and cement mills are just as likely to be the active constraint — and considerably cheaper and faster to fix once identified.
Availability Is the Dominant Lever
Kiln relights, refractory hot spots, and preheater fan trips drive the largest availability losses on this line. A single unplanned stop/start cycle costs far more than the downtime itself — ramp-up alone can take hours before the kiln returns to stable production temperature. Real-time monitoring of inlet temperature, mill motor current, and cooler vibration catches the precursors to a trip before it happens, rather than explaining it after the fact in a monthly report.
Performance Losses Hide in Conservative Settings
Raw mills frequently run below nameplate capacity because operators set conservative feed rates to avoid trips, especially on older equipment or with variable raw material moisture. This performance loss rarely shows up as downtime on a shift report — it shows up as a mill that never registers a stop but also never hits its design throughput, quietly leaking capacity every hour it runs.
Minor Stops Accumulate Into Major Losses
Jams, blockages, and sensor faults that trigger automatic stops each last only seconds to minutes individually — but accumulated across a week, they routinely add up to hours of lost grinding capacity. Because each stop is too brief to trigger a formal downtime investigation, this loss category is the easiest for a plant to systematically underestimate.
Quality Loss Costs Finished Product, Not Raw Material
Bag weight variance and rejection at the packer destroys value at the most expensive possible point in the process — after every prior stage has already consumed energy and capacity to produce that clinker. Packing lines running without tight monitoring commonly lose two to five percent of finished product per shift to weight variance and rejection that a tighter control loop would have caught immediately.
How Much Each Loss Category Actually Costs Your OEE Score
Not every point of lost OEE comes from the same source, and treating them identically leads plants to over-invest in the wrong fix. Here is roughly how the total gap between average and world-class performance typically breaks down across categories.
Startup and Changeover
Kiln relight procedures, mill ramp-ups, and product changeovers create downtime that is often longer than the process strictly requires.
Minor Stops
Short automatic stops from jams, blockages, and sensor faults that accumulate into significant weekly losses across the mill circuits.
Speed Loss
Mills and kilns running below design capacity due to conservative settings, raw material variability, or operator caution.
Quality Deviation
Off-spec clinker requiring rework or blending, consuming grinding capacity and silo space that should be producing sellable product.
Why Spreadsheet OEE Always Arrives Too Late
Every cement plant calculates OEE. Most calculate it in a spreadsheet at shift end, day end, or worse, month end. The calculation itself is correct — the timing is what makes it operationally useless. By the time a report shows yesterday's availability ran at 78 percent, the refractory hot spot that caused the morning trip is already history, and the opportunity to intervene while the loss was still small has passed.
- Calculated once per shift, day, or month after the loss already happened
- Root cause investigated manually, often days after the event
- Kiln, mill, and packing data reviewed in separate disconnected reports
- Intervention happens after the quarter closes, not during the shift
- Availability, performance, and quality recomputed every 30 to 60 seconds
- Loss classified into a root-cause bucket automatically with a confidence score
- Kiln, mill, and packing data unified into a single live plant-wide score
- Work orders trigger the moment a threshold is breached, not after the fact
See Section-Level OEE Tracking Live on Your Plant
iFactory unifies kiln, raw mill, cement mill, and packing line data into a single real-time OEE score with automatic root-cause classification — so your team acts while the loss is still small.
How Leading Producers Close the Gap in 18 Months
Plants that have systematically closed the gap from average to world-class OEE did not do it with a single capital project. Leading producers report gains of ten to fifteen percentage points within eighteen months — equivalent to adding hundreds of tonnes per day of capacity without a single new piece of major equipment.
Establish a Live Baseline
Measure Availability, Performance, and Quality separately and continuously across every line before changing anything — you cannot fix what isn't measured in real time.
Find the Real Constraint
Let the data identify which line is actually limiting throughput rather than assuming it is the kiln by default — raw and cement mills are frequently the cheaper fix.
Attack the Cheapest Losses First
Minor stops and speed losses are typically faster and less capital-intensive to fix than major reliability projects — start there for early, visible wins.
Automate the Response Loop
Connect the live OEE score to maintenance work orders so a threshold breach triggers action automatically, closing the gap between detection and correction.
Frequently Asked Questions About Cement Plant OEE Improvement
Find Your Plant's Real Constraint — Not the Assumed One
Get a live walkthrough of section-level OEE tracking across your kiln, raw mill, cement mill, and packing lines, with automatic root-cause classification built in.