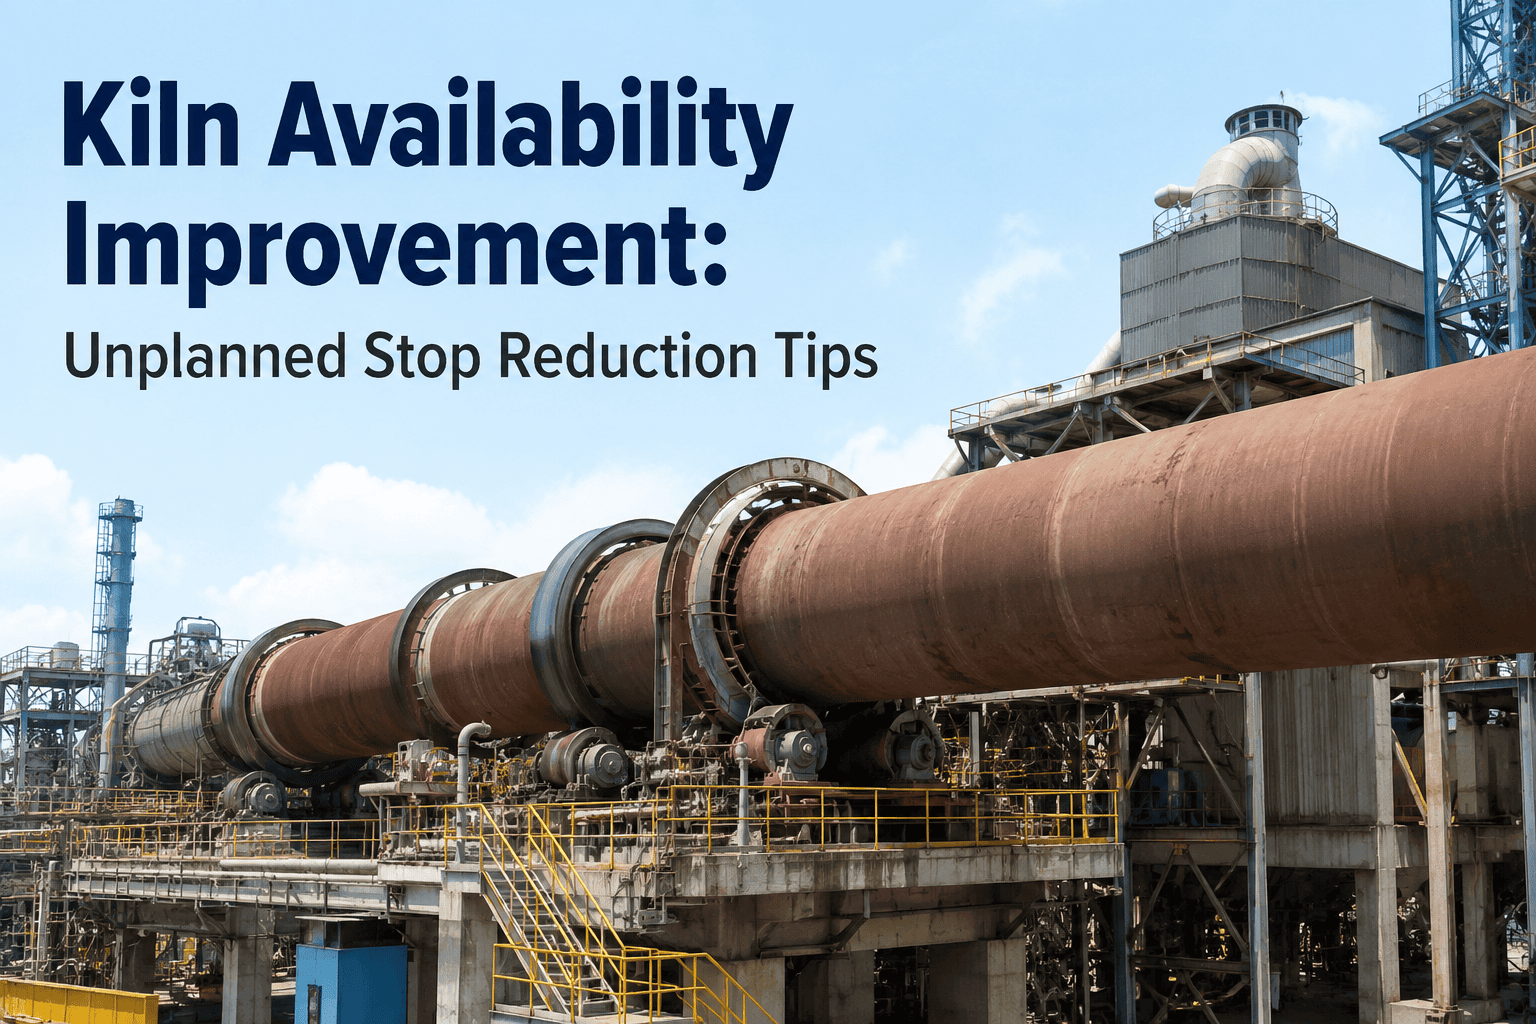
Kiln availability is the single most financially loaded number on a cement plant's KPI board, because every point of it converts almost directly into tonnes of clinker that either got made or didn't. Most integrated dry-process kilns run somewhere between 78% and 88% availability against a modern benchmark of 88 to 93%, and the gap between those two numbers is rarely one dramatic failure. It is usually a long list of smaller unplanned stops on girth gears, tire and roller stations, ID fan bearings, and preheater fan drivelines that never get root-caused before the next one happens. Plants that close that gap don't do it by working harder during a stop, they do it by seeing the stop coming. See how AI-driven monitoring shortens that list at ifactory support.
Stop Losing Kiln Hours to Failures You Could Have Seen Coming
AI that tracks kiln availability continuously, classifies every unplanned stop by root cause, and flags the bearing, gear, and drive faults that quietly erode operating hours weeks before they force a shutdown.
Why Availability Is the KPI With the Biggest Dollar Sign Attached
Availability, performance, and quality all feed into OEE, but availability is the one that moves the needle fastest and the one plant managers get asked about first. A kiln sitting idle produces nothing, burns startup fuel to relight, and drags the whole line's monthly tonnage down regardless of how well the mills or packing lines perform. That is why a one percentage point improvement in availability on a 3,000 tpd kiln is worth roughly 30 additional tonnes of clinker every single day it holds, and why most credible twelve month improvement programs are built to deliver a five to eight point OEE lift with the majority of that gain coming from availability before performance or quality even get touched.
The Systems Behind Most Unplanned Kiln Stops
Unplanned downtime is not evenly distributed across a kiln line. A small handful of rotating and mechanical systems account for the majority of lost hours, which means an availability program that spreads attention evenly across every asset is solving the wrong problem. Ranking the actual share of unplanned hours by system is what turns a generic reliability initiative into a prioritized one.
Together, these five asset groups account for over 40% of unplanned kiln hours in benchmarked plants, which is why a focused predictive maintenance rollout on just these systems, rather than a plant-wide sensor blanket, tends to deliver the fastest visible availability gain.
| Metric | World-Class | Industry Median | What It Tells You |
|---|---|---|---|
| Kiln Availability | 88-93% | 78-88% | Share of scheduled hours the kiln actually ran |
| MTBF (Rotary Kiln System) | 3,000-4,500 hrs | 1,400-2,200 hrs | Average runtime between unplanned stops |
| PM Compliance | 90%+ | ~62% (manual systems) | Whether preventive work is done on time, not just logged |
| OEE (Kiln System) | 85% | 60-75% | Availability × performance × quality combined |
These four metrics matter more when read together than any one of them read alone. A plant can hit a respectable availability number while its MTBF is quietly falling, which usually means the same handful of assets are being repaired just fast enough to hide a worsening failure frequency behind an acceptable headline figure. Tracking MTBF and PM compliance alongside availability is what surfaces that kind of masked deterioration before it turns into a run of consecutive bad months.
Find Out Which Asset Is Actually Costing You the Most Hours
Bring your last twelve months of downtime logs to the call. We will walk through how AI-based classification would rank your unplanned stops by asset and root cause.
From Reactive Firefighting to Predictive Stop Reduction
Most kiln reliability programs stall not because the technology is unavailable, but because the underlying data is too inconsistent to act on. Free-text downtime reasons, inconsistent failure coding, and PM schedules that exist on paper rather than in practice all make it impossible to trust a trend line even when one exists. Closing that gap follows a fairly consistent sequence across plants that have actually done it.
Manual Downtime Tracking vs Continuous AI Monitoring
The difference between a plant that trends toward world-class availability and one that stays stuck in the high seventies usually comes down to how downtime gets detected and acted on, not how many people are assigned to watch for it.
| Factor | Manual / Calendar-Based | Continuous AI Monitoring |
|---|---|---|
| Failure Warning Time | Hours, if any, before a trip | Days to weeks of advance signal |
| Downtime Attribution | Free-text, inconsistent operator notes | Standardized asset and root-cause code every time |
| PM Scheduling | Fixed calendar intervals regardless of condition | Condition-triggered, based on actual asset drift |
| Trend Visibility | Monthly report, reviewed after the fact | Live dashboard, reviewed as patterns emerge |
Neither approach replaces the maintenance team, and continuous monitoring is not a substitute for a competent mechanical crew. What it changes is the lead time a team has to act, converting a bearing seizure caught at 2am into a scheduled swap during the next planned window instead of a scramble that stretches into an eight-hour outage.
A Girth Gear Trend That Almost Got Missed
A mid-size integrated plant running a 4,000 tpd line had logged three girth gear related trips in eighteen months, each one written up as an isolated lubrication issue and closed without a deeper look. After moving to continuous vibration and thermography monitoring on the gear and pinion assembly, the same low-amplitude tooth-mesh signature that had preceded all three prior trips began reappearing on the dashboard, this time nineteen days before it would have escalated into a forced stop. The maintenance team scheduled a lubrication correction and alignment check during a planned four-hour window instead of losing an estimated fourteen hours to an unplanned outage, and the same signature has not recurred since the correction, turning what had been a recurring failure pattern into a closed root cause.
Four Habits That Keep Availability Stuck
Most plants that plateau below the 88-93% benchmark are not short on effort, they are repeating a small set of habits that quietly cap how far reliability work can go, no matter how many hours the maintenance team puts in.
Who Actually Owns Kiln Availability
A ranked list of unplanned stops only turns into recovered hours once specific roles are accountable for acting on it, and that accountability is usually split across a few functions rather than sitting with one person.
Build Your Own Availability Loss Number
Every plant's exposure looks different depending on tonnage, fuel cost, and how reactive the current maintenance model still is, but the inputs that shape the number are the same everywhere.
| Input | Why It Matters |
|---|---|
| Rated kiln capacity (tpd) | Sets the tonnage value of every lost operating hour |
| Current availability vs 88-93% benchmark | The gap defines the realistic recovery opportunity |
| Unplanned hours lost per year | Directly converts into tonnes of clinker not produced |
| Contribution margin per tonne | Turns recovered tonnage into recovered EBITDA |
Run those four inputs against a documented three to five point availability lift and most plants land in seven figures of recoverable annual margin, which is why availability improvement programs tend to pay for the monitoring investment inside the first year rather than requiring a multi-year payback case.
None of this requires ripping out an existing CMMS or asset register. The plants that move fastest tend to layer continuous monitoring on top of whatever system they already use for work orders, feeding it clean, standardized failure data rather than replacing it outright. That layered approach is also what keeps a reliability program credible to a plant manager who has seen previous initiatives stall out after an ambitious rollout tried to change too many systems at once.
Frequently Asked Questions
Get an Availability Breakdown for Your Kiln Line
Bring your current downtime logs and maintenance schedule to the call. We will walk through how AI would classify and rank your unplanned stops, and what a realistic availability recovery plan looks like.