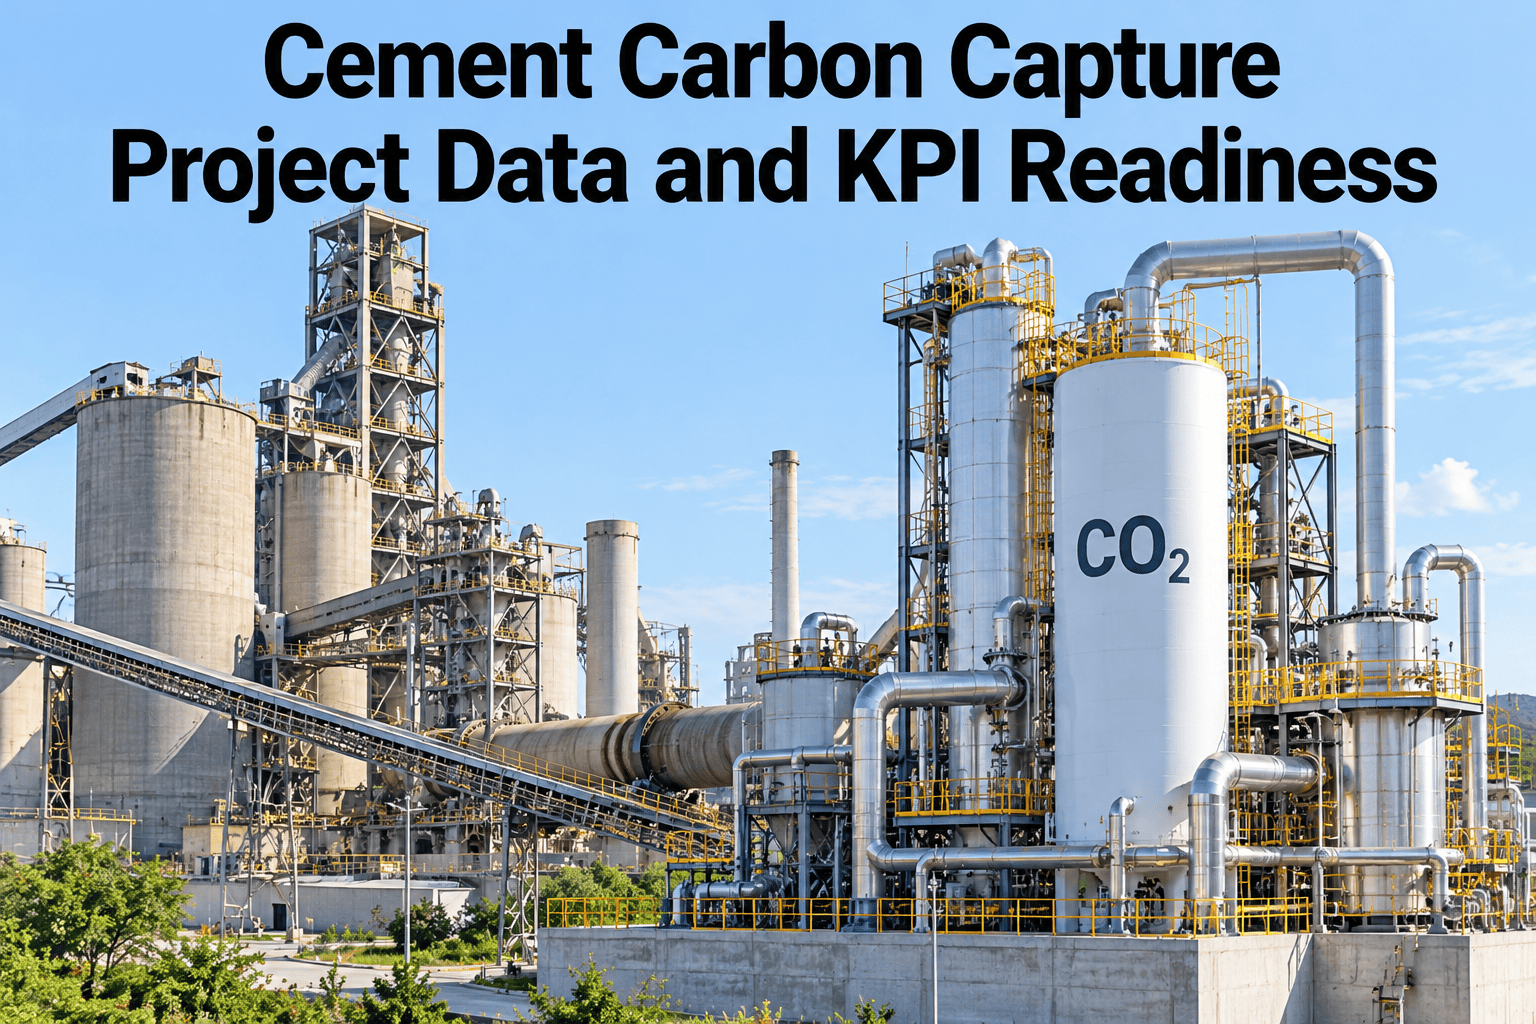
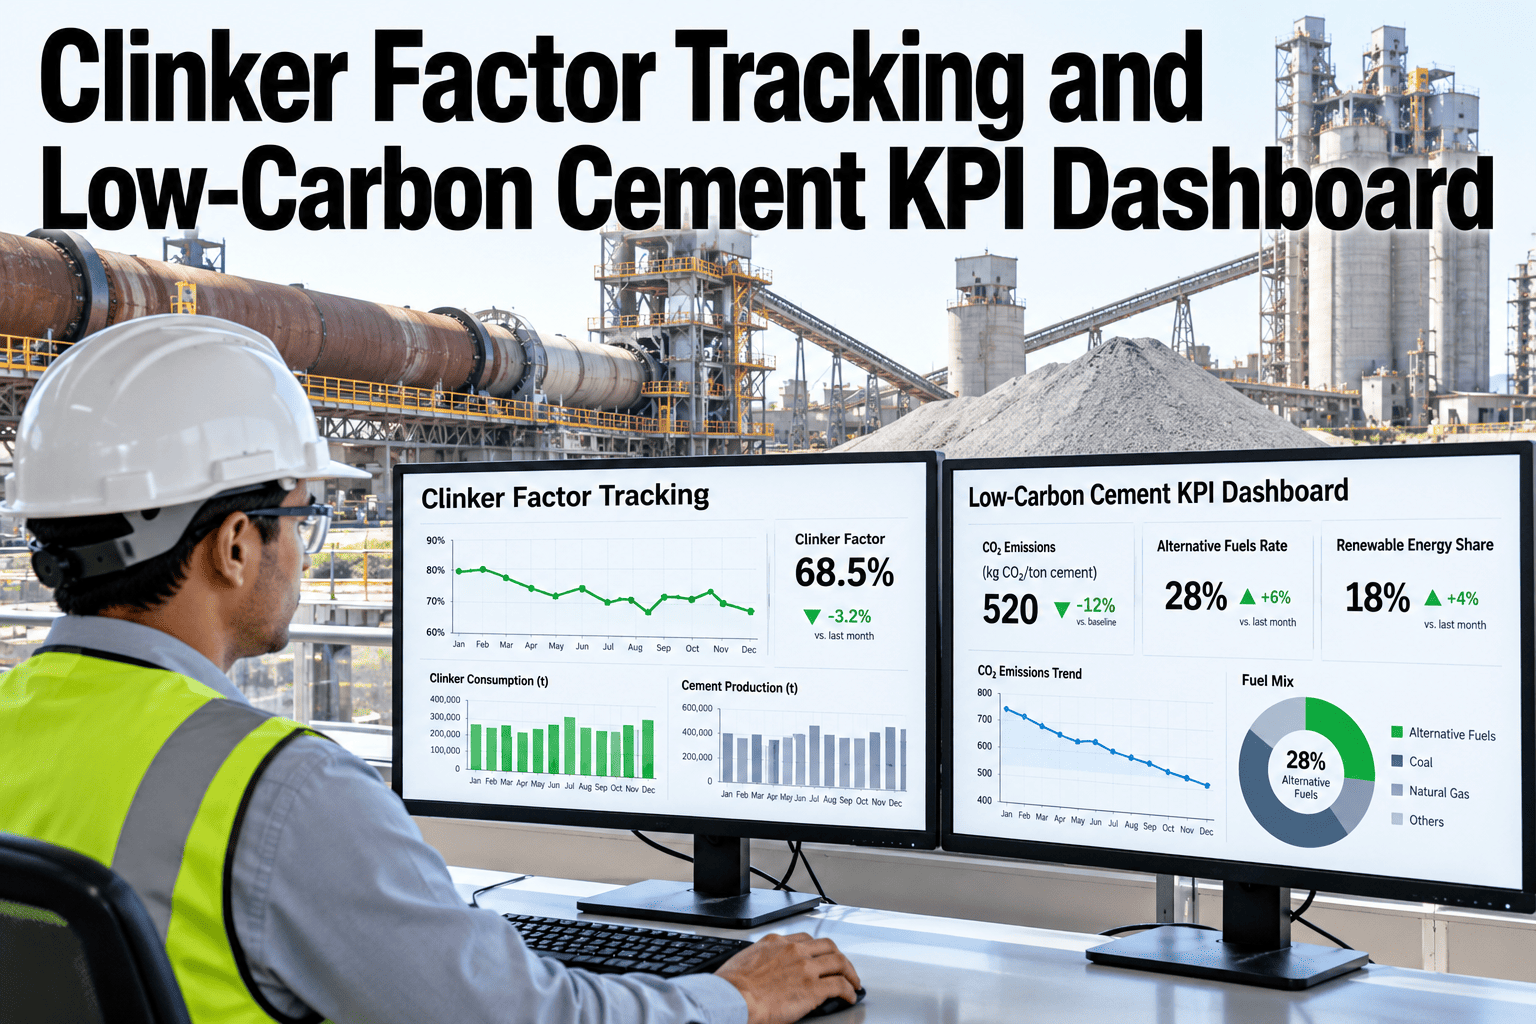
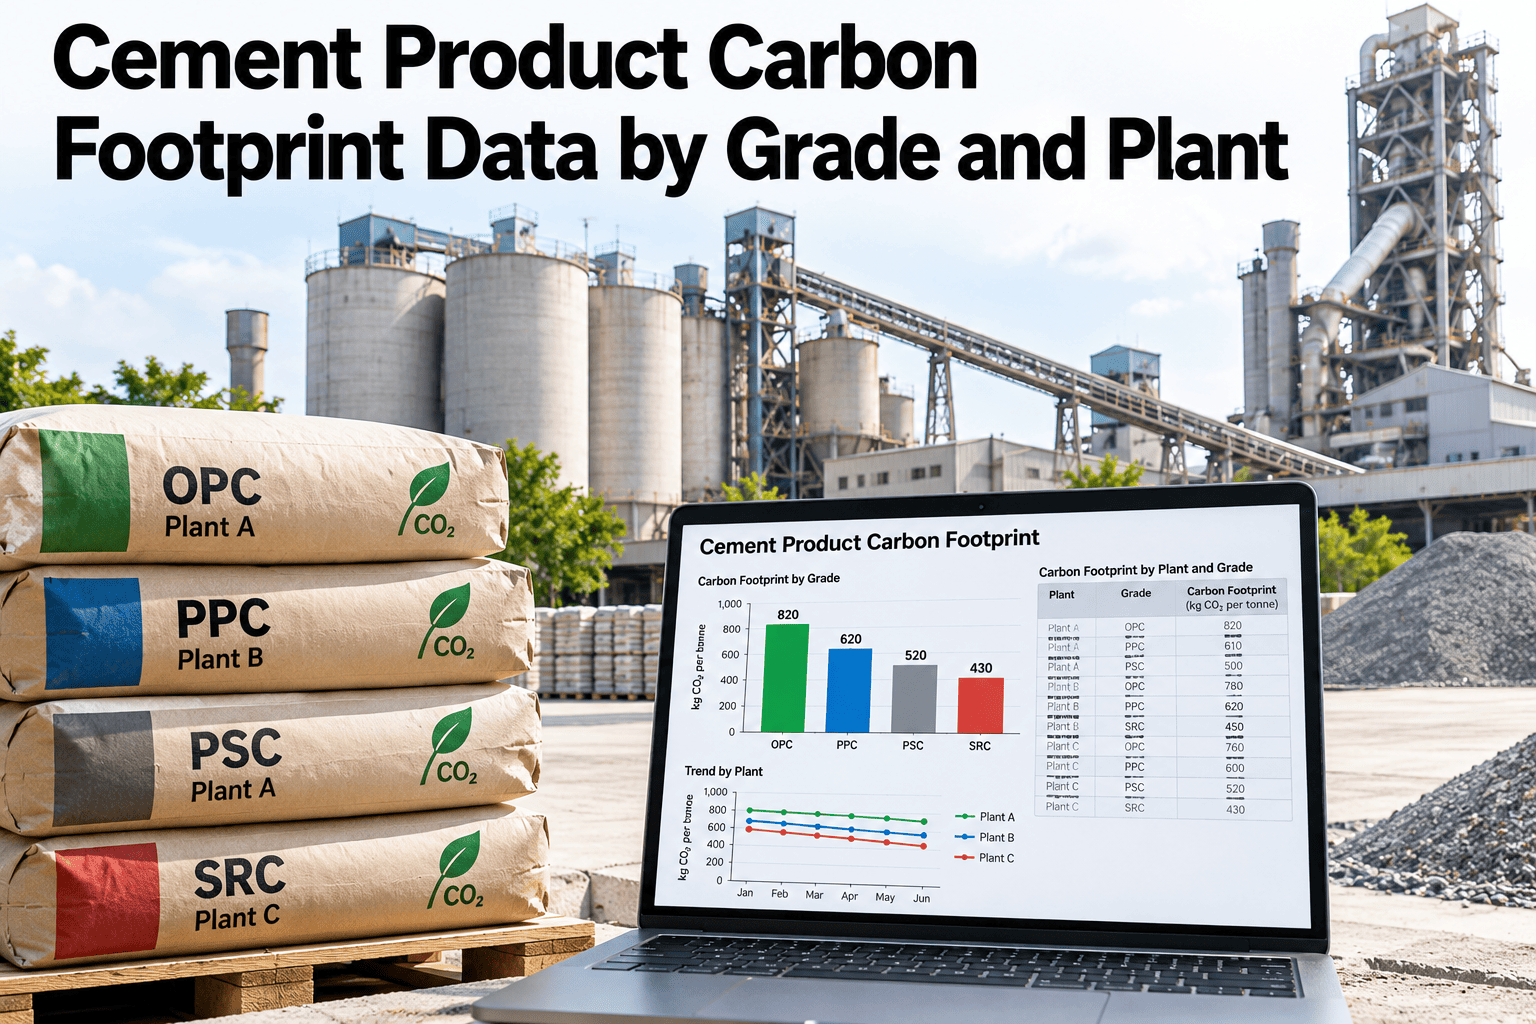
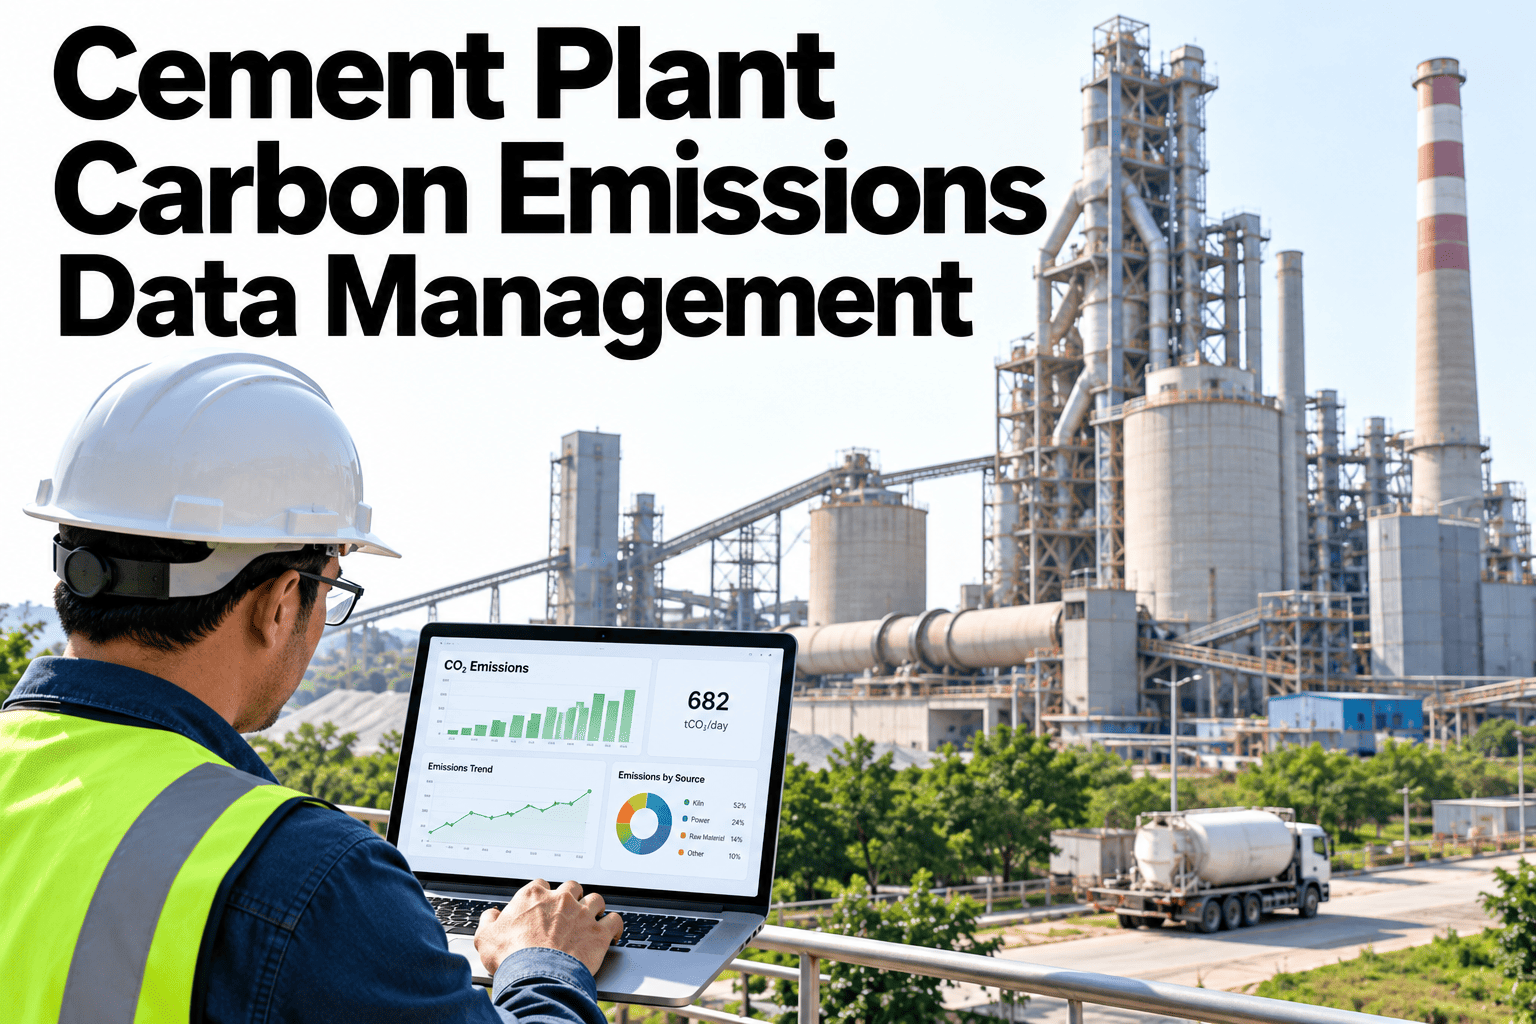
A cement plant rarely runs just one decarbonization project at a time. Alternative fuel trials, waste heat recovery, clinker factor reduction, and a dozen smaller initiatives all compete for the same engineering time and capital, yet most plants track them in separate spreadsheets that nobody compares side by side. A project portfolio view fixes that, showing every initiative's baseline, target, milestone and measured benefit in one place, so leadership can see which projects are actually delivering. Plants ready to see their own portfolio tracked can book a demo with the iFactory AI team.
Cement Plant Decarbonization Project Portfolio Tracking
Track every decarbonization project's register, baseline, milestones and measured benefit in one portfolio view.
Why Separate Spreadsheets Hide the Real Picture
Each project owner tracks their own initiative in their own format, so leadership reviewing the program has to manually stitch together status updates that rarely use the same units or the same reporting period.
A shared portfolio view puts every project on the same page, literally, so comparing progress takes a glance instead of a meeting series.
Project Register and Baseline
Every project in the portfolio needs the same basic fields, so projects can be compared fairly regardless of size or type.
| Field | What It Captures | Why It Matters |
|---|---|---|
| Baseline | Emissions or energy figure before the project started | The reference point every benefit is measured against |
| Target | The expected reduction once complete | Sets the bar for success |
| Owner and status | Who is accountable and where the project stands | Keeps accountability visible, not assumed |
| Measurement method | How the benefit will actually be verified | Prevents a claimed benefit nobody can confirm |
From Milestone to Measured Benefit
Tracking a project through to a confirmed benefit follows a short sequence that keeps claims honest.
See Every Decarbonization Project on One Page
Book a 30-minute walkthrough and see your own project portfolio tracked from baseline to measured benefit.
A Sample Project Summary, Illustrative
The figures below are invented to show the shape of a project summary, not to benchmark your plant.
Common Portfolio Tracking Mistakes
The same gaps repeat across plants building their first shared decarbonization portfolio.
Where the Portfolio Gets Used
Once the portfolio is unified, it feeds conversations well beyond the sustainability team's own reporting.
Plant leadership uses it to decide where to allocate next year's capital. Corporate sustainability pulls confirmed benefits directly into broader decarbonization disclosures, without re-verifying each project from scratch.
Frequently Asked Questions
How many projects can realistically be tracked at once?
There is no practical limit once projects share a standard register format, since the portfolio view scales by adding entries rather than building a new tracking process for each new initiative. Book a demo to see your own project list structured.
What if a project's measured benefit falls short of target?
A shortfall is valuable information, not a failure to hide. It gets logged alongside the original target so future projects can account for the gap between expected and realised performance.
Can this track capital spend alongside emissions benefit?
Yes, cost and benefit can be tracked together, giving a cost-per-tonne-reduced figure that helps prioritise future projects. Ask support how cost tracking fits into the portfolio.
Does this connect to our existing project management tools?
In most cases, yes. iFactory AI can read milestone and status data from existing project tools and join it with measured plant performance data.
Know Which Decarbonization Projects Are Actually Working
iFactory AI tracks every project's baseline, milestones and measured benefit in one portfolio view. Book a walkthrough built around your plant.