Cement manufacturing is one of the most energy-intensive industrial processes on the planet — energy costs routinely account for 35–45% of total production cost, and in an industry where margins compress year over year, the gap between a plant that manages energy reactively and one that models, predicts and optimizes it proactively is measured in millions of dollars annually. Digital twin technology is fundamentally changing what is possible in cement plant energy management: not by adding another monitoring dashboard, but by creating a live, physics-based virtual replica of your facility that allows engineers to simulate setpoint changes, test process adjustments, and predict energy outcomes before committing to them in real production. For Plant Managers, Energy Directors, and Process Engineers navigating rising fuel costs, tightening CO₂ reporting obligations, and ESG investor scrutiny, the digital twin is no longer an R&D curiosity — it is the operational infrastructure that world-class cement producers are deploying right now.
What Is a Digital Twin in a Cement Plant — and Why Does It Matter for Energy?
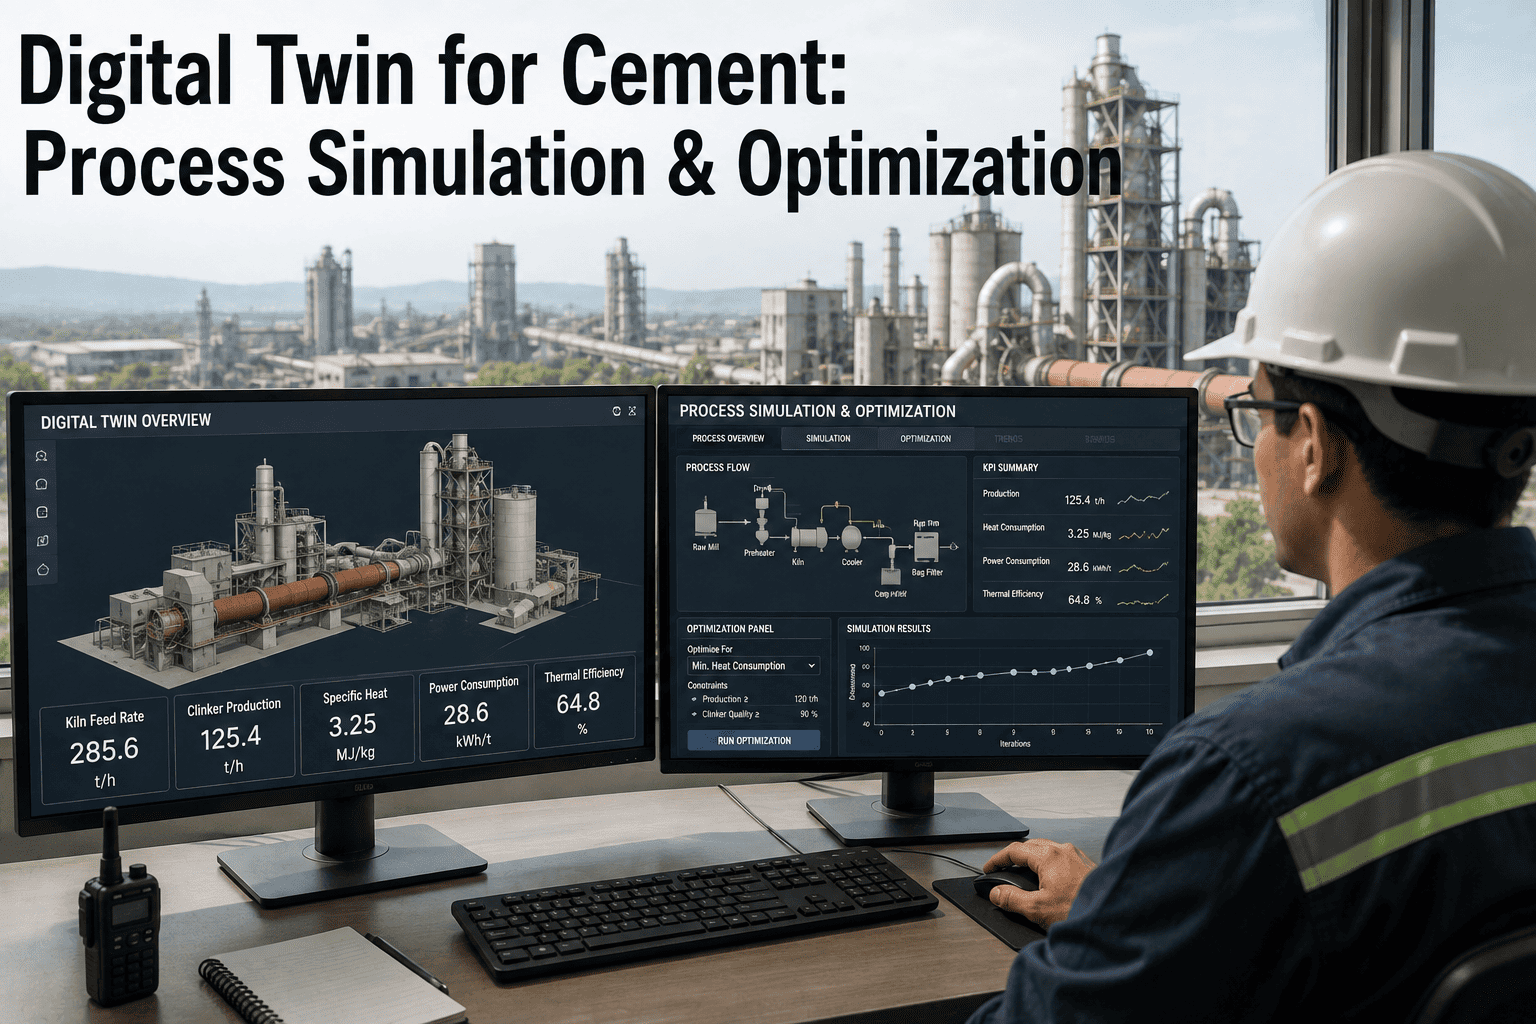
A digital twin is a continuously updated virtual model of a physical asset, process, or facility that mirrors real-world behavior using live sensor data, process parameters, and physics-based or AI-driven simulation logic. In a cement plant context, a digital twin does not simply display what is happening — it understands the causal relationships between process variables well enough to predict what will happen if a setpoint changes, a raw material shifts, or an equipment condition degrades.
For energy management, this distinction is critical. Conventional energy monitoring tells you how much gas, electricity, water, steam, and compressed air your plant consumed last hour. A digital twin tells you how much you would have consumed under an alternative operating scenario — and which of those scenarios delivers the lowest energy cost per tonne of cement while maintaining product specification compliance. Schedule an energy assessment with iFactory to see where your plant's WAGES consumption deviates from its optimized twin baseline.
- Shows historical consumption data after the fact
- Alerts on threshold breaches — reactive only
- No simulation of alternative operating scenarios
- Siloed by equipment area — no facility-wide model
- Cannot attribute energy waste to root process cause
- Manual correlation of energy data to quality/output
- Live virtual model synchronized to physical plant in real time
- Predictive simulation before committing to process changes
- Multi-variable scenario modeling across entire WAGES scope
- Unified facility-wide energy model with causal attribution
- Root-cause energy waste identification by process variable
- Automated CO₂ footprint calculation tied to actual consumption
WAGES Monitoring in Cement: Modeling Every Energy Vector Across Your Facility
WAGES — Water, Air, Gas, Electricity, and Steam — represents the complete spectrum of energy and utility consumption in an integrated cement plant. Each vector carries a different cost profile, a different CO₂ emission factor, and a different set of process levers. A digital twin that models only electrical consumption misses the majority of your energy waste picture. iFactory's cement digital twin platform integrates all five WAGES vectors into a single facility-wide energy model, enabling cross-vector optimization that conventional monitoring cannot approach.
Water — Cooling Circuits, Dust Suppression, and Process Water
Water consumption in cement plants spans cooling tower makeup water for kiln and mill bearing systems, baghouse dust suppression circuits, raw slurry processes in wet-process plants, and concrete mixing water in integrated plants. The digital twin models flow rates, temperature differentials, and cooling efficiency across all circuits simultaneously. Common findings include cooling tower blowdown losses running 15–25% above optimized rates and mill water injection patterns that add more water than fineness control requires — both correctable through twin-guided setpoint adjustment. In a 2 MTPA plant, a 10% water consumption reduction can represent $80,000–$150,000 in annual utility savings depending on your tariff structure.
Air — Compressed Air Systems and Process Air Circuits
Compressed air is one of the most expensive and most wasted utilities in cement manufacturing. Generation efficiency typically runs 7–8 kWh per 1,000 cubic feet, and leak rates of 20–35% are common in facilities without structured leak detection programs. The digital twin models compressed air demand across all consumers — pneumatic conveying, baghouse pulse-jet cleaning, instrument air, and kiln seal air — identifying mismatch between demand profiles and compressor staging. False air infiltration into the kiln system is modeled separately as a primary driver of excess thermal energy consumption, typically adding 30–50 kcal/kg clinker per percentage point of false air above target.
Gas — Kiln Fuel Consumption and Thermal Energy Optimization
Thermal energy — primarily natural gas, coal, petcoke, or alternative fuels — accounts for 60–70% of total energy cost in an integrated cement plant. The digital twin's kiln thermal model is the highest-value component of any cement energy optimization program. It continuously tracks specific heat consumption (kcal/kg clinker), models the impact of raw mix burnability variations on flame temperature requirements, simulates alternative fuel blend ratios and their combustion characteristics, and predicts the energy penalty of kiln coating and ring formation events before they become critical. Plants using iFactory's kiln thermal twin have achieved sustained reductions of 25–55 kcal/kg clinker, representing $400,000–$1.2 million in annual fuel cost savings per 1 MTPA of clinker capacity at current market fuel prices.
Electricity — Grinding, Fans, and Drive Systems
Electrical consumption in cement manufacturing is dominated by grinding (45–55% of plant total), large process fans (15–20%), and material conveying systems (10–15%). The digital twin models electrical load profiles for all major drive systems against production throughput and product specification, identifying overgrinding patterns (the single largest electrical waste source), fan speed optimization opportunities in preheater and separator circuits, and variable-frequency drive utilization gaps. A grinding electrical consumption target of 28 kWh/t cement versus a typical baseline of 36–40 kWh/t represents an 8–12 kWh/t optimization opportunity worth approximately $12–$18 per tonne at U.S. industrial electricity rates — compounding to multi-million dollar savings at scale.
Steam — Waste Heat Recovery and Process Steam Systems
In modern cement plants with waste heat recovery (WHR) systems, steam generation from kiln preheater and clinker cooler exhaust gases can supply 15–30% of plant electrical demand. The digital twin models WHR steam generation efficiency against kiln operating parameters, identifying correlation between kiln exit gas temperature, boiler fouling rates, and steam turbine output. For plants without WHR, the twin models process steam usage in raw material drying, slurry heating, and fuel preparation, quantifying the cost of steam generation inefficiencies. WHR system optimization guided by digital twin analysis typically recovers 8–15% of lost generation capacity — measurable immediately in reduced power purchase costs.
Virtual Setpoint Simulation: Test Before You Touch the Process
The most operationally transformative capability of a cement digital twin is not monitoring — it is simulation. The ability to test a proposed process change, a setpoint adjustment, or an alternative operating strategy in the virtual twin before implementing it in the physical plant eliminates the trial-and-error waste that has historically accompanied process optimization in cement manufacturing. Book a product demo to see iFactory's simulation environment applied to your specific plant configuration and optimization targets.
Define the Optimization Objective
Specify the target — reduce specific heat consumption by 20 kcal/kg, increase mill throughput by 5% without exceeding Blaine specification, reduce compressed air consumption during night-shift low-demand periods. The digital twin requires a precise objective to generate meaningful scenario comparisons rather than general sensitivity analyses.
Generate Scenario Variants in the Twin
The iFactory digital twin generates 5–20 scenario variants by adjusting the relevant control variables — kiln feed rate, burner primary air split, separator speed, mill water injection, fan damper positions — within safe operating bounds. Each variant is run against the current raw material chemistry, equipment condition data, and ambient conditions to produce realistic predicted outcomes rather than idealized laboratory calculations.
Evaluate Multi-Dimensional Outcomes
Each simulated scenario produces a full outcome profile: predicted energy consumption by vector, estimated product quality parameters (Blaine, strength class probability, setting time), equipment stress indicators, and CO₂ emission impact. The twin surfaces trade-offs that are invisible in single-variable analysis — for example, a kiln feed rate increase that reduces specific heat consumption per tonne but increases clinker cooler fan electrical load, with a net energy cost impact that may be positive or negative depending on your fuel-versus-electricity cost ratio.
Select and Implement the Optimal Scenario
The process engineer selects the highest-value scenario from the simulation output, with full visibility into predicted outcomes and confidence intervals before a single real-world setpoint is changed. Implementation is guided by the twin's recommended transition sequence to minimize process disruption. Post-implementation, actual performance data feeds back into the twin to validate prediction accuracy and refine the model for the next optimization cycle.
Continuous Model Refinement and Re-Optimization
The digital twin is not a static model configured once at commissioning. iFactory's continuous learning architecture updates model parameters as new production data accumulates, improving prediction accuracy over time and adapting to changes in raw material characteristics, equipment wear states, and seasonal operating conditions. Each optimization cycle produces a more accurate twin and a smaller gap between predicted and actual energy performance — compounding savings year over year.
CO₂ Footprint Tracking and ESG Reporting: From Compliance to Competitive Advantage
Cement manufacturing accounts for approximately 7–8% of global CO₂ emissions, making it one of the most scrutinized sectors in ESG investor frameworks, regulatory carbon pricing schemes, and customer supply chain sustainability requirements. Accurate, verifiable, real-time CO₂ footprint tracking is no longer a reporting exercise — it is a prerequisite for maintaining access to capital, qualifying for green procurement programs, and defending market position as low-carbon cement premiums emerge in North American and European markets.
iFactory's digital twin calculates CO₂ emissions continuously at the process level — not just from monthly fuel consumption summaries — by integrating actual fuel consumption rates, fuel blend chemistry, alternative fuel substitution ratios, electricity consumption with grid emission factors, and process CO₂ from limestone calcination. This granularity enables your sustainability team to identify which specific process conditions are driving CO₂ intensity above target and to model the CO₂ impact of proposed process changes before implementation.
| CO₂ Emission Source | Typical % of Total | Digital Twin Tracking Method | Optimization Lever |
|---|---|---|---|
| Process CO₂ (calcination) | ~60% | Clinker production × stoichiometric factor, adjusted for raw mix CaCO₃ content | Clinker-to-cement ratio reduction, SCM substitution |
| Fuel combustion (kiln) | ~30% | Actual fuel consumption × fuel-specific emission factors, updated per fuel blend | Heat consumption reduction, alternative fuel substitution |
| Electricity (indirect) | ~8% | Measured kWh × grid emission factor (location and time-of-day adjusted) | Grinding efficiency, load shifting, WHR generation |
| Transport and ancillary | ~2% | Fleet fuel consumption data integrated from dispatch systems | Dispatch route optimization, fleet electrification |
iFactory's digital twin generates audit-ready CO₂ intensity reports (tCO₂/t cement and tCO₂/t clinker) at any time granularity — shift, daily, monthly, annual — fully aligned with GHG Protocol Scope 1, Scope 2, and Scope 3 accounting frameworks. Reports export directly to the formats required by CDP, GRI, and TCFD disclosure frameworks, eliminating the manual data compilation that currently consumes significant finance and sustainability team time in most cement organizations. For plants participating in cap-and-trade programs or subject to carbon border adjustment mechanisms, iFactory provides the verified emissions data that regulators and auditors require.
Digital Twin Implementation: What the Deployment Process Actually Looks Like
The most common concern from Plant Managers considering digital twin implementation is integration complexity — the assumption that connecting a virtual model to a real cement plant's heterogeneous control infrastructure will require months of custom engineering work and production disruptions. iFactory's deployment architecture is designed specifically to eliminate this concern for cement facilities.
Data Source Inventory and Integration Scoping
iFactory's implementation team conducts a complete audit of available data sources: PLC/DCS tags, SCADA historians, online analyzers, manual lab entry systems, and utility metering infrastructure. Integration protocols are confirmed (OPC-UA, Modbus TCP, MQTT, REST API) and a prioritized data onboarding plan is produced. No production system modification is required — iFactory reads data only, making no write-back changes to control systems during this phase.
Data Integration and Baseline Model Construction
Live data connections are established to all prioritized sources. The digital twin's baseline energy model is constructed using 6–12 months of historical production data combined with live process feeds, creating the initial virtual replica of your facility's energy behavior. WAGES consumption baselines are established for each major process area — raw mill, kiln, clinker cooler, cement mill, and packing — with statistical confidence intervals that define normal operating ranges for the twin's anomaly detection.
Model Validation and First Simulation Runs
The twin's prediction accuracy is validated against recent production periods not used in model training. Prediction error targets are less than 3% for specific heat consumption and less than 2% for electrical consumption per equipment area. Initial simulation runs are conducted collaboratively with your process engineering team on 2–3 high-priority optimization targets identified during the waste audit phase, producing the first quantified energy saving opportunities with confidence-weighted financial impact estimates.
Live Optimization and CO₂ Dashboard Activation
The full WAGES dashboard and CO₂ footprint tracking module go live. Process engineers begin using the simulation environment for routine optimization decisions. First measurable energy savings from twin-guided setpoint changes are typically documented within this phase. ESG reporting templates are configured to your disclosure framework requirements. Training for plant management, process engineers, and quality teams is completed over 3 structured sessions with iFactory's application specialists.
Continuous Improvement and Model Evolution
The digital twin enters its operational maturity phase — continuously learning from production data, expanding its optimization scope to additional process areas, and delivering quarterly performance benchmarking reports that quantify cumulative energy savings against the pre-twin baseline. Most cement plants using iFactory's digital twin reach full investment payback within 8–14 months of deployment, with year-two energy savings typically exceeding year-one as the twin's prediction accuracy improves and the scope of optimization expands.
Expert Review: Digital Twin Maturity in the Cement Industry
The practical value of a digital twin in cement energy management is not in the sophistication of the model — it is in the speed and confidence it gives process engineers to make optimization decisions during the shift rather than in the next week's management meeting. The plants that have seen the most dramatic energy improvements from digital twin deployment are not those with the most advanced AI — they are those where the twin gave a real process engineer real data in real time and trusted them to act on it. The critical implementation factor is model fidelity at the kiln: a twin that accurately models kiln thermal behavior under varying raw mix burnability is worth ten times more for energy management than a sophisticated electrical consumption tracker. False air modeling and its thermal energy impact is consistently the first high-value finding in any cement digital twin deployment. The second is overgrinding — the twin makes visible, quantified, and attributable what every process engineer already suspects but cannot prove without the data. The payback case for digital twin energy optimization in cement is not marginal. At $4.50–$6.00 per million BTU for natural gas and $0.07–$0.12 per kWh for industrial electricity, a 1 MTPA clinker plant saving 30 kcal/kg heat and 3 kWh/t electricity is recovering $1.5–$2.5 million annually. The implementation investment is recovered in the first year and the savings compound as the model matures.
Conclusion: The Digital Twin Is the Energy Management Infrastructure Cement Plants Cannot Afford to Defer
Energy cost is the largest controllable cost in cement manufacturing. The difference between a plant consuming 750 kcal/kg clinker and one consuming 800 kcal/kg is not a matter of equipment age or raw material quality alone — it is a matter of operating intelligence. Digital twin technology gives cement plant operators the operating intelligence to close that gap systematically, predictably, and verifiably. WAGES monitoring across all five energy vectors, virtual setpoint simulation that eliminates trial-and-error optimization, and audit-ready CO₂ footprint tracking that satisfies both ESG investors and carbon regulators — these are not future capabilities. They are deployable in your plant within 16 weeks.
The cement producers who deploy digital twin energy infrastructure in 2025–2026 will enter the next decade with structural cost advantages, ESG credibility, and process optimization capabilities that cannot be replicated by competitors still managing energy from weekly consumption reports. The investment case is clear. The technology is proven. The question is whether your plant captures this margin before or after the competition does. Schedule a no-obligation energy assessment with iFactory to quantify your plant's digital twin opportunity.
Frequently Asked Questions: Digital Twin for Cement Plant Energy Optimization
A standard energy management system (EMS) records and reports what your plant has consumed. A digital twin does something fundamentally different: it builds a continuously updated virtual model of your plant's physical processes that can predict what will happen under alternative operating conditions before you implement any change in the real plant. In cement specifically, this means simulating a kiln setpoint change and receiving a predicted specific heat consumption outcome, quality impact estimate, and CO₂ footprint change — all before touching a control dial. This simulation capability is the core value that no monitoring system, however sophisticated its dashboards, can replicate.
For a 1–2 MTPA integrated cement plant, documented WAGES savings from digital twin-guided optimization typically include specific heat reductions of 25–55 kcal/kg clinker (fuel savings of $500,000–$1.5 million annually), electrical consumption reductions of 3–8 kWh/t cement (savings of $400,000–$900,000 annually at U.S. industrial tariffs), compressed air waste reduction of 15–25% (savings of $50,000–$150,000 annually), and water consumption reductions of 8–15%. Combined, a mid-sized plant with a well-implemented digital twin program is targeting $1.2–$3 million in annual WAGES cost savings — with the thermal energy (gas/coal/petcoke) component typically representing 60–70% of total recoverable savings.
iFactory's CO₂ module handles alternative fuel (AF) substitution by assigning individual emission factors to each fuel type in the blend — including zero-emission factors for biomass-derived AF fractions per GHG Protocol and IPCC methodology. As AF substitution rates change during production, the CO₂ calculation updates in real time against actual consumption data, not estimated blend targets. This means your reported Scope 1 emissions accurately reflect the biomass credit benefit of AF substitution. The system also models the thermal energy trade-offs of different AF blends (calorific value variability, burnability impacts on specific heat consumption) so engineers can optimize AF substitution rate for both CO₂ reduction and heat efficiency simultaneously.
No. iFactory integrates with Siemens S7/WinCC, ABB System 800xA, Rockwell FactoryTalk, Honeywell Experion, and other major cement plant control platforms through read-only connections using standard industrial protocols — OPC-UA, Modbus TCP, MQTT, and REST APIs. No modification to existing PLC or DCS logic is required, and iFactory does not write back to control systems unless your team explicitly configures closed-loop optimization recommendations for specific parameters. This architecture protects your control system integrity and makes cybersecurity review straightforward. Most cement plant IT and OT teams complete security approval within 2–3 weeks of initial architecture review.
iFactory's digital twin uses a continuous learning architecture that updates model parameters automatically as new production data is collected. Raw material chemistry data from your online analyzers and LIMS feeds directly into the twin's raw mix burnability model, adjusting thermal energy predictions as limestone CaCO₃ content, silica modulus, and iron content shift across quarry zones. Equipment condition data from vibration sensors, motor current signatures, and maintenance records updates the twin's efficiency models for mills, fans, and kiln mechanical components — ensuring that grinding energy predictions reflect current liner condition rather than nameplate design assumptions. Seasonal variation (ambient temperature effects on cooling efficiency, moisture effects on raw material grindability) is modeled through continuous recalibration against actual observed performance, not static seasonal correction factors.