Cement plants that jump straight from reactive maintenance into a full plant-wide predictive maintenance rollout almost always end up with an expensive dashboard nobody uses and a maintenance team that quietly returns to the same failure-and-fix rhythm they had before. The plants that actually make the transition treat it as a maturity journey with distinct phases — reactive to preventive, preventive to condition-based, condition-based to predictive — where each phase builds the data, the culture, and the technology foundation the next phase depends on. Skipping phases is why most PdM programs stall; sequencing them properly is why some plants reduce unplanned downtime by half within eighteen months while others spend three years and still ship every kiln outage as an emergency. iFactory's deployment engineering team helps cement reliability leaders map the phased roadmap against their specific plant reality.
Cement · Predictive Maintenance Roadmap
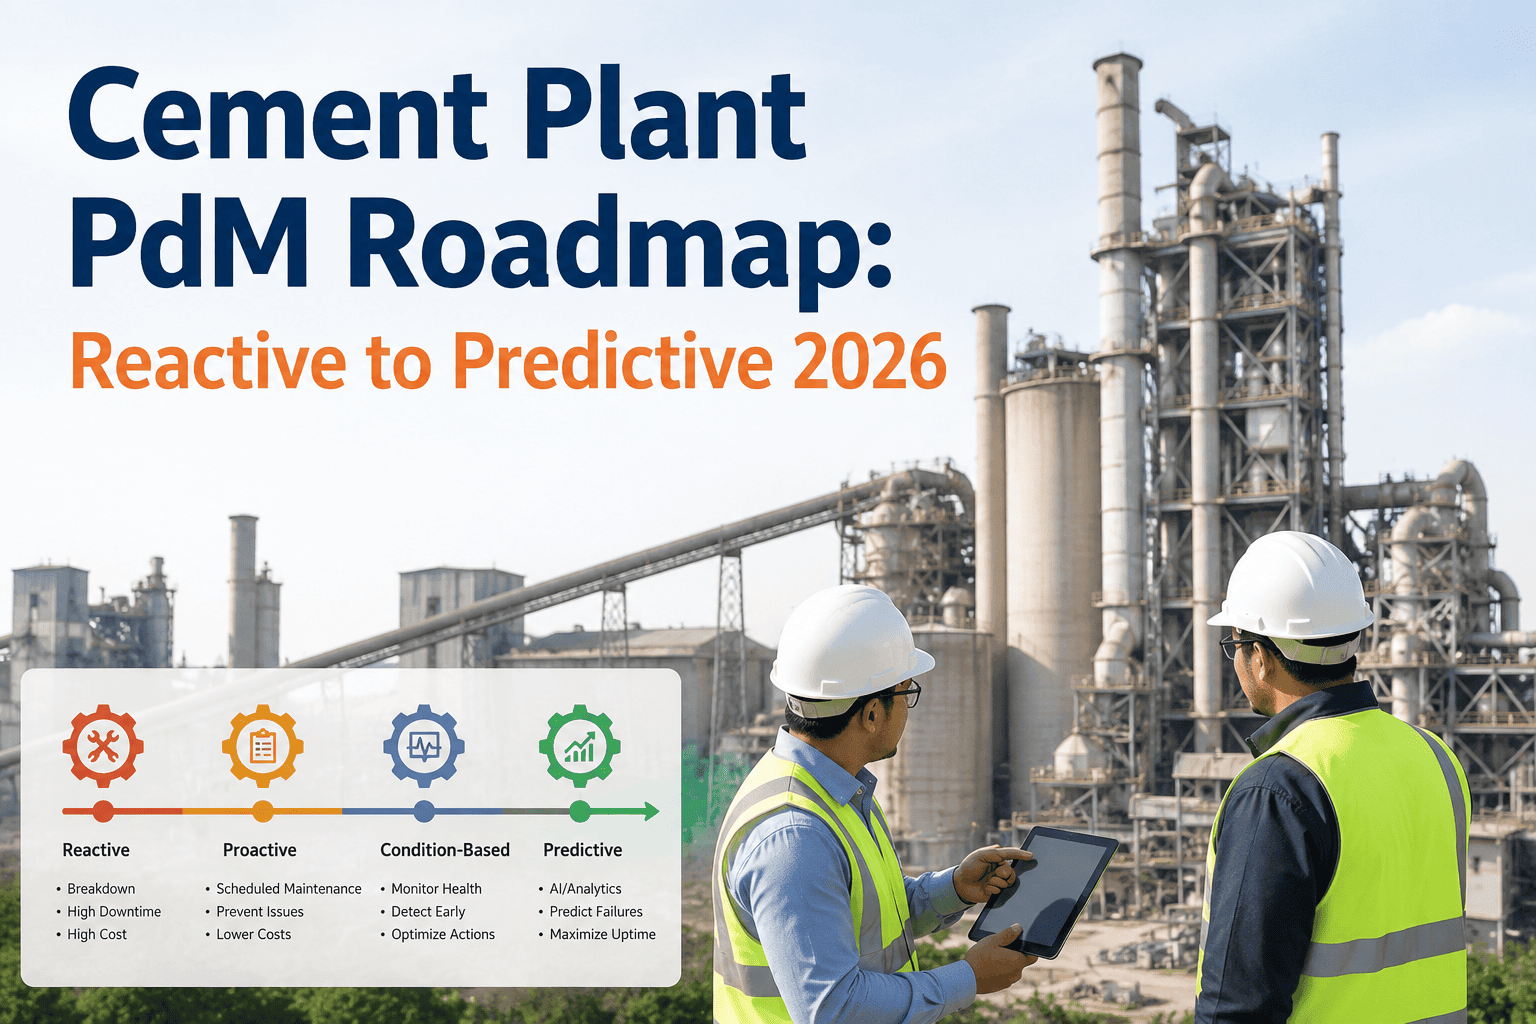
Cement Plant PdM Roadmap: From Reactive to Predictive
A predictive maintenance transformation isn't a technology purchase — it's a maturity journey. Reactive to preventive, preventive to condition-based, condition-based to predictive. Each phase requires specific data, specific technology, and specific cultural shifts. Skipping any of them is why most cement PdM programs stall before they show measurable results.
The Maturity Journey
Reactive
↓
Preventive
↓
Condition-Based
↓
Predictive
Why Cement Is Different
The Cement Plant Reality That Shapes Every PdM Roadmap
Cement production imposes constraints that generic PdM playbooks rarely account for. A rotary kiln runs continuously for months between planned shutdowns, and an unplanned trip is a multi-day, multi-million-dollar event that ripples through the entire production schedule. Raw mills, cement mills, and preheater cyclones operate in conditions of heat, dust, and abrasion that punish sensors, chew through bearings, and complicate the data collection that predictive strategies depend on. The workforce is often deeply experienced but has spent careers refining a reactive maintenance rhythm that the plant is organized around — and that reactive rhythm is what any PdM program has to displace, not just supplement.
These constraints matter because they determine which assets belong in phase one, what data infrastructure has to exist before advanced analytics can add value, and how the maintenance culture has to shift for predictive insights to actually change what people do. A cement PdM roadmap built without accounting for kiln criticality, dust environment sensor challenges, and entrenched reactive culture produces a technology stack that works in theory and gets ignored in practice. The roadmap that actually works starts from cement plant reality first and reverse-engineers the technology and process changes from there.
The third factor is capital rhythm. Cement plants operate on major maintenance cycles that align with planned shutdowns — the kiln outage, the mill overhaul, the preheater inspection window. PdM investments that fit into this rhythm get funded and implemented; investments that require asynchronous access to critical assets often stall for months waiting for the next shutdown window. A workable roadmap sequences technology deployment against the maintenance calendar, not against a generic quarter-by-quarter project plan.
The Four Maturity Phases
The Full Journey From Break-and-Fix to Prediction
Every cement plant sits somewhere on the maturity curve, and honestly identifying which phase the plant is actually in — not which one the leadership deck says it's in — is the first step of any roadmap conversation. Skipping phases produces failed programs. Building each phase on the foundation of the previous one produces the compounding returns that make PdM transformation worth the investment.
Phase 1
Reactive Maintenance
Run to failure, fix on breakdown
Assets are operated until they fail, then repaired. Maintenance planning is dominated by emergencies, spare parts inventory is high, and unplanned downtime is the largest single reliability cost. Every cement plant starts here; most have some assets still here regardless of their overall maturity claim.
Signals of this phase: High MTTR, emergency work orders dominate, planned/unplanned ratio below 60/40
Phase 2
Preventive Maintenance
Time-based schedules, planned intervention
Maintenance activities are scheduled based on calendar time or operating hours, regardless of actual asset condition. Reduces catastrophic failures but often over-maintains healthy equipment and under-maintains stressed equipment. Most cement plants live in this phase for years before advancing.
Signals of this phase: Structured PM schedules, CMMS in use, planned/unplanned ratio around 70/30
Phase 3
Condition-Based Maintenance
Sensor-driven, condition triggers action
Sensors continuously monitor key parameters — vibration, temperature, oil condition, current draw — and maintenance is triggered when readings exceed defined thresholds. Represents the first real move beyond schedules into actual asset condition, and requires the data infrastructure that predictive analytics will later build on.
Signals of this phase: Live sensor data, threshold-based alarms, planned/unplanned ratio approaching 85/15
Phase 4
Predictive Maintenance
Failure forecasting, planned intervention windows
Analytics on condition data forecast remaining useful life and time-to-failure, allowing maintenance to be planned into the most economical intervention window rather than triggered by threshold exceedance. This is the phase where reliability engineering fully separates from maintenance execution.
Signals of this phase: RUL forecasting active, failure mode models validated, planned/unplanned ratio above 90/10
Map the Journey Against Your Plant
Skip the Generic Playbook. Build a Roadmap That Fits Your Cement Plant.
iFactory's deployment engineering team helps cement reliability leaders honestly assess current maturity, identify the specific assets and data foundations to build first, and sequence technology deployment against the plant's actual maintenance calendar and cultural readiness.
Asset Prioritization
Which Cement Plant Assets Belong in Which Phase
Not every asset needs full predictive coverage. The cost of instrumentation, data collection, and analytics has to be justified by the consequence of failure on that specific asset. The framework below is how mature cement PdM programs allocate their investment — critical assets get predictive coverage, essential assets get condition-based, and general assets stay on preventive schedules that are refined over time as the CMMS data improves.
| Asset Class |
Failure Consequence |
Recommended Strategy |
Deployment Priority |
| Rotary Kiln Drive & Shell |
Multi-day plant shutdown, revenue loss |
Full predictive coverage — vibration, thermal imaging, drive current |
Phase 1 pilot candidate |
| Kiln ID Fan & Preheater Fans |
Kiln trip, production loss |
Predictive with vibration and balance monitoring |
Phase 1 pilot candidate |
| Raw Mill & Cement Mill Gearboxes |
Mill outage, cement production loss |
Predictive with oil analysis and vibration |
Phase 1 pilot candidate |
| Main Mill Motors |
Mill shutdown, extended replacement lead time |
Condition-based with current signature analysis |
Phase 2 rollout |
| Preheater Cyclones & Ducting |
Kiln trip, cleanup and refractory damage |
Condition-based with thermal and pressure monitoring |
Phase 2 rollout |
| Clinker Cooler Grate Drives |
Kiln trip or reduced clinker quality |
Condition-based with vibration monitoring |
Phase 2 rollout |
| Conveyors & Bucket Elevators |
Localized flow disruption, redundancy exists |
Preventive with condition inspection rounds |
Phase 3 or ongoing |
| Packing Plant Equipment |
Shipping delay, downstream buffer exists |
Preventive with periodic condition assessment |
Phase 3 or ongoing |
| Utility & Auxiliary Systems |
Minor operational impact |
Preventive schedules refined by CMMS data |
Ongoing baseline |
The pattern that emerges from this framework: predictive coverage concentrates on assets whose failure disrupts the entire kiln line, condition-based coverage extends to assets whose failure disrupts a production section, and preventive strategies cover assets whose failure is localized or where redundancy exists. Trying to apply predictive coverage universally is how PdM programs run out of budget before they show returns; concentrating investment where consequence justifies it is how the same programs pay back inside the first eighteen months.
Technology Deployment Sequence
The Technology Stack, Phase by Phase
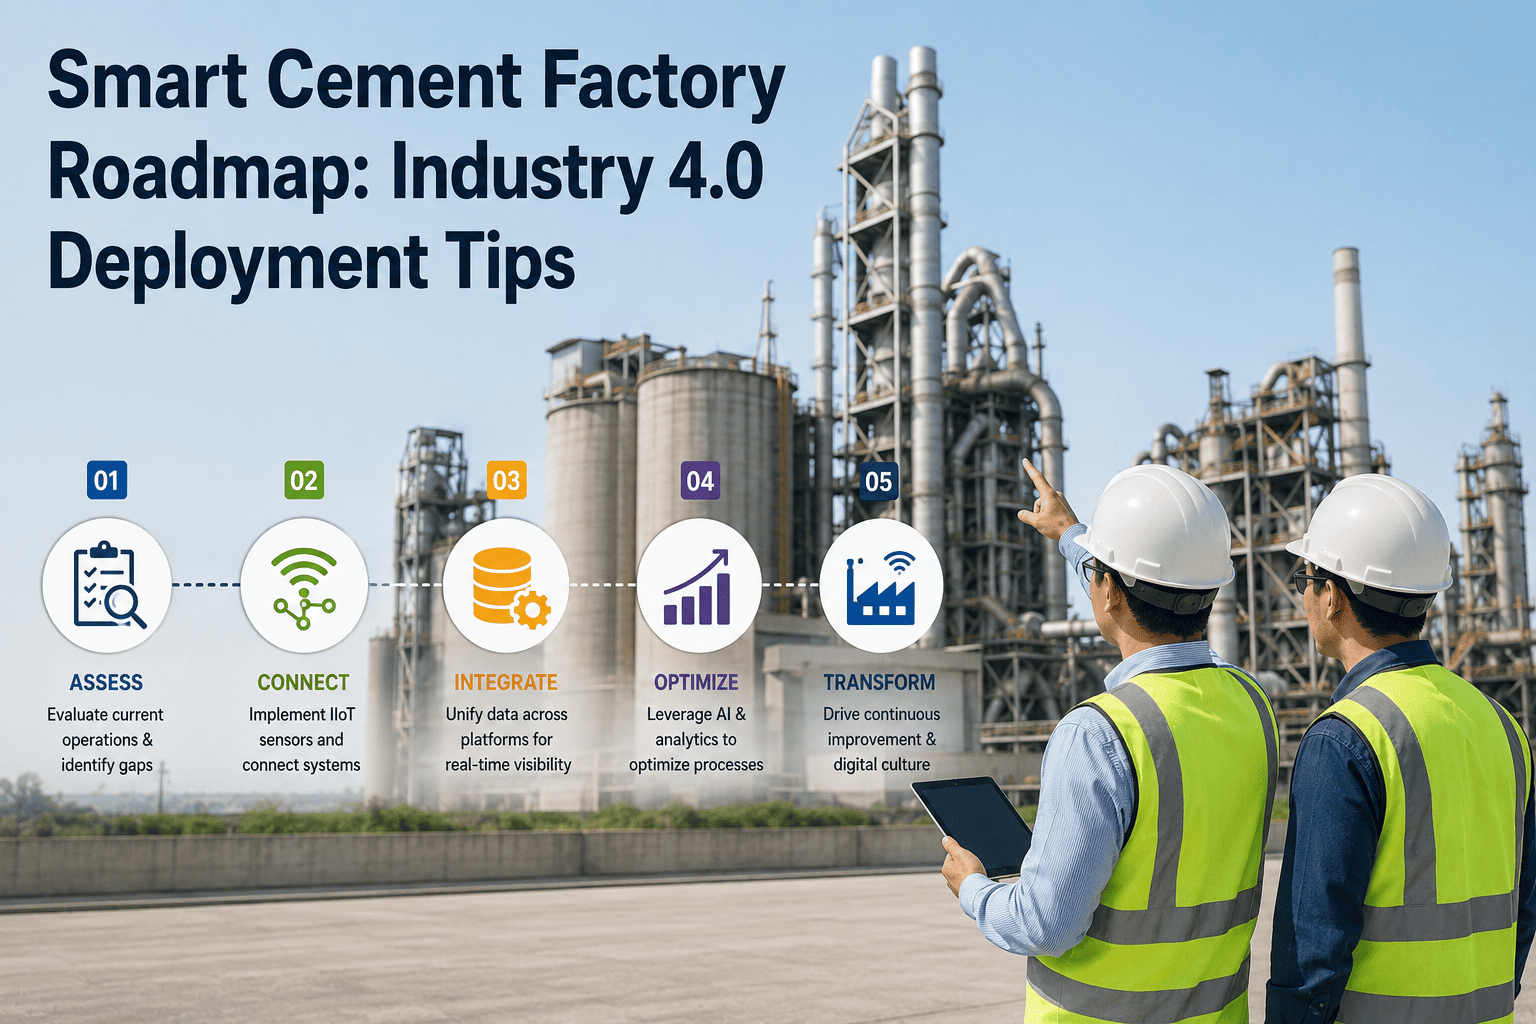
Technology deployment for cement PdM is best thought of as a stack that builds upward — each layer depends on the layer below it, and skipping layers produces gaps that undermine the higher levels. The sequence below is how successful cement plants actually build their PdM technology foundation, and it maps directly to the maturity phases described earlier.
01
CMMS Foundation
A computerized maintenance management system that captures every work order, every failure, every intervention, and every cost. Without this data foundation, later analytics have nothing to correlate against. Most cement plants have a CMMS in some form; whether the data quality supports advanced analytics is a separate and often uncomfortable question.
02
Sensor Instrumentation
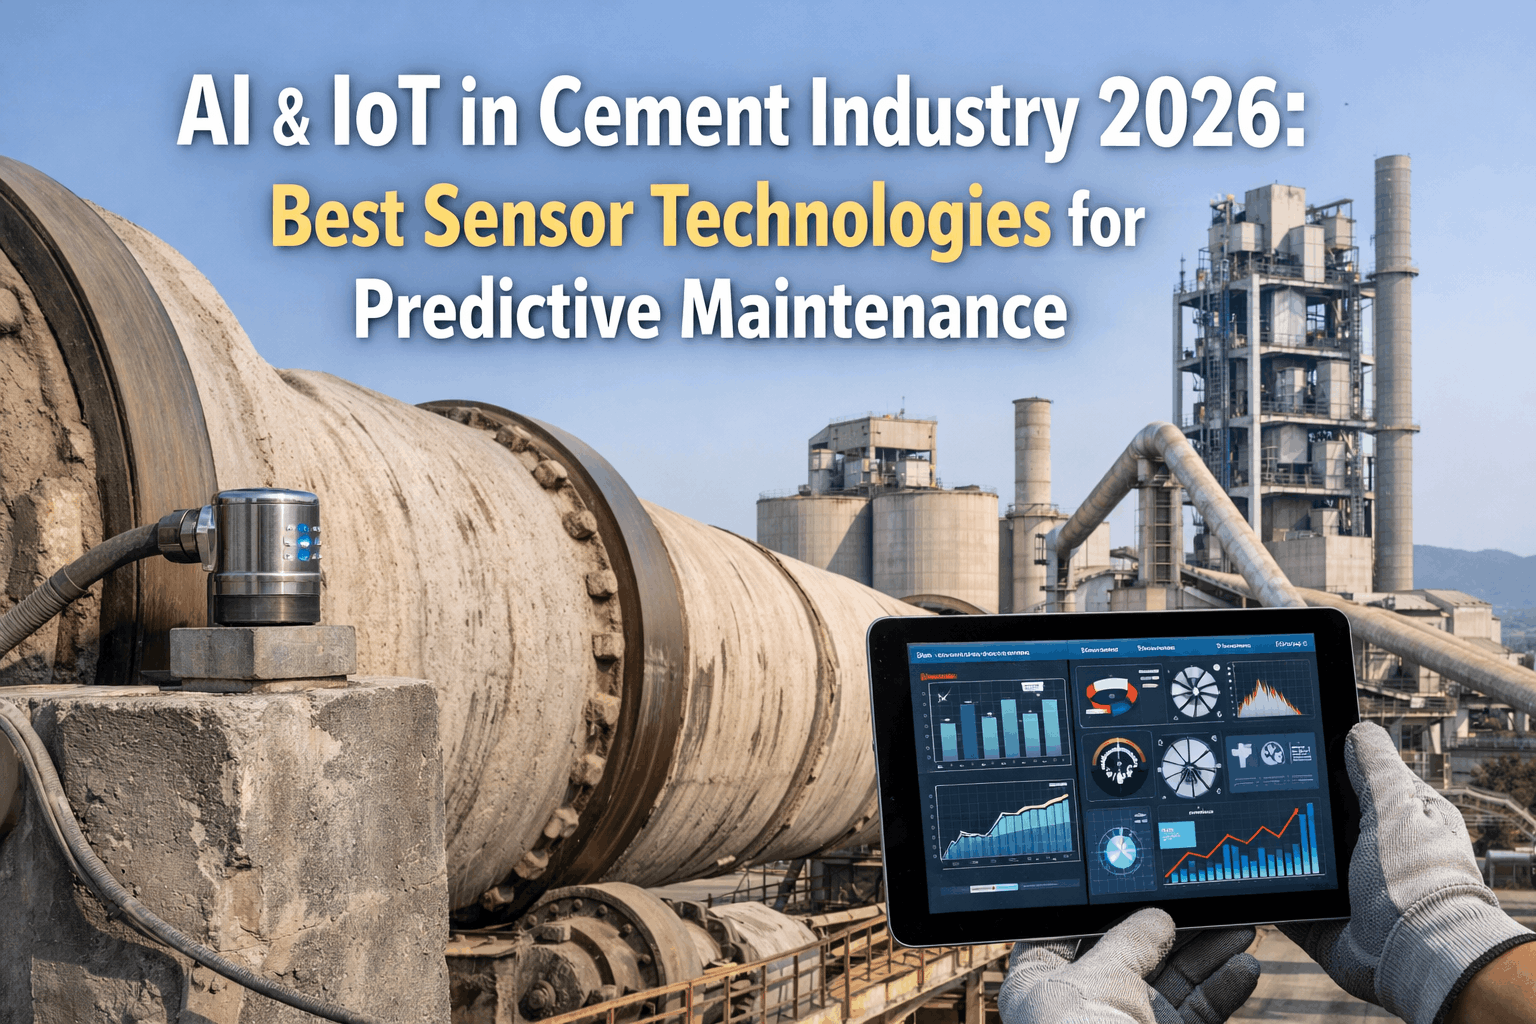
Vibration sensors, temperature probes, current transformers, oil condition monitors, and pressure transmitters on critical assets. Sensor selection matters enormously in cement environments — dust, heat, and vibration limit which sensor technologies survive long enough to produce reliable data.
03
Data Historian & IIoT Gateway
Continuous data collection infrastructure that captures sensor readings at appropriate frequencies and stores them in a form analytics can query. This is where many cement plants underinvest and then wonder why their analytics layer produces poor results — bad data infrastructure produces bad analytics regardless of how sophisticated the models are.
04
Condition Monitoring Dashboards
Live visualization of asset condition against defined thresholds, with alarms that route to the right person at the right time. This is the first layer that produces operational value for the reliability team — the point where sensor data actually becomes actionable rather than just collected.
05
Predictive Analytics & RUL Models
Machine learning models trained on the historian data to forecast remaining useful life, identify failure modes from signal patterns, and predict time-to-failure windows. This layer only produces reliable results once the CMMS, sensor, and historian foundations are in place and mature enough to have generated the data volume the models require.
06
Integrated Reliability Platform
Unified system that connects CMMS work orders, sensor data, predictive forecasts, and maintenance planning into a single reliability workflow. This is the platform layer where PdM stops being a set of separate tools and becomes the operating system for the reliability organization.
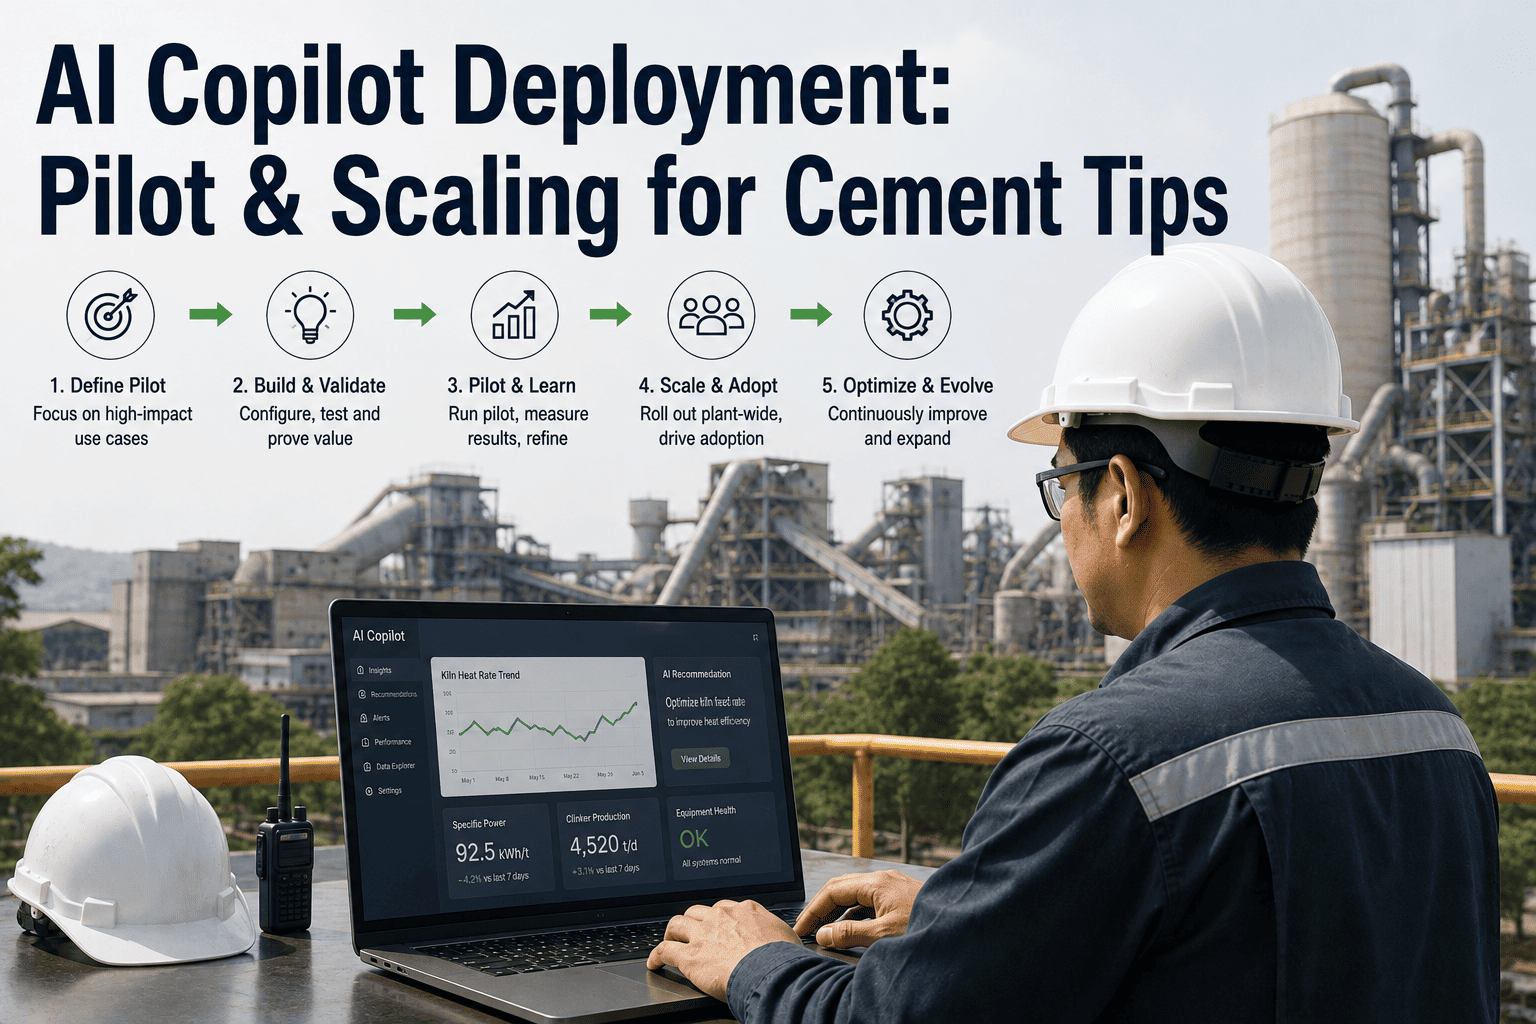
Pilot Selection Strategy
Choosing the First Pilot That Actually Proves the Model
Every cement PdM program lives or dies on its first pilot. A pilot that succeeds builds internal momentum, credibility with leadership, and the case for scaling. A pilot that fails or produces ambiguous results usually kills the program regardless of how good the technology is. The criteria below separate pilots that produce clear results from ones that produce debates about whether the technology actually worked.
P1
High Failure Consequence
Pick an asset whose failure is clearly expensive and clearly visible to leadership. A caught failure on a critical asset produces an unambiguous business case; a caught failure on a marginal asset produces a debate about whether the technology was worth the cost.
P2
Well-Understood Failure Modes
The asset should have documented failure modes with known signal signatures. A pilot on an asset with novel or poorly understood failure modes turns into a research project rather than a demonstration project, and demonstration is what a first pilot needs to deliver.
P3
Accessible Instrumentation Points
Sensor installation should be practical without extended asset downtime. Pilots that require major installation shutdowns get postponed indefinitely; pilots that can be instrumented during routine planned windows actually happen on schedule.
P4
Engaged Maintenance Team
The pilot asset should have a maintenance team that wants the program to succeed. Cultural resistance is the single largest killer of PdM pilots, and starting with an engaged team gives the technology a fair chance to prove itself before spreading to skeptical areas.
P5
Measurable Baseline
Historical failure data, MTBF, and cost per unplanned event should be available for the pilot asset. Without a baseline, "the pilot worked" becomes an opinion rather than a measurement, and measurement is what secures budget for the next phase.
P6
Realistic Timeline
The pilot should be scoped to demonstrate value within six to nine months. Longer pilots lose leadership attention; shorter pilots don't run long enough to catch representative failure patterns. Six to nine months hits the sweet spot for cement plant reliability cycles.
The Culture Shift
The Human Side of Reactive-to-Predictive Transformation
Technology is the easier half of a PdM transformation. The harder half is the culture shift — moving a maintenance organization from a reactive rhythm where the best mechanics are the ones who fix breakdowns fast, into a predictive rhythm where the best mechanics are the ones who prevent breakdowns from happening in the first place. This shift changes what maintenance leaders reward, how reliability engineers spend their time, and how the plant defines success on the maintenance side of the P&L.
C1
From Heroes to Planners
The reactive plant celebrates the mechanic who works through the night to restart a tripped kiln. The predictive plant celebrates the reliability engineer who scheduled the intervention that prevented the trip in the first place. Recognition and career progression have to shift, or the culture continues to reward the wrong behavior.
C2
Data as Authority
Predictive maintenance decisions get made from sensor data and analytical forecasts rather than from experienced intuition. Experienced mechanics often resist this — for good reason, their intuition is usually right — but the roadmap has to build a working partnership between data-driven insights and craft knowledge rather than treating them as competing sources of truth.
C3
Reliability as a Discipline
Most cement plants have maintenance but not a distinct reliability engineering function. The PdM transformation typically requires creating or strengthening this discipline — someone whose job is to think about failure modes, refine PdM strategies, and translate analytics into maintenance actions — rather than assuming existing maintenance leaders will absorb the reliability role.
C4
Metrics That Reward Prevention
If maintenance is still measured primarily on response time and cost per work order, the organization will optimize for reactive excellence. Metrics have to include prevention outcomes — MTBF, planned versus unplanned ratio, forecast accuracy — or the transformation stalls because nothing structural rewards the new behavior.
Field Perspective
"
The cement plants that succeed with PdM transformation are the ones that stop treating it as a technology project and start treating it as a maturity journey. I've watched plants buy sophisticated analytics platforms while their CMMS data is still incomplete and their sensor infrastructure is patchy — the analytics have nothing coherent to analyze, the maintenance team stops trusting the outputs within a quarter, and the whole program quietly dies. The pattern that actually works is embarrassingly simple: get the CMMS foundation right, instrument the critical assets, prove the model on one high-consequence pilot, use that pilot to build internal advocates, then scale. Every plant I've seen make this work followed some version of that sequence. Every plant I've seen fail tried to skip to the analytics layer without the foundations underneath. The technology isn't the hard part — the sequencing and the culture shift are the hard part, and no amount of vendor sophistication substitutes for getting those right.
Henrik Sørensen-Kaplan
Cement Plant Reliability Director · 24 years in kiln maintenance, mill overhauls, and cement industry PdM program leadership
Common Questions
Frequently Asked Questions
How long does a full reactive-to-predictive transformation typically take in a cement plant?
A realistic timeline for a full transformation runs three to five years from serious start to mature operation, though measurable results on pilot assets typically appear within the first year. The three-to-five-year window reflects the reality that culture change and organizational capability building move slower than technology deployment, and that condition monitoring data needs time to accumulate before predictive models can be trained reliably. Plants that promise faster transformations usually end up in the same place as plants that took the longer view, just with more failed pilots along the way.
Talk to deployment engineering about realistic timing for your specific starting maturity.
Can we skip preventive maintenance and go straight from reactive to predictive?
Technically possible on paper, almost always a mistake in practice. Preventive maintenance builds the structured scheduling discipline, the CMMS data quality, and the planned-versus-unplanned work distinction that predictive strategies depend on. A plant that hasn't developed those foundations doesn't have the data or the organizational habit to execute predictive maintenance even if the analytics correctly predict failures. The plants that try to leapfrog preventive typically end up with predictive alerts nobody responds to because the work planning process to translate an alert into a scheduled intervention never existed. Building preventive properly is a shortcut to predictive, not a delay.
Which cement plant asset should be the first PdM pilot?
The answer depends on the plant's specific reliability history, but the two most common successful pilot choices are the kiln ID fan and the raw mill or cement mill gearbox. Both are high-consequence assets where failure produces immediate visible cost, both have well-characterized failure modes with known vibration and oil condition signatures, and both can typically be instrumented during routine planned windows without extended shutdown. The specific pick between them usually comes down to which one has the better historical failure record to serve as the pilot baseline.
Book a demo to walk through pilot selection against your own asset history.
What ROI should we expect from a successful cement PdM program?
Mature cement PdM programs typically deliver measurable ROI across three categories: unplanned downtime reduction of thirty to fifty percent on covered assets, maintenance cost reduction of fifteen to twenty-five percent through elimination of unnecessary preventive interventions, and spare parts inventory reduction as emergency stocking becomes less necessary. The specific numbers depend heavily on the plant's starting reliability baseline — plants with high unplanned downtime see larger percentage reductions because they had more waste to eliminate; plants that were already reliable see smaller percentage reductions but often more sustainable operational improvements. Payback typically lands in the twelve-to-twenty-four-month range for well-scoped programs.
How do we handle the sensor durability challenges of cement plant environments?
Sensor selection for cement environments requires specific attention to dust ingress ratings, temperature ranges, and vibration tolerance that go well beyond typical industrial specifications. Sealed vibration sensors rated for high-temperature bearing housings, thermal imaging cameras with dust-purge protection, and oil condition monitors designed for the specific lubricants used in cement gearboxes are all standard practice. Poor sensor durability is one of the most common failure modes for cement PdM programs — sensors installed with generic industrial ratings often fail within months in kiln-adjacent locations, taking the data stream down with them. The right sensor spec at installation costs more upfront but delivers the multi-year data continuity that predictive analytics actually require.
From Roadmap to Reliability Reality
Build the Cement PdM Program That Actually Delivers
The difference between a PdM program that transforms plant reliability and one that becomes an expensive dashboard nobody uses is almost always in the roadmap — the sequencing, the pilot selection, the technology stack, and the culture shift. iFactory's platform is designed for cement plant realities and deployment discipline that actually converges on results.