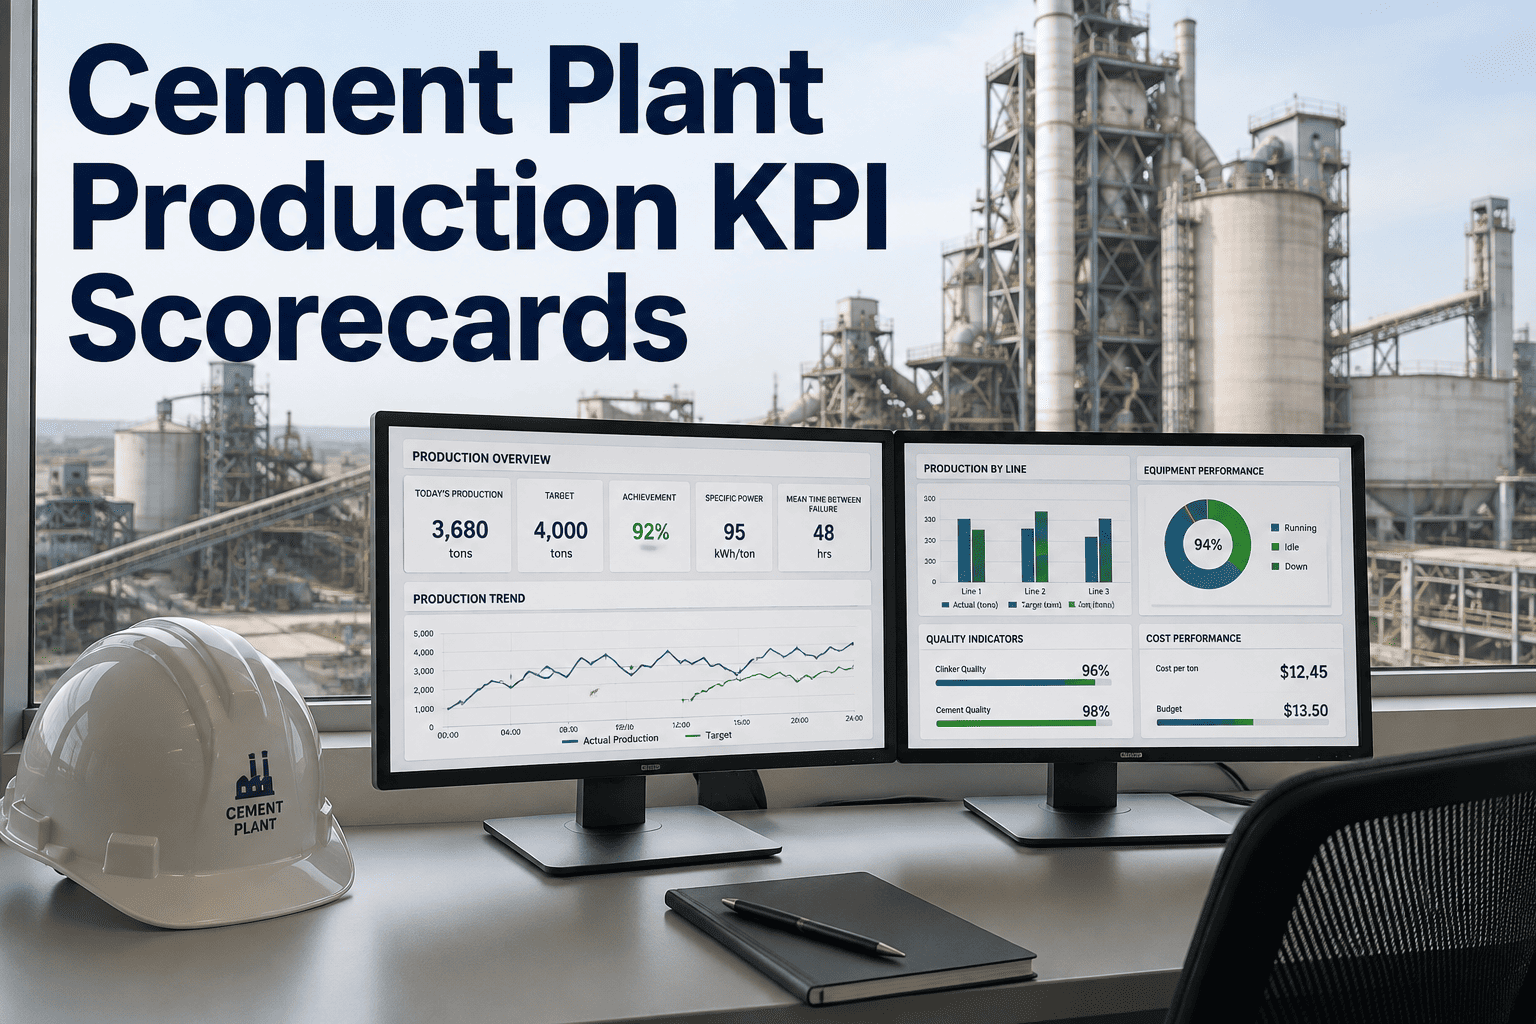
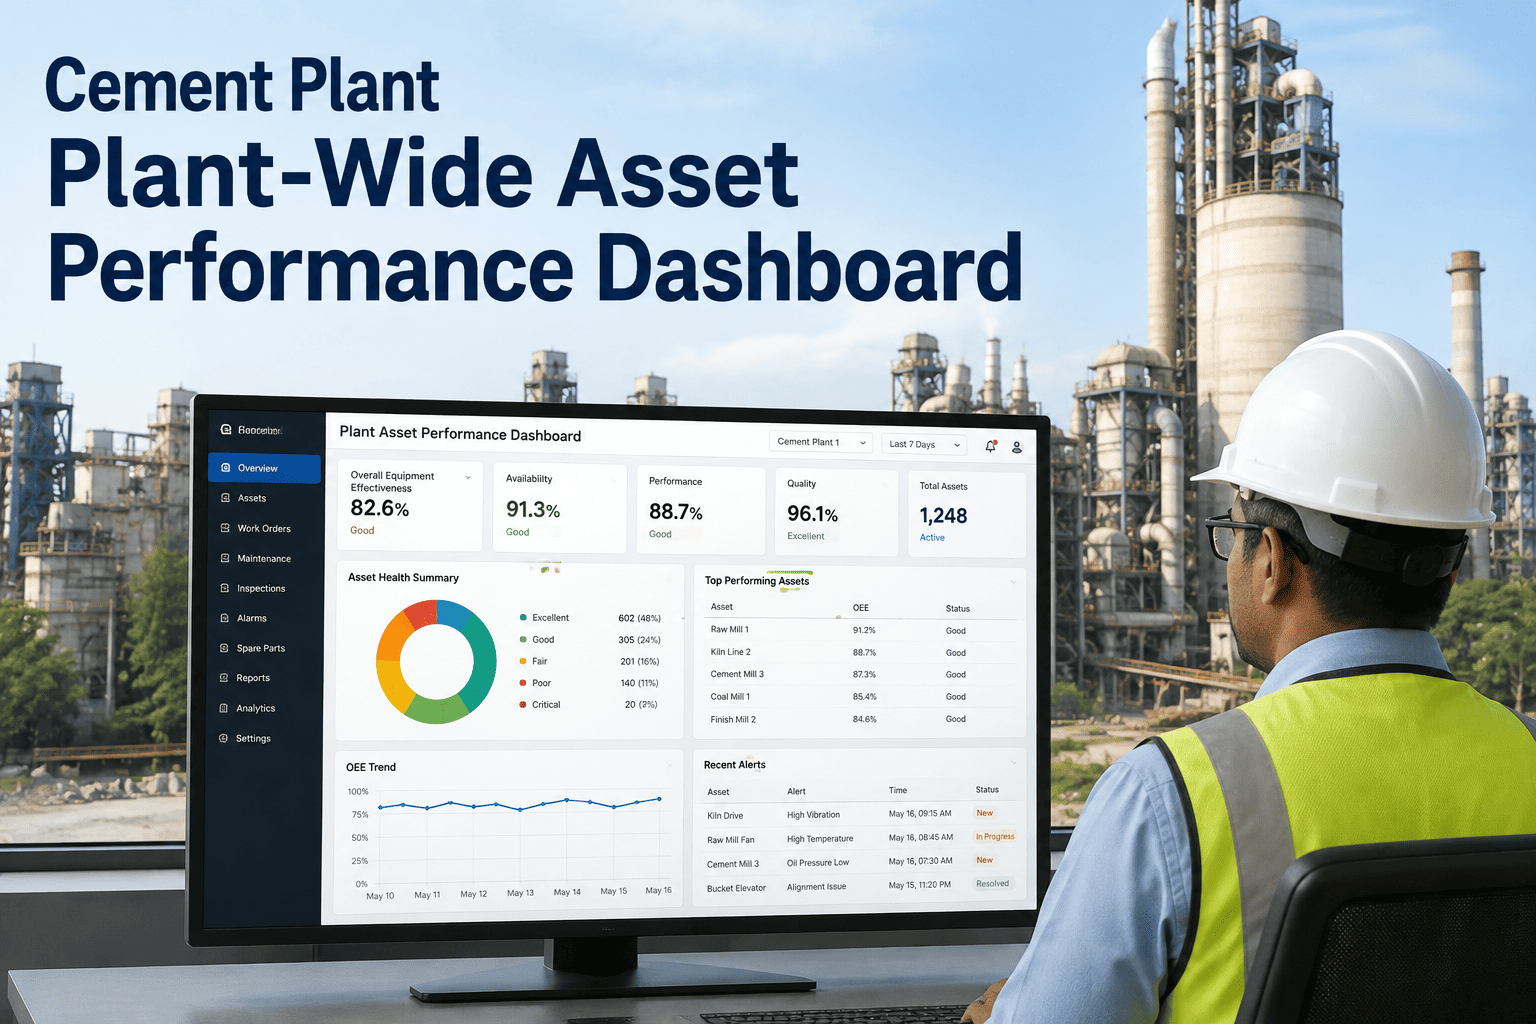
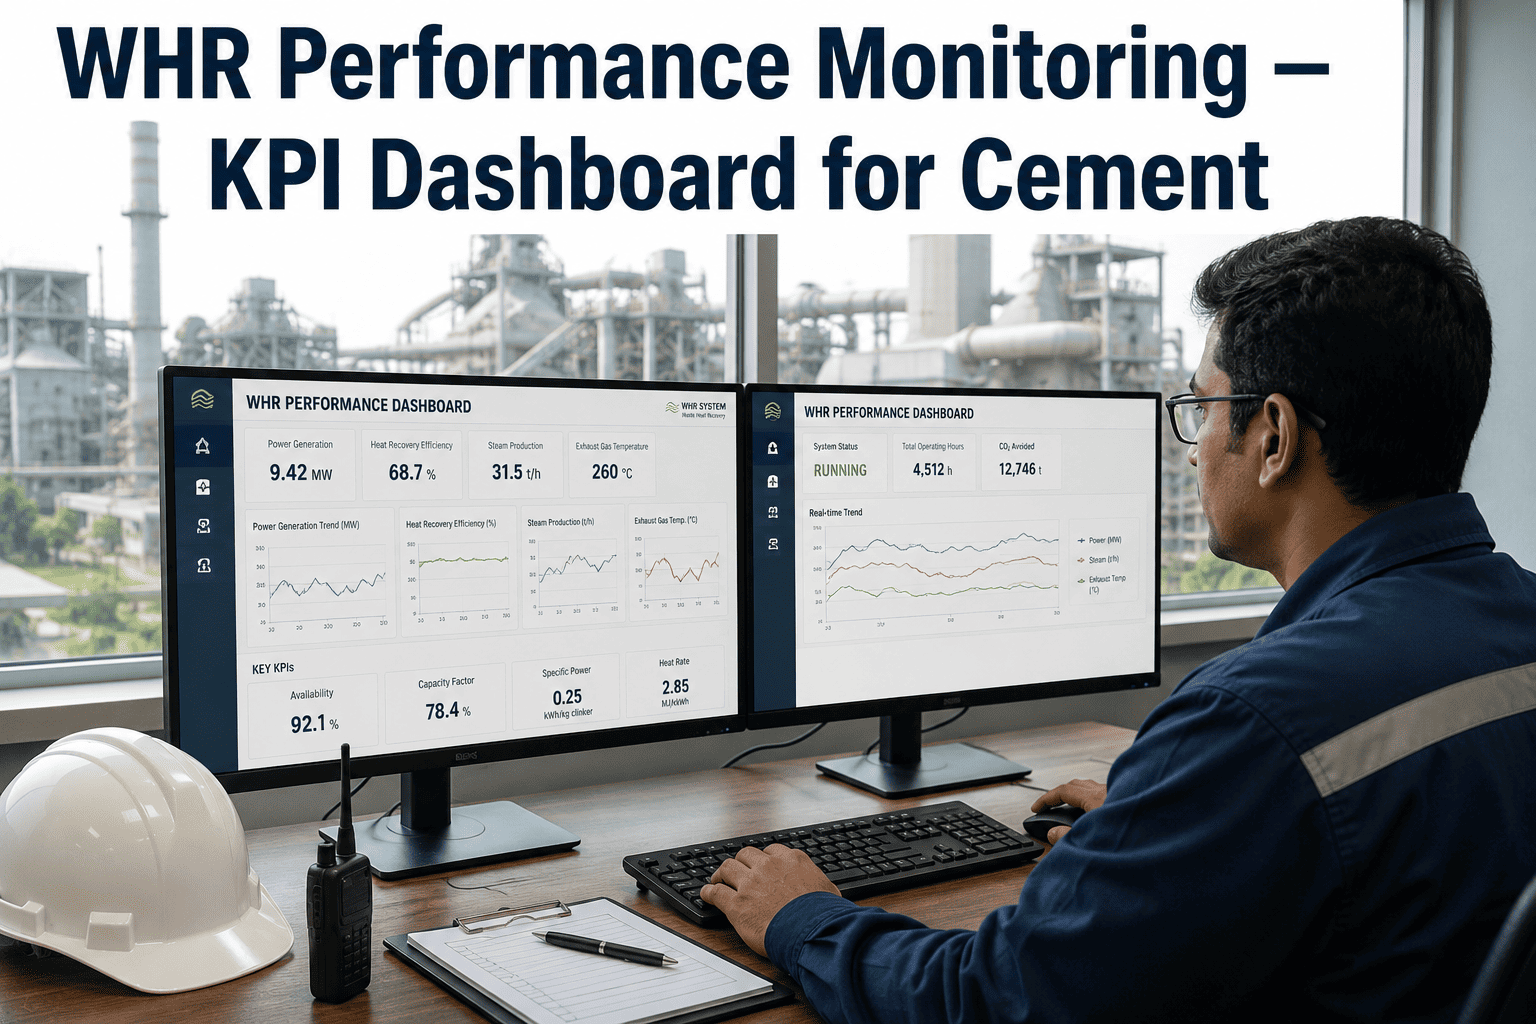
Most cement plants still run production performance the way they did fifteen years ago: a shift supervisor fills out a paper log, someone keys it into a spreadsheet the next morning, and by the time a plant manager sees where yesterday's shift landed against target, half of today's shift has already run the same way. A production KPI scorecard fixes the sequencing problem — it turns throughput, OEE, and quality into a graded, red-amber-green view that updates automatically as MES data comes in. See how iFactory's MES module builds live scorecards from your plant's existing PLC and DCS data.
MES · Production Scorecards
Stop Grading Yesterday's Shift. Grade The One Running Right Now.
Automated production KPI scorecards pull throughput, OEE, and quality data straight from MES and DCS systems, scoring every shift, line, and section against target the moment the numbers land — not the next morning.
88-93%Kiln availability benchmark for modern dry-process lines
$4-6MAnnual capacity gap between 68% and 85% OEE on a 5,000 TPD line
60 secRefresh interval on a live production scorecard vs. next-day spreadsheets
What Actually Goes On The Scorecard
Three Categories, Graded Separately, Rolled Up Together
A scorecard that lumps every metric into one number hides where the problem actually sits. Production scorecards work best when throughput, efficiency, and quality are scored independently first, then combined into a single OEE-style rollup that a plant director can scan in seconds.
Production Output
Tonnes produced against shift and daily target, by line and by section, with variance flagged the moment actual output drifts more than a configured threshold below plan.
Efficiency & Availability
OEE broken into availability, performance, and quality factors, so a low score can be traced to downtime, speed loss, or rejects instead of staying a single unexplained number.
Quality Compliance
Blaine fineness, free lime, and LSF/SM/AM ratios pulled directly from lab LIMS integration, scored against spec limits rather than reviewed only at the end of a production run.
What It Looks Like
A Sample Shift Scorecard, Section By Section
Red-amber-green status against target, refreshed automatically, replaces the manual color-coding a planner used to add to a spreadsheet by hand once a shift.
| Section | Target | Actual | Status |
| Raw Mill |
185 tph |
181 tph |
On Target |
| Kiln |
3,000 tpd |
2,760 tpd |
Watch |
| Cement Mill 1 |
140 tph |
108 tph |
Below Target |
| Packing |
98% uptime |
99.1% uptime |
On Target |
See Your Own Data In This Format
Build A Scorecard From Your Plant's Actual PLC and DCS Feeds
iFactory's engineering team connects a sample scorecard to your existing production data during a working demo, so you see your own numbers scored, not a generic template.
Manual Reporting vs. Automated Scorecards
Where The Twelve-Hour Delay Actually Costs You
Spreadsheet Reporting
Shift data keyed in by hand at shift end, with transcription errors that surface days later
Plant manager sees yesterday's numbers, not today's, missing the window to correct an in-progress shift
Quality data lives in a separate LIMS report, cross-referenced manually against production totals
Every role gets the same static report regardless of what decision they actually need to make
Automated MES Scorecard
Data pulled directly from PLC, DCS, and LIMS systems, updated as production events actually occur
Shift supervisor sees a live deviation the moment output drifts, with time left to correct it
Quality compliance scored alongside production output in the same view, not reconciled after the fact
Technician, supervisor, manager, and director each see a role-specific scorecard from the same underlying data
The Business Case
What A One-Point OEE Improvement Is Worth
OEE is the master metric because it exposes whether downtime, speed loss, or quality rejects are the biggest drain on a given line, and the gap between a plant running at 68% versus 85% OEE on a 5,000 TPD line is measured in millions, not thousands.
Kiln availability improvement per 1% gain (3,000 tpd plant)~30 additional tonnes/day
Revenue impact of 1% kiln availability gain~$1.2M annually
Capacity gap, 68% OEE vs. 85% OEE (5,000 TPD line)$4-6M annually
Scorecard refresh vs. spreadsheet reportingReal-time vs. next-day
Field Perspective
The value isn't the dashboard, it's the twelve hours you get back. A shift supervisor who sees cement mill throughput drifting below target at hour three, instead of reading about it in tomorrow's report, still has time to fix it before the shift ends. Once plant managers see that timing difference play out a few times, they stop asking for the spreadsheet.
Anika Ferreira
Production Operations Manager, Cement Manufacturing · 15 years in kiln and mill operations
Common Questions
Frequently Asked Questions
What systems does a production KPI scorecard need to connect to?
A production scorecard typically pulls from the plant's DCS or SCADA system for real-time equipment run status, the CMMS for downtime causes, and lab LIMS for quality parameters like Blaine fineness and free lime. Most cement plants already run all three; the scorecard's job is unifying that data into one scored view instead of leaving it in three separate systems nobody reconciles until month-end.
Talk to our engineering team about your specific system stack.
How is a scorecard different from a standard OEE dashboard?
A dashboard shows current values. A scorecard grades those values against a target and rolls the grade up across shift, section, and plant levels, producing the red-amber-green status a supervisor or director can scan without interpreting raw numbers. The two work together — the dashboard is where you investigate a miss, the scorecard is where you first see that one occurred.
Can different roles see different scorecards from the same data?
Yes. A technician typically needs today's line-level status, a supervisor needs shift-level variance against target, a plant manager needs daily and weekly trends across all sections, and a director needs monthly and quarterly rollups benchmarked against prior periods. Role-based scorecard views serve all four from the same underlying data without separate manual reports for each audience.
How long does it take to get a working scorecard live on our plant's data?
Does this replace our maintenance KPI tracking, or run alongside it?
Production scorecards focus on throughput, efficiency, and quality — the output side of the plant. Maintenance KPIs like MTBF, MTTR, and PM compliance are a related but distinct set of metrics that typically live on their own reliability-focused scorecard, connected to the same CMMS data but scored against different targets and reviewed by a different audience.
Ready to Grade The Shift That's Running Now
Turn Production Data Into A Scorecard, Not A Spreadsheet
iFactory's MES module connects to your DCS, SCADA, and lab LIMS to build live production KPI scorecards, scoring throughput, OEE, and quality against target the moment the data lands, so a miss gets caught during the shift that caused it.