Planned production time rarely turns into the same number of good tonnes, and the distance between the two is not one loss — it is several, stacked on top of each other, each with its own cause and its own fix. A loss tree breaks that gap into availability loss, performance loss and quality loss, the same three categories ISO 22400-2 uses to define OEE, so every lost tonne lands in a bucket someone can actually act on. Plants that track only a single downtime number are usually missing the performance and quality losses hiding inside hours that look fully productive on paper. Plant teams who want to see their own output gap broken into a loss tree can walk through a loss tree built from their own production data with our team.
Every Lost Tonne, Sorted Into a Bucket Someone Can Fix
iFactory, an on-premise AI platform for cement production analytics, decomposes the gap between planned and actual output into availability, performance and quality loss, ranked by impact.
What Does a Loss Tree Actually Decompose?
A loss tree starts with planned production time and subtracts each category of loss in sequence — availability loss leaves run time, performance loss leaves net run time, and quality loss leaves the good tonnes that actually count. Each layer explains part of the gap between what was planned and what shipped, and because the layers subtract in order, a team can see exactly how much of the total gap each category is responsible for rather than guessing from a single blended number. Ask our team how your current downtime tracking maps to these three categories.
Loss Category, OEE Pillar and Cement Example
| Loss category | OEE pillar | Cement example |
|---|---|---|
| Equipment failure | Availability | Unplanned kiln or mill stop |
| Setup and adjustment | Availability | Product or format changeover |
| Idling and minor stops | Performance | Short feed blockages, material interruptions |
| Reduced speed | Performance | Mill or kiln running below ideal rate |
| Process defects | Quality | Off-spec clinker or cement |
| Startup loss | Quality / Performance | Rework or reblend after a restart |
See Your Own Losses Decomposed by Category
Share a month of downtime and production records, and we will build a loss tree for your kiln, mill and packing lines.
Pareto Ranking: Which Loss Category Costs the Most?
Not every loss category deserves equal attention. Ranking them by lost tonnage, not by how recently or how dramatically an event happened, shows where improvement effort actually pays off first.
Why Performance Loss Is the One Plants Miss Most
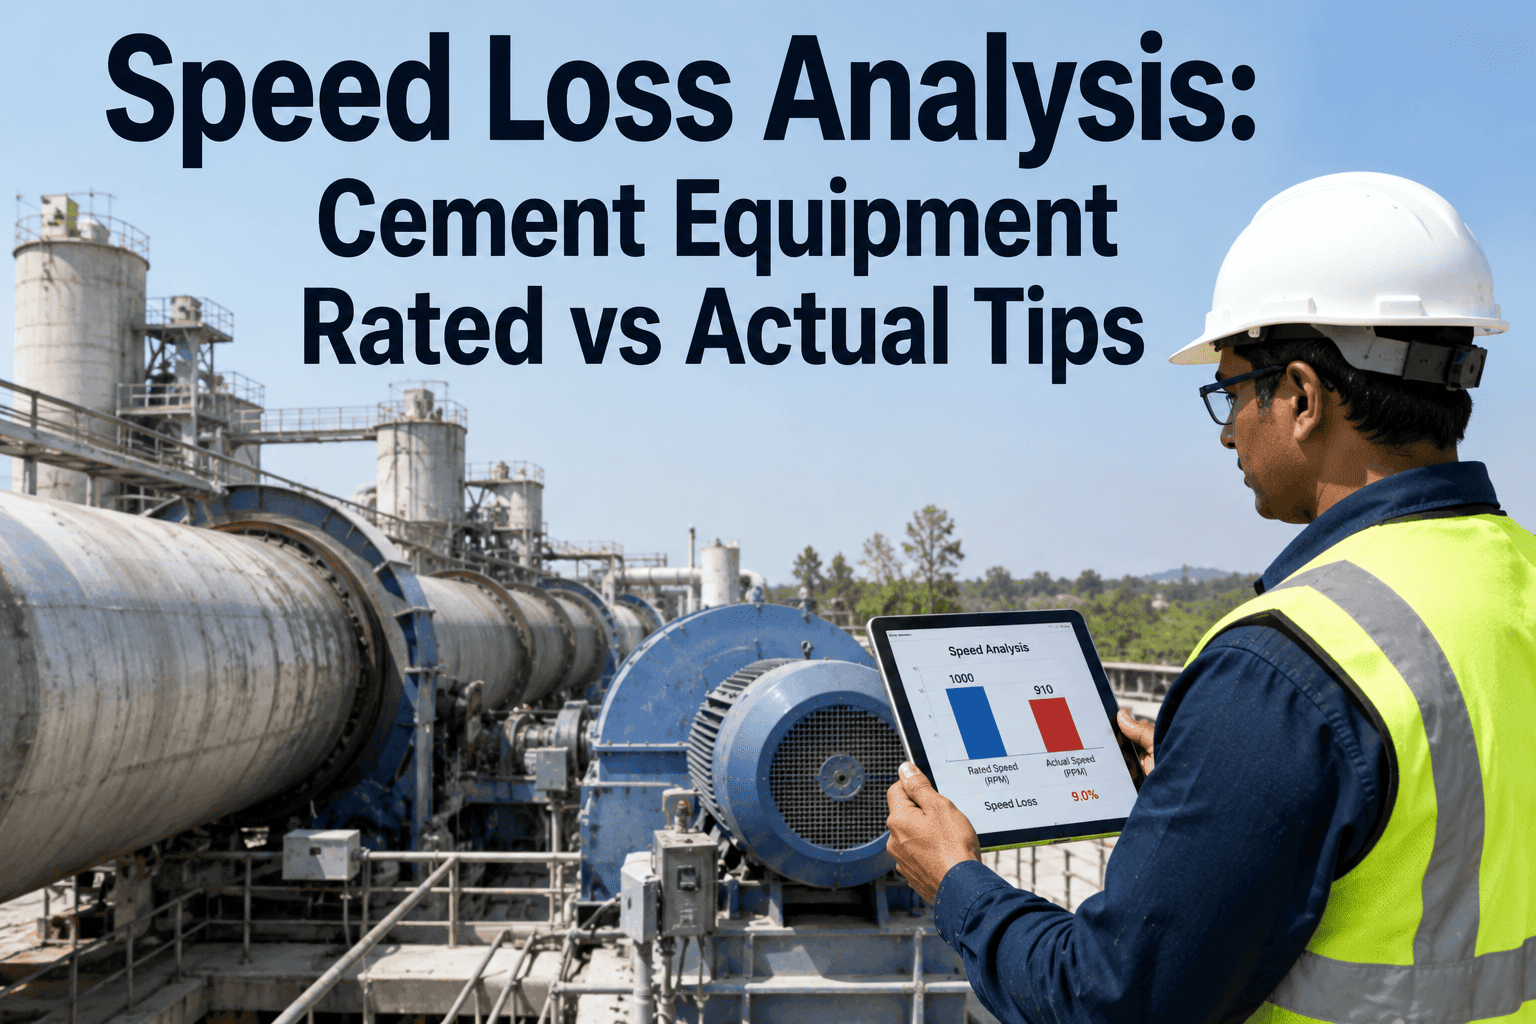
A kiln or mill that is running, but at a reduced rate, still shows as active on most SCADA overviews — nothing in a simple uptime report flags it as a loss. Performance loss only becomes visible once actual rate is compared against the asset's own ideal rate, which is exactly the comparison a loss tree forces.
Four Steps From Ranked List to Closed Gap
Loss categories are ranked by total tonnage lost, not event count.
The top category is broken into its specific recurring causes.
An owner and a concrete next step are set for the top cause.
The tree is rebuilt the following period to confirm the gap actually closed.
Re-ranking is the step most programs skip once the initial excitement of the first Pareto chart fades, but it is the only way to confirm a fix actually worked rather than simply assuming it did because the action was completed.
The Mill That Looked Fine Until the Tree Said Otherwise
A cement mill showed high uptime for the month, with few logged stops. Its loss tree told a different story — performance loss from a consistently derated running speed accounted for a larger output gap than every logged stop combined.
A Loss Tree for Every Asset, Rebuilt Every Shift
Automatic Loss Decomposition
Availability, performance and quality loss are calculated separately for kiln, mill and packing.
Pareto Ranking
Loss categories and specific causes are ranked by tonnage lost, updated continuously.
ISO 22400-2 Alignment
Loss definitions follow the same standard across every line and site.
Turnkey On-Premise Deployment
Production and loss data stay on your own server, with no outside cloud dependency.
What Production Teams Ask About Loss Trees
Is a loss tree the same thing as an OEE calculation?
A loss tree is a visual breakdown of the same three loss categories that make up OEE under ISO 22400-2, so the two use the same underlying data but present it differently — OEE gives one number, the tree shows where it came from. See how your current OEE number breaks down into a tree.
Should kiln, mill and packing each have their own loss tree?
Yes, generally. Blending all three assets into one plant-wide number hides which specific asset is driving the biggest loss, while separate trees let each asset's improvement team focus on its own ranked priorities. Ask support about setting up per-asset trees.
How is performance loss actually measured?
Performance loss compares actual output rate against the asset's established ideal rate over the time it was running, which is why a derated but technically active asset still registers a loss rather than showing as fully productive. Discuss how ideal rate is set for your assets.
How often should the Pareto ranking be reviewed?
Most plants review it weekly at minimum, with a daily glance at the top category, since loss patterns can shift meaningfully within a few weeks as fixes take hold or new issues emerge. Discuss a review cadence for your plant.
What happens after the top loss category is fixed?
The tree is rebuilt and re-ranked — fixing the top cause typically moves a different category into first place, which is expected and is exactly how Pareto-driven improvement is supposed to work over time. Ask how re-ranking is tracked over successive periods.
Find the Loss That's Actually Costing You the Most
See your own planned-to-actual gap decomposed into availability, performance and quality loss, ranked by impact.