A cement group with eight plants across three countries does not have one quality problem — it has eight separate ones, each invisible to the others. Plant A grinds to a 3200 Blaine target; Plant D grinds to 3350 because a supervisor changed the target three years ago and never updated the procedure. Plant B's XRF runs on ISO 29581 methodology; Plant F's runs on an in-house variant nobody documented. Group-level customers see one brand but eight different products. Central quality has no way to compare, benchmark, or harmonize because the data lives in eight spreadsheet ecosystems that never speak to each other. A multi-plant LIMS deployment fixes this at the root. To scope one against your group's plant footprint, book a 30-minute quality strategy session.
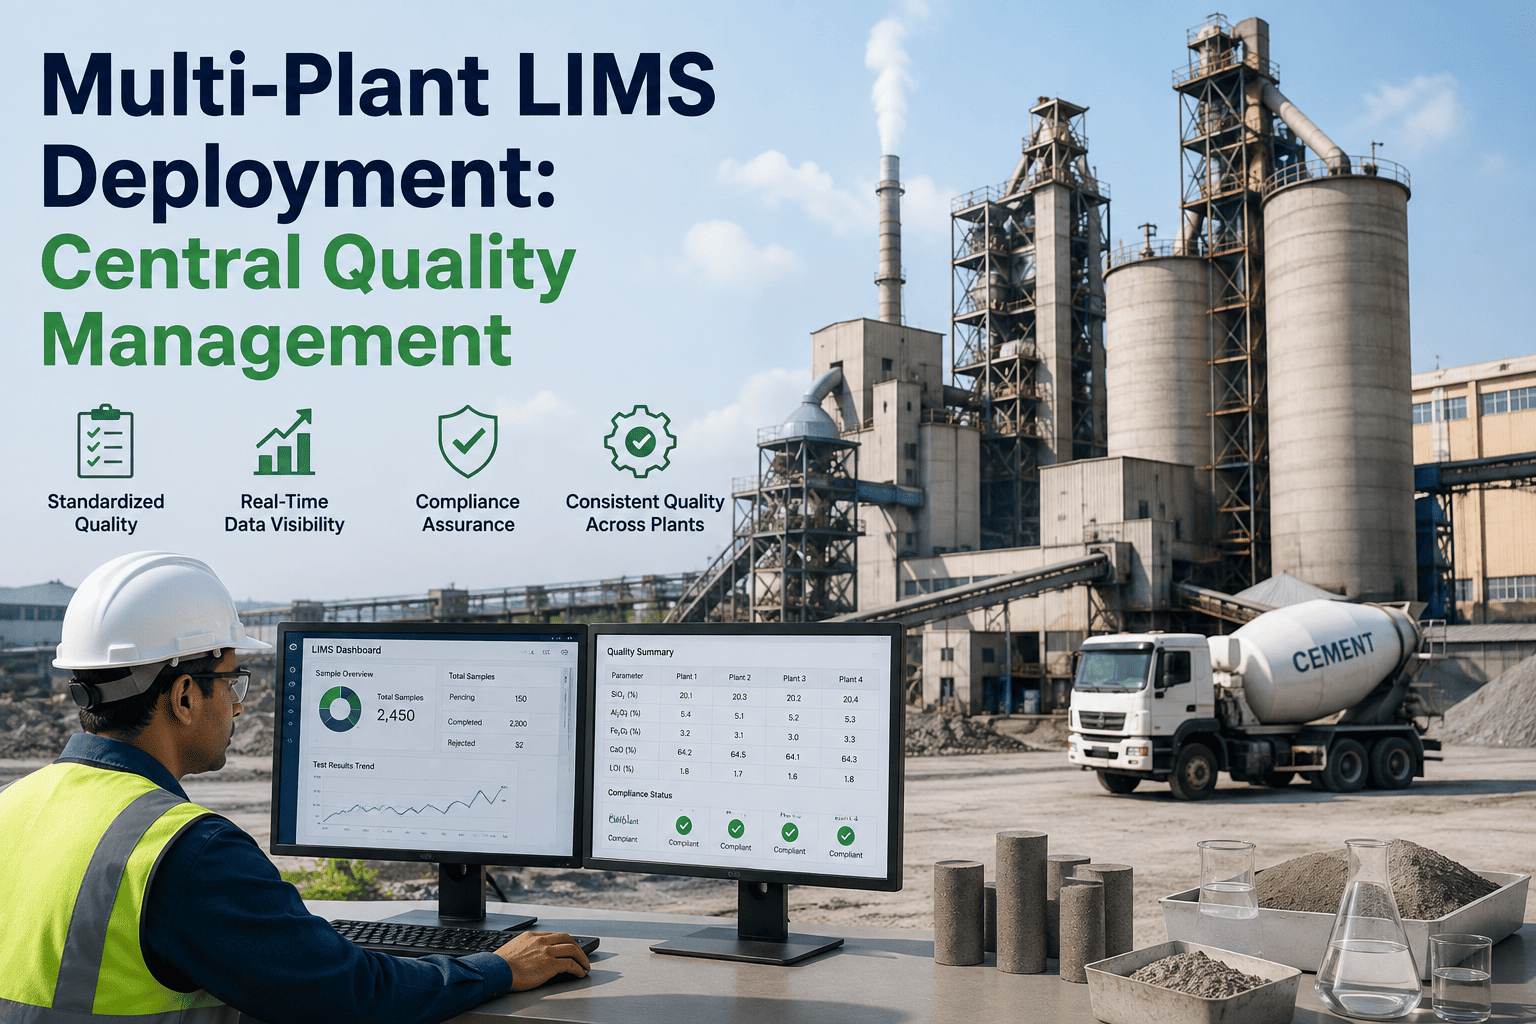
Multi-Plant LIMS Deployment: Central Quality Management for Cement Groups
How cement groups running 3–50 plants harmonize test methods, benchmark quality performance, and put group-level oversight on one dashboard — without ripping out plant-level LIMS installations or forcing every site onto the same instrument brand.
The Cost of Uncoordinated Multi-Plant Quality — Five Silent Losses
Group quality directors know the pain but rarely have the numbers on hand. Below are the five loss categories that appear on the P&L when quality is managed plant-by-plant without a central layer — each one quietly costing a mid-size group between $400K and $2M annually, and each one solvable with a properly deployed multi-plant LIMS. The costs do not appear as a single line item on any budget review, which is exactly why they persist year after year. They accumulate as inflated rework budgets at individual plants, ballooning central-quality analyst headcount, quiet customer defection to competitors with more consistent product, and slow-motion regulatory exposure as inconsistent methods surface during external audits.
Method Divergence Across Plants
Same brand, same specification, different lab methods. Plant A calibrates its XRF against a different secondary standard than Plant D. Plant F's Blaine test uses a 2.85 g/cm³ density assumption while Plant C uses 3.15. On paper, every plant is compliant. In practice, a customer switching between plants sees measurable product differences and quietly reroutes to a competitor whose product is consistent. Group commercial teams often discover the churn a year late, in a market-share review, without ever tracing the loss back to the underlying method divergence at the source plants.
No Cross-Plant Benchmarking Possible
The highest-performing plant in the group ships 99.7% first-time-in-spec cement. The lowest ships 94.2%. Nobody at group level knows which lab practices, which sampling frequency, or which corrective response drives the delta — because the data structures at the two plants are incompatible. Best practice cannot travel because best practice cannot be identified. Even when a group technical team suspects Plant A is doing something right, they cannot prove it with the same rigor a plant manager would demand before changing their own operation.
Slow Rollout of Group Standards
When group technical publishes an updated compressive strength testing procedure, it takes six to twelve months for every plant to implement, validate, and confirm the change — and central quality has no live visibility into which plants are current on which procedure version. A revised group standard sits in email inboxes and Teams channels rather than in production laboratories. When an auditor asks which version of a procedure a specific plant was running on a specific date, central quality has no way to answer with confidence — because the procedure lived in a distributed file system nobody has central visibility into.
Duplicated Reporting Labor at Every Site
Every plant runs its own weekly quality report, monthly regulatory submission, and quarterly customer certificate-of-analysis production — often manually assembled from spreadsheets. The group as a whole is paying for the same reporting effort ten times over, and central quality is spending significant analyst time reconciling formats so the numbers can be compared. That reconciliation labor scales linearly with plant count — which is why the reporting-labor pain gets sharper, not easier, every time a group acquires a new plant.
Cross-Plant Deviation Investigations Run Blind
When a customer complaint links back to product shipped from multiple plants, central quality has no way to look across the plant records simultaneously — no unified sample database, no comparable test histories, no correlated raw-material trends. Investigations drag for weeks, root cause remains contested, and the same failure mode recurs at a sister plant a quarter later because the lesson never generalized. The compounding cost — same problem investigated twice, three times, sometimes four times across the group — dwarfs the direct labor of any single investigation.
The Central Quality Framework — Four Layers That Have to Line Up
A multi-plant LIMS is not just plant LIMS installations connected to a shared database. It is a four-layer architecture that harmonizes methods, standardizes data, enables benchmarking, and delivers central oversight — all without forcing every plant into an identical setup. The layers below are what a mature deployment actually contains, and the order matters. Skip the method harmonization step and the benchmarking layer produces misleading comparisons. Skip the central oversight layer and the harmonization work sits unused. Every group that has tried to shortcut this sequence — usually by starting with the dashboard because that is the visible deliverable — has landed at the same result: pretty charts driven by non-comparable data, which erodes trust in the whole program within two quarters.
Method Harmonization
Every plant runs the same test method for the same parameter — same standard reference (ISO, ASTM, EN), same calibration approach, same acceptance criteria. Where a plant needs a local variation for a valid regulatory reason, the variation is documented and its impact on comparability is quantified.
Unified Data Model
One data structure across every plant — parameter names, units, sample identifiers, timestamps, instrument references. When Plant A logs a Blaine reading, it lands in the group database with the same field names, same units, and same sample-lineage metadata as a Blaine reading from Plant H.
Cross-Plant Benchmarking
Group dashboards showing every plant against every other plant on the KPIs that matter — first-time-in-spec rate, coefficient of variation on key parameters, days between calibration events, mean time to corrective action. Best-performer callouts, worst-performer intervention triggers, trend lines by quarter.
Central Oversight & Governance
Group technical publishes a revised standard — the LIMS pushes it to every plant, tracks adoption, flags plants still running the old method past the deadline. Central quality issues a rapid response instruction after a raw-material change — every plant confirms receipt and implementation on a live dashboard.
What Central Quality Actually Sees — A Live Group Dashboard
The concrete deliverable of a multi-plant LIMS is the group-level dashboard that turns eight plants into one comparable view. Below is a representative benchmarking snapshot — the kind of view a group quality director opens every Monday morning to see who is performing, who is drifting, and where an intervention is due. Every column is a KPI. Every row is a plant. The colored cells are where the eye lands first. Before the LIMS layer existed, this comparison could not be built at all — the plants reported KPIs in different formats, on different cadences, using different definitions, and central quality's analyst team spent most of every week reconciling formats rather than reading the actual numbers.
| Plant | FTIS % | Blaine CoV | Free Lime CoV | Comp Strength CoV | Cal Hygiene | MTTA | Rank |
|---|---|---|---|---|---|---|---|
| Plant A | 99.7% | 1.8% | 2.4% | 2.1% | 98% | 42 min | 1 |
| Plant B | 99.1% | 2.1% | 2.6% | 2.3% | 96% | 55 min | 2 |
| Plant C | 97.4% | 2.8% | 3.5% | 2.6% | 91% | 78 min | 5 |
| Plant D | 98.3% | 2.4% | 2.8% | 2.4% | 94% | 62 min | 3 |
| Plant E | 98.0% | 2.5% | 3.0% | 2.5% | 93% | 68 min | 4 |
| Plant F | 94.2% | 3.6% | 4.1% | 3.2% | 84% | 124 min | 8 |
| Plant G | 97.8% | 2.6% | 3.1% | 2.7% | 92% | 72 min | 6 |
| Plant H | 97.5% | 2.7% | 3.2% | 2.8% | 90% | 76 min | 7 |
Stop Running Eight Quality Programs. Run One, Deployed Across Eight Plants.
iFactory deploys a multi-plant LIMS across cement group footprints — method harmonization, unified data model, benchmarking dashboards, and central governance. Existing plant-level LIMS integrated where they already work. Fixed deployment window. Group-level ROI visible in the first quarter. Runs on cloud or private-cloud infrastructure to fit your data-residency requirements across every jurisdiction your plants operate in.
Deployment Approach — How a Multi-Plant Rollout Actually Works
The classic multi-plant LIMS mistake is trying to boil the ocean on day one — every plant, every parameter, every legacy system, in one big-bang cutover. It almost always fails. iFactory's rollout methodology is deliberately sequenced: reference plant first, then a lighthouse cluster, then the long tail. Each phase compounds learning from the previous, and every plant sees the value of the layer before it is asked to change anything. The reference-plant-first approach also matters politically — starting with the group's best-performing lab avoids the sensitivity of asking a struggling plant to change first, and it demonstrates the value of the platform against a track record other plant managers already respect.
Reference Plant Selection & Harmonization Baseline
The group's best-performing lab is designated as the reference plant. Its methods, parameter definitions, and data structures become the harmonization baseline. Every subsequent plant maps to this reference — not to a theoretical group standard nobody has actually run in production.
Central Data Model & Group Dashboard Build
The reference plant's data feeds into the central LIMS data model. Group dashboards are built and validated against the reference plant's live data — proving the benchmarking layer works before other plants are asked to migrate. The reference plant sees value from day one of its own migration.
Lighthouse Cluster — Three Additional Plants
Three geographically or operationally diverse plants join the platform. Method harmonization runs at each site, plant-level LIMS gaps get filled, and the group dashboard now shows a four-plant comparable view. Central quality issues its first genuinely cross-plant intervention using benchmarking data.
Long-Tail Rollout & Governance Handover
Remaining plants onboard on a rolling schedule with the lighthouse cluster serving as internal reference. Central governance workflows go live — standard version control, adoption tracking, group audit trail. Ongoing platform management handed to group quality with iFactory support subscription.
What Group Rollout Looks Like in the First Year
The pattern below reflects what cement groups running a properly sequenced multi-plant LIMS deployment typically see across the first twelve months. Every milestone maps to a specific layer of the framework, and every value point is measurable against the pre-deployment baseline. This is the timeline group quality directors reference when they build the business case for the board approval — because it shows visible ROI moments distributed across the year rather than a single big-bang payoff at month twelve. Each milestone below has been observed at multiple cement groups following the same sequenced approach, and the pattern is consistent enough to plan against with confidence.
Reference Plant Live, Central Data Model Validated
The reference plant's data flows into the central model. Group dashboards render live for one plant. Central quality director sees the format of what benchmarking will look like — and starts adapting their weekly review meeting to the new evidence base.
Lighthouse Cluster Live, First Cross-Plant Intervention
Four plants on the platform. First real benchmarking comparison reveals a specific practice at the reference plant that the lighthouse plants are not doing. The lift travels to two lighthouse plants inside a month — measurable FTIS improvement follows within the next quarter.
Group Standard Version Control Operational
Group technical publishes a revised procedure through the LIMS rather than by email. Adoption is tracked in real time. Every plant confirms implementation on a live dashboard. The rollout timeline for a group standard collapses from months to weeks — for the first time.
Long-Tail Plants Onboarded, First Annual Board Review
Full group footprint on the platform. First annual quality review to the board runs from live LIMS data rather than reconciled spreadsheets. The cross-plant variance reduction, FTIS improvement, and reporting-labor savings numbers are presented as measured outcomes, not projections.
Outcomes Group Quality Directors Actually Report
The numbers below are what cement groups running a mature multi-plant LIMS deployment report against the pre-deployment baseline. Every one is tied to a specific mechanism the platform enables — harmonization, unified data, benchmarking, or governance — and every one is defensible in front of a group CFO or a plant general manager. These are median outcomes across cement groups running the full four-layer deployment for at least twelve months across five or more plants, which is the footprint size at which the benchmarking and best-practice-diffusion effects begin to compound meaningfully.
Frequently Asked Questions
Do we have to replace our existing plant-level LIMS installations?
Almost never. Most cement groups already have plant-level LIMS installations from vendors like FLSmidth QCX/Manager, ABB Knowledge Manager, or homegrown systems that work reasonably well at the site level. iFactory's multi-plant approach integrates with existing plant LIMS via standard export interfaces and API connectors, layering the group-level data model, benchmarking, and governance on top rather than requiring a rip-and-replace. Where a plant has no LIMS at all, iFactory can deploy the plant-level layer as part of the same rollout. To scope which of your existing plant LIMS integrate natively, book a compatibility review.
How do you handle plants that legitimately need different test methods for local regulatory reasons?
Local regulatory variation is expected in multi-country cement operations — EN 197-1 in Europe, ASTM C150 in North America, GB 175 in China, IS 269 in India. iFactory's harmonization framework does not require every plant to use identical methods. It requires every legitimate methodology variation to be documented, its comparability impact quantified against the group reference, and its data appropriately tagged so cross-plant benchmarking accounts for the difference. The result is honest benchmarking that reflects real product performance rather than method-driven artifacts.
What kind of data infrastructure does the central layer need?
The central platform runs on iFactory's cloud infrastructure or, for groups with data-residency requirements, on a customer-managed private cloud instance in a jurisdiction of the group's choosing. Data from each plant is pushed on a configurable cadence (real-time streaming for critical parameters, batched hourly or daily for routine data) with all traffic encrypted end to end. The plant-level installations continue to operate autonomously if the central connection is interrupted — plant quality operations are never dependent on the group layer being available.
How does the platform handle change management with plant lab teams?
The rollout methodology is deliberately designed to minimize disruption for plant lab teams. The reference plant leads by example rather than being forced to conform. Each subsequent plant migration is scoped as a two-to-four-week engagement with a dedicated iFactory field team that runs alongside the plant lab manager, not around them. Existing sample workflows are preserved wherever possible, and the harmonization work focuses on the specific parameters where cross-plant divergence is measurably hurting group performance rather than forcing sweeping change for its own sake.
What does a realistic ROI window look like for a 5-plant to 15-plant group?
Payback drivers are cross-plant parameter variance reduction (translating to reduced rework and customer complaints), reporting labor consolidation, best-practice diffusion accelerating first-time-in-spec rates at the lower-performing plants, and audit posture improvement. For a typical five-plant group, first-year savings land in the seven-figure range and payback on the platform investment typically completes inside twelve to eighteen months. Larger groups see faster payback proportional to the number of plants because the benchmarking benefit scales super-linearly. For a group-specific ROI projection, book a 30-minute assessment.
Turn Your Cement Group Into One Quality Operation, Across Every Plant
Method harmonization. Unified data. Cross-plant benchmarking. Central governance. iFactory's multi-plant LIMS turns fragmented site-level quality programs into one comparable, benchmarkable, governable group operation — without replacing what already works at plant level. Start with the reference plant, prove the layer, then scale across the footprint. The first ROI moment lands inside the first quarter; the full group return typically completes inside eighteen months for a five-to-ten-plant deployment.