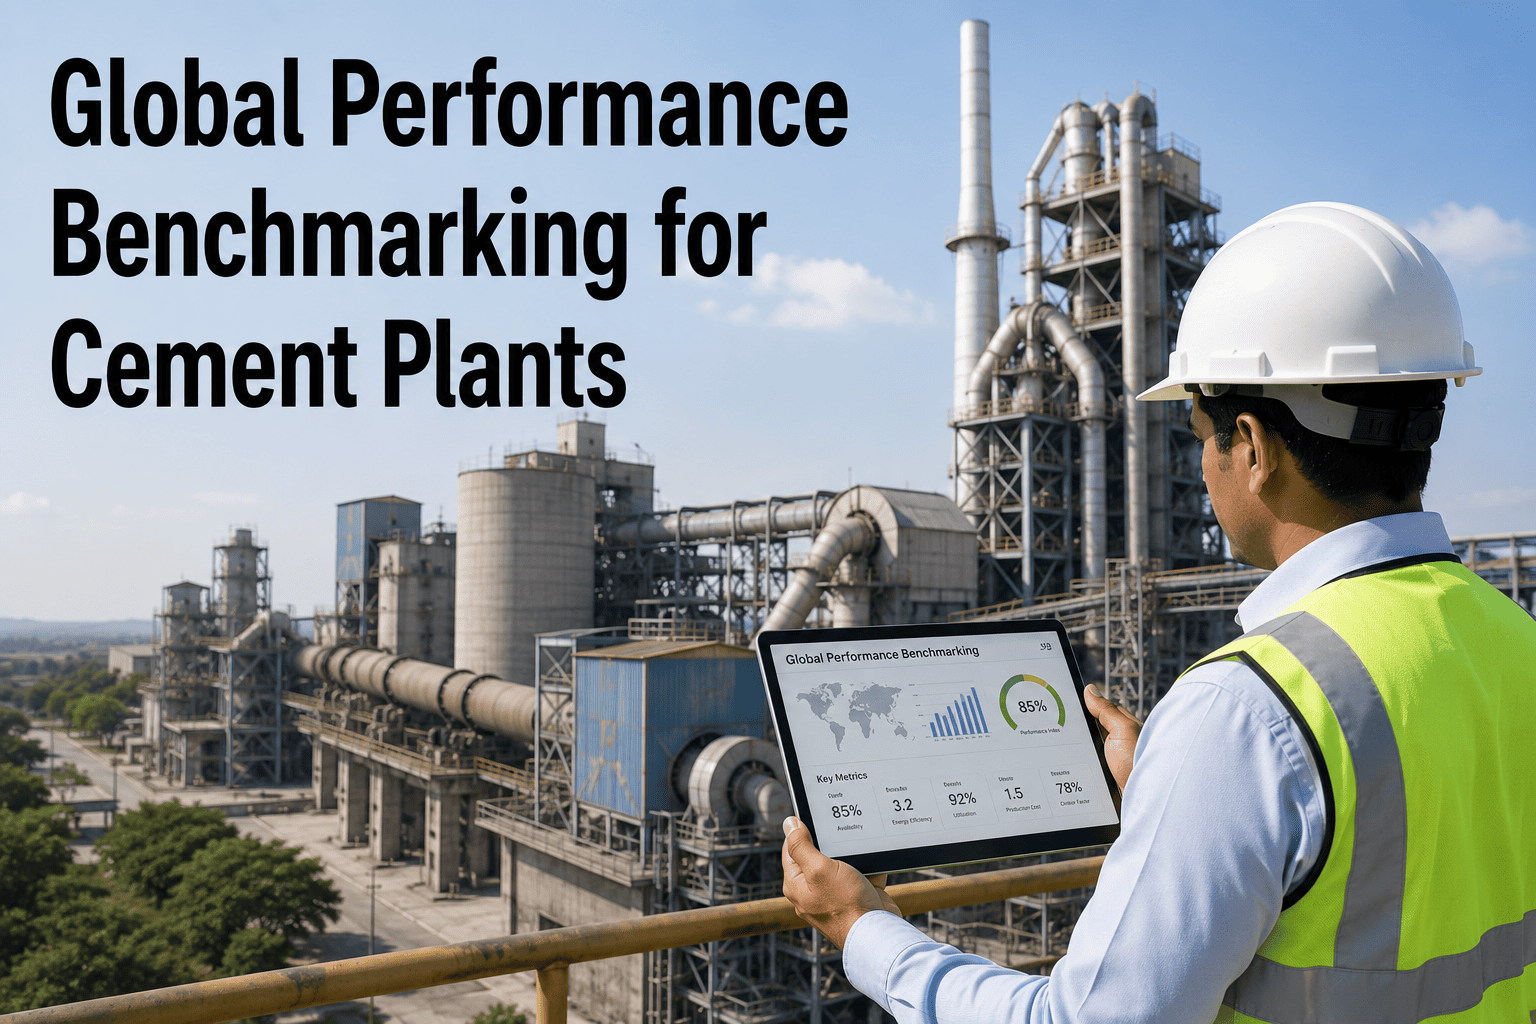
Two cement plants can run the same kiln capacity, burn similar fuel mixes, and still differ by fifteen percent or more in thermal energy consumption per tonne of clinker, a gap that quietly costs the weaker performer well over a million dollars a year once it is multiplied across annual production. Most plant managers know their own numbers cold, but far fewer know how those numbers stack up against global best-available-technology benchmarks, or against the specific peer group their plant should actually be compared to. Benchmarking closes that gap by turning raw operating data into a ranked, comparable picture across thermal energy, electrical consumption, clinker factor, equipment effectiveness, maintenance cost, and safety performance. Plants that build this comparison into a regular routine, rather than a one-off exercise, are the ones that consistently find and close performance gaps, a discipline explored further through structured plant performance reviews.
CEMENT PLANT PERFORMANCE BENCHMARKING
Where Does Your Plant Actually Rank Globally?
Thermal SEC, electrical SEC, clinker factor, OEE, maintenance cost per tonne, and safety metrics only mean something in comparison. See what closing the gap to best-in-class is really worth.
The Six KPIs That Define Global Standing
Cement plant performance benchmarking has matured around a consistent set of metrics used by industry bodies, engineering consultancies, and plants themselves to compare operations regardless of geography, kiln technology, or plant age. Each metric isolates a different part of the operation, and together they build a complete picture of where a plant genuinely stands.
01
Thermal Specific Energy Consumption
Measured in gigajoules per tonne of clinker, thermal SEC reflects kiln system efficiency and is the single largest cost driver in most cement operations, since fuel typically accounts for a third or more of total production cost, making even small percentage improvements worth pursuing aggressively.
02
Electrical Specific Energy Consumption
Measured in kilowatt-hours per tonne of cement, electrical SEC captures grinding efficiency across raw mill, kiln drive, and finish mill circuits, areas where equipment condition drives outsized swings, particularly worn mill liners and grinding media that quietly increase power draw over months without triggering any alarm.
03
Clinker Factor
The ratio of clinker to total cement output directly ties to both cost and emissions, since clinker production is the most energy-intensive and carbon-intensive step in the entire process, meaning every point of clinker factor reduction compounds savings across fuel, raw material, and emissions cost simultaneously.
04
Overall Equipment Effectiveness
OEE combines availability, performance, and quality into a single number that reveals how much of a plant's theoretical output capacity is actually being captured day to day, and it is frequently the metric with the fastest, lowest-cost improvement path of the entire set.
05
Maintenance Cost Per Tonne
Normalizing total maintenance spend against production output allows a fair comparison between plants of different sizes and reveals whether maintenance spend is being converted into reliability or simply absorbed by reactive repairs, a distinction that often matters more than the total spend figure itself.
06
Safety Performance Metrics
Lost time injury frequency and total recordable incident rate round out the picture, since operational excellence and safety performance tend to move together rather than trade off against each other, and plants that treat safety metrics as a separate reporting exercise from operational KPIs typically miss that connection.
Typical Range vs Best-Available-Technology
Global benchmarking studies consistently show a wide spread between average operating plants and best-available-technology performance, and that spread is where the opportunity lives. The figures below reflect commonly cited industry ranges for dry-process kilns with preheater-precalciner systems, the dominant technology in modern cement production. Plants running older wet-process or long dry kilns will see substantially different absolute numbers, which is exactly why normalizing for kiln technology before drawing any conclusion is the first and most important step in any credible benchmarking exercise.
| KPI | Typical Operating Range | Best-Available-Technology | Primary Driver of Gap |
| Thermal SEC (GJ/t clinker) |
3.3 – 4.0 |
2.9 – 3.1 |
Preheater condition, false air in-leakage, kiln stability |
| Electrical SEC (kWh/t cement) |
95 – 120 |
75 – 90 |
Grinding circuit efficiency, mill liner and media condition |
| Clinker Factor |
0.75 – 0.85 |
0.60 – 0.70 |
Supplementary cementitious material availability and quality |
| OEE (%) |
65 – 78 |
85+ |
Unplanned downtime and minor stoppages across the line |
| Maintenance Cost (per tonne) |
Higher, reactive-heavy |
Lower, predictive-driven |
Share of maintenance spend that is planned vs unplanned |
The gap between typical and best-available-technology is rarely closed through a single capital project. It is closed through the accumulation of smaller, well-targeted improvements across kiln stability, grinding circuit tuning, alternative fuel and raw material substitution, and maintenance strategy, each of which moves the number a fraction of a percent at a time.
What a One Percent Gap Actually Costs
Benchmarking becomes actionable the moment a percentage gap is translated into a dollar figure, because a management team will fund a project justified by a clear cost of inaction far more readily than one justified only by an abstract efficiency target.
Thermal Energy Gap
A plant producing 1.5 million tonnes of clinker annually that sits even a few percentage points above best-available-technology thermal efficiency is typically leaving well over a million dollars in annual fuel cost on the table, based on figures commonly cited in kiln energy optimization studies, a gap that compounds year over year if left unaddressed.
Electrical Energy Gap
A fifteen kilowatt-hour per tonne gap on a 1.5 million tonne annual production plant translates into roughly a million and a half dollars a year in excess electrical cost at typical industrial power rates, concentrated mainly in grinding circuits, where mill efficiency losses accumulate gradually and rarely trigger any single alarming event.
OEE Gap
Every percentage point of OEE recovered on a constrained kiln line represents additional saleable tonnes produced without any new capital equipment, often the single highest-return lever available to a plant, since it requires no new kiln capacity and no additional fuel or raw material input.
See Your Plant's Numbers Against Global Benchmarks
Walk through a live comparison of your thermal SEC, electrical SEC, and OEE against best-available-technology reference values.
How to Benchmark Correctly
A benchmarking exercise done carelessly produces numbers that look impressive but mislead decision-making, usually because it compares plants that are not actually comparable. Four steps keep a benchmarking program honest and useful.
1
Normalize for Configuration
Adjust for clinker-to-cement ratio, raw material hardness, alternative fuel substitution rate, and kiln technology before comparing any two plants, since ungrounded comparisons produce misleading conclusions.
2
Compare Against Multiple References
Track performance against your own historical best, against peer plants with similar configurations, and against global best-available-technology benchmarks, since each reference answers a different question.
3
Break Down Total SEC by Process Stage
A plant-wide SEC number masks which specific stage, raw grinding, pyroprocessing, or finish grinding, is actually driving the gap, so decompose it before assigning improvement targets.
4
Repeat on a Fixed Cadence
A single benchmarking snapshot tells you where you stand today; a repeated quarterly or annual cadence tells you whether improvement initiatives are actually working.
6 Core KPIs
Thermal, electrical, clinker factor, OEE, maintenance cost, and safety
3 Reference Points
Historical best, peer plants, and global best-available-technology
Stage-Level Detail
Raw grinding, pyroprocessing, and finish grinding tracked separately
Why Total SEC Alone Hides the Real Story
Total plant specific energy consumption is the number most often quoted in benchmarking reports, but it is also the number most likely to mislead a plant team trying to decide where to invest improvement effort. Two plants can post an identical total thermal SEC while having completely different underlying process efficiencies, one losing energy through false air in-leakage at the preheater, the other losing it through poor kiln flame shape and refractory condition. Only a stage-level breakdown reveals which problem actually needs solving.
This is also where the gap between benchmarking as a reporting exercise and benchmarking as an operational discipline becomes clear. A report that states a plant sits at 3.6 gigajoules per tonne against a best-available-technology figure of 3.0 tells a leadership team there is room to improve, but it does not tell a process engineer what to actually change on Monday morning. Breaking that number down by preheater stage efficiency, kiln shell heat loss, cooler recuperation, and grinding circuit performance turns a scorecard into a prioritized action list, and that translation is where most of the real value in a benchmarking program is created.
Mistakes That Undermine a Benchmarking Program
Benchmarking is easy to do badly, and a flawed comparison is often worse than no comparison at all, since it leads a plant to chase the wrong improvement or dismiss a real gap as unavoidable. A few recurring mistakes account for most of the bad conclusions drawn from benchmarking exercises.
A
Comparing Unlike Configurations
A wet-process plant compared directly against a dry-process preheater-precalciner plant will always look worse on thermal SEC, not because it is poorly run, but because the two technologies have fundamentally different theoretical minimums.
B
Using a Single Data Snapshot
A benchmarking figure captured during an unusually good or bad production month can misrepresent true performance; averaging across a full seasonal cycle produces a far more honest number.
C
Ignoring Raw Material Variability
Limestone hardness, moisture content, and chemical composition vary meaningfully between quarries and even between seasons at the same quarry, and these differences legitimately shift energy requirements independent of operational performance.
D
Treating the Benchmark as the Finish Line
Reaching a peer-average benchmark is a milestone, not an endpoint; plants that stop improving once they hit the industry average are typically overtaken again within a few years as the average itself moves.
Building the Business Case From Benchmark Data
A benchmarking report on its own rarely secures capital approval. What secures approval is a clear line from the current benchmark gap, through a specific proposed intervention, to a quantified financial return, presented in language a finance team can evaluate alongside every other capital request competing for the same budget.
The strongest business cases pair the benchmark gap with a phased implementation plan, since plant leadership is naturally more comfortable approving a smaller first phase with a clear payback than a single large multi-year commitment. A benchmarking exercise that identifies, for example, that preheater cyclone efficiency losses account for half of a plant's thermal SEC gap gives a much stronger starting point for a phased refractory and seal upgrade proposal than a vague statement that the plant should improve its energy performance generally.
It is also worth presenting benchmark gaps alongside their non-energy consequences where relevant. A clinker factor sitting well above best-available-technology, for instance, does not only cost more in raw materials and thermal energy, it also increases the plant's exposure to future carbon pricing or emissions regulation, a dimension that is increasingly relevant to how capital committees evaluate long-term risk in cement operations.
Frequently Asked Questions
What is BAT benchmarking and how does it differ from peer benchmarking?
Best-available-technology, or BAT, benchmarking compares a plant against the theoretical minimum achievable with the most energy-efficient commercially available equipment and processes, essentially representing the ceiling of what current technology allows. Peer benchmarking instead compares a plant against facilities with similar configurations, raw materials, and product mix, which gives a more immediately actionable target since it accounts for constraints a specific plant cannot easily change. Most mature benchmarking programs track both, using BAT to understand the long-term ceiling and peer comparison to set realistic near-term targets, since a target set purely against BAT can feel unattainable while a target set purely against peers can leave real savings unclaimed.
How often should a cement plant run a full benchmarking exercise?
An annual full benchmarking review against external peer and BAT data is common practice, but the underlying KPIs themselves, thermal SEC, electrical SEC, and OEE in particular, are worth tracking monthly or even in near real time internally. Waiting a full year to discover a KPI has drifted means an entire year of accumulated cost before the drift is even identified, let alone corrected, which is why leading plants pair an annual formal benchmark with continuous internal tracking between reviews, treating the internal dashboard as the early warning system and the annual review as the calibration check against the outside world.
Why does clinker factor matter so much in overall plant benchmarking?
Clinker production is both the most energy-intensive and the most carbon-intensive stage of cement manufacturing, so a lower clinker-to-cement ratio directly reduces thermal energy consumption, raw material cost, and emissions simultaneously. Plants that substitute a larger share of clinker with supplementary cementitious materials like fly ash or slag, while still meeting strength and quality standards, often see one of the largest single improvements available across the entire KPI set, though availability of quality-compliant substitute materials can be a real constraint depending on region.
Can a plant benchmark accurately without global industry data access?
Internal benchmarking against a plant's own historical performance is always possible and valuable on its own, since it reveals whether current initiatives are actually moving the needle. External peer and BAT comparison typically requires either participation in an industry benchmarking consortium, engagement with an engineering consultancy that maintains cross-plant data, or use of published sector data from bodies tracking global cement energy performance. Teams unsure where to start can review benchmarking approach options through
a support conversation before committing to a specific methodology.
What is usually the fastest KPI to improve once a benchmarking gap is identified?
OEE improvements are frequently the fastest to realize because a meaningful share of OEE loss typically comes from minor stoppages, slow restarts, and small quality rejects rather than major equipment failures, all of which can often be addressed through operational and maintenance process changes rather than capital investment. Thermal and electrical SEC improvements tend to take longer since they often require equipment upgrades or process reengineering, though even here operational tuning can capture a meaningful share of the total available gain before any capital project is needed. Plants can walk through a prioritized improvement sequence during
a benchmarking review session.
TURN BENCHMARKING GAPS INTO A PRIORITIZED PLAN
Find Out Exactly Where Your Plant Stands
Get a stage-by-stage breakdown of thermal SEC, electrical SEC, OEE, and maintenance cost against global benchmarks for your kiln technology and configuration.