Availability and performance get most of the attention in a cement plant's OEE review, but quality rate is usually the factor quietly capping the score. World-class plants hold a 98 to 99.5% quality rate — good tonnes divided by total tonnes produced — while the cement industry average sits closer to 94 to 97%, and quality-driven losses account for roughly 3 to 8% of total OEE loss on most lines. The single largest slice of that loss is off-spec material made in the first two to four hours after a kiln startup or grade change, not steady-state process drift. This post breaks down startup loss, transition loss, and process deviation loss individually, and shows how closing the gap between the lab and the control room lets a plant book a demo of the same real-time quality tracking.
BLOG · LOW OEE
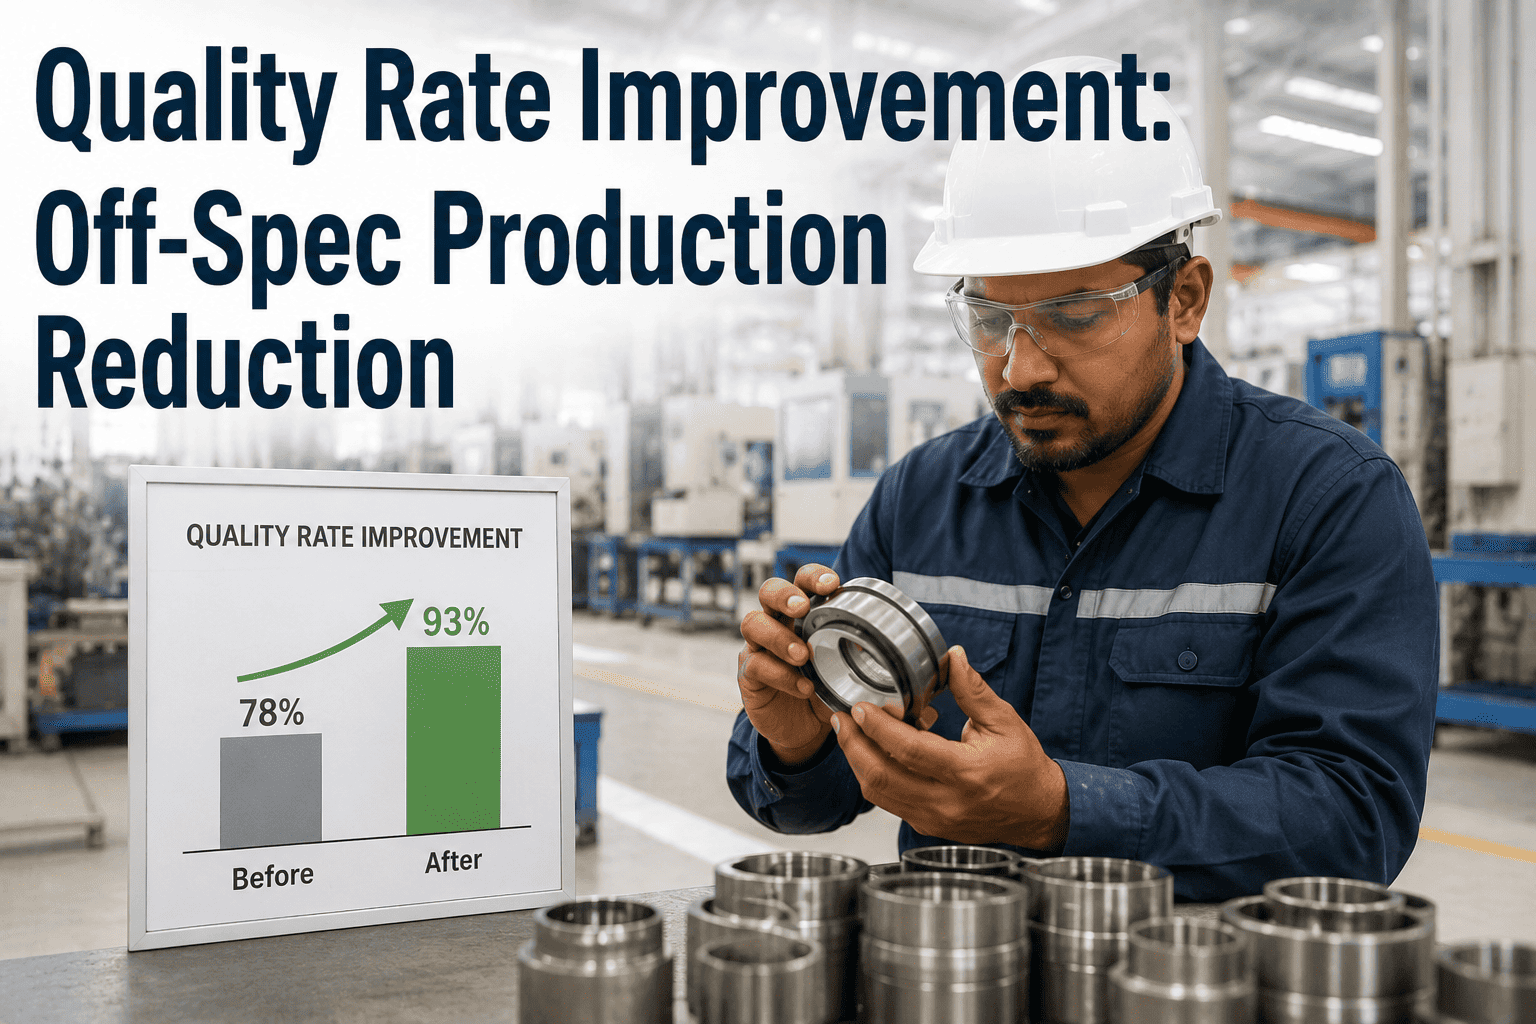
Quality Rate Improvement: Off-Spec Production Reduction
Startup loss, transition loss, and process deviation quietly erode the quality factor of OEE while everyone watches availability and performance. Here is where the tonnage actually goes, why it stays hidden until it's too late to act, and how to get it back.
94–97%
Typical cement plant quality rate
98–99.5%
World-class quality rate target
30–40%
Share of quality loss from startup alone
45–90 min
Optimized startup window, down from 3–4 hours
Quality Rate: The Overlooked Third of OEE
OEE is a multiplication, not an average, and that changes how a plant should think about fixing it. Availability, performance, and quality each act as a ceiling on the final score — a plant running 90% availability and 90% performance but only 95% quality does not land near 90% OEE, it lands at 76.9%. Most improvement programs chase availability first because breakdowns are visible and dramatic, get logged automatically in the CMMS, and generate a work order the moment they happen. Quality rate stays lower on the priority list because off-spec tonnes rarely trigger a stoppage — the line keeps running, the silo keeps filling, and the loss only shows up days later when the lab report or the downgrade decision arrives, long after anyone could have acted on it in the moment.
Quality looks like the strongest of the three factors on paper, which is exactly why it gets deprioritized — a 95% quality rate sounds close to solved next to an 87% availability score. But closing even three or four points of quality gap is often cheaper and faster than squeezing another point out of availability, because the fix is procedural and data-driven rather than capital-intensive.
Three Sources of Off-Spec Production
Nearly every off-spec tonne a cement plant produces traces back to one of three distinct causes, and each one needs a different fix. Lumping them together into a single "quality loss" line item is the most common reason improvement programs stall — a fix aimed at process deviation does nothing for startup loss, and vice versa.
SOURCE 01
Startup Loss
Material produced in the first two to four hours after a kiln relight, mill restart, or extended stop, while temperature, feed rate, and grinding parameters are still stabilizing. This single window typically accounts for 30 to 40% of a plant's total quality loss, especially on premium grades like 53-grade OPC where the specification tolerance is tighter, and it repeats every time the line comes back from a planned or unplanned stop — which makes it one of the most frequent, and most fixable, sources of off-spec tonnage on the entire loss register.
SOURCE 02
Transition Loss
Material produced while switching between cement grades or blends — PPC to OPC, or one strength class to another. Blending ratios, mill retention time, and separator settings all need to re-stabilize, and the material made during that window often falls between two specifications rather than clearly failing either one. Plants that schedule frequent grade changes to meet mixed-order demand accumulate this loss silently across dozens of transitions a month, and it rarely shows up as a single dramatic event on the shift report.
SOURCE 03
Process Deviation Loss
Off-spec material made during otherwise steady-state operation — raw material moisture spikes, fineness drift, free lime creeping past the control limit, or SO₃ wandering out of range between lab samples. Individually small, but continuous, and the hardest of the three to catch without between-sample monitoring, since nothing about the line's visible behavior changes while it happens — no alarm, no stoppage, just a slow drift that only becomes obvious once the next scheduled test comes back.
Startup Loss: The Single Biggest Quality Drain
Because startup loss accounts for the largest single share of quality-related OEE loss, it is also where the fastest win sits. A kiln relight or grade change does not need three to four hours of off-spec production to reach steady state — that window exists because most plants ramp up on fixed timers and operator judgment rather than a controlled, data-driven stabilization sequence. Shortening it does not require new equipment, only a clearer, real-time picture of when the process has actually crossed into specification.
BEFORE
3–4 hours
Manual ramp-up on fixed timers. Operators wait for temperature and feed indicators to look stable before releasing material to the good-product silo, erring toward caution because the alternative is a downgrade decision after the fact.
→
AFTER
45–90 minutes
AI-guided startup sequencing tracks the actual stabilization curve in real time and releases material to spec the moment process parameters cross the threshold — typically cutting transition time by up to 35% and saving 30 to 50 tonnes per startup event.
Loss Type Comparison: Cause, Impact, and Fix
Each loss type has its own detection challenge and its own corrective lever. The table below lines them up so a reliability or quality team can prioritize which one to attack first based on where their plant's loss profile is heaviest. None of the three shares are fixed — they shift with product mix, plant age, and how frequently the line stops and restarts — so the right first move is always to measure your own split before assuming the industry averages below apply directly to your operation.
Process deviation carries the largest combined share because it accumulates continuously rather than in a single visible window, and because most plants still test on a fixed lab sampling interval — often 30 to 60 minutes — which means a deviation can run for most of an hour before anyone downstream even knows it happened.
Why Off-Spec Losses Stay Invisible Until It's Too Late
The reason quality rate lags behind availability and performance on most improvement roadmaps is not that the losses are smaller — it is that they are slower to surface. A kiln trip is visible the instant it happens, shows up on the control room screen, and gets a work order within minutes. A slow drift toward the free-lime control limit is not visible until someone happens to look at the right trend line, and on most plants that "someone" is a lab technician working a fixed sampling schedule rather than a system watching continuously. The stages below show how much material can pass through the process before a single deviation is caught and corrected under a typical manual workflow.
T+0 min
Sample Taken
An operator or lab technician pulls a sample on the standard 30 to 60 minute interval. Production continues at whatever the current process settings are, regardless of where those settings sit relative to specification.
T+15–30 min
Lab Analysis Runs
Fineness, free lime, SO₃, or strength testing takes its own processing time. Meanwhile the kiln, mill, or blending station has already moved on to producing the next batch under the same unverified settings.
T+30–60 min
Result Reaches the Control Room
The test result reaches a shift supervisor or quality engineer, often through a manual log rather than a live feed, by which point another half hour to hour of material has already been produced under the same conditions.
T+60–90 min
Process Adjustment Finally Made
By the time feed rate, fuel mix, or grinding parameters actually change, the plant may have produced sixty to ninety minutes of material outside the tightest part of the specification window — all of it now heading toward a rework, blend-down, or downgrade decision that a real-time alert issued at T+0 could have avoided entirely.
See Your Own Quality Loss Broken Out by Source
Send a month of LIMS and production data and iFactory's team returns a loss breakdown across startup, transition, and process deviation — with the specific tonnage and revenue impact of each, mapped against your own product mix, before you commit to a pilot.
From Test-and-Reject to Predict-and-Prevent
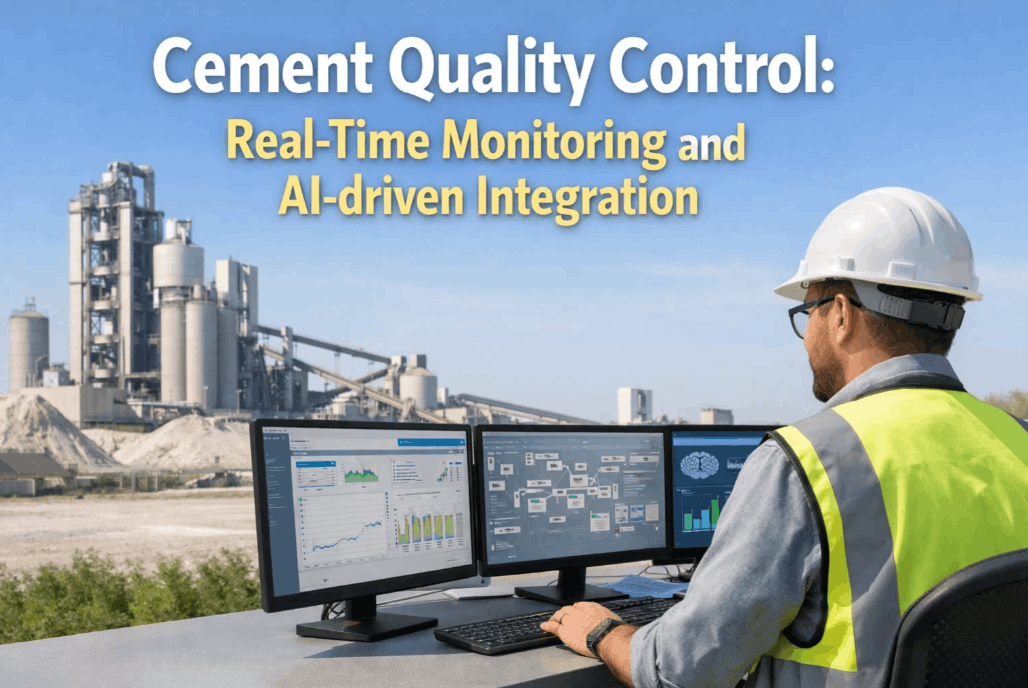
Traditional cement quality control samples material, tests it in the lab, and rejects or downgrades whatever falls outside spec — a process that only ever confirms a loss after it already happened. iFactory's platform integrates directly with the plant's LIMS to pull free lime, fineness, SO₃, compressive strength, and setting-time results and map them against live production batches, so drift becomes visible before it crosses the specification line rather than after.
A
Real-Time LIMS Integration
Lab test results map to production batches automatically as they come in, closing the gap between when a sample is tested and when the operator watching the kiln actually sees the result, instead of waiting for a manual log entry or an end-of-shift summary to carry that information forward.
B
Drift Alerts Before Spec Breach
When any quality parameter trends toward its control limit, the system flags it while there is still time to adjust feed rate, fuel mix, or grinding parameters — before the batch actually goes out of spec.
C
AI-Guided Startup Sequencing
Ramp-up releases material to the good-product silo based on the real stabilization curve rather than a fixed timer, cutting the startup window from hours down to under ninety minutes in most deployments.
D
Automated Transition Blending
Material produced during a grade change routes intelligently into a lower-grade product instead of getting scrapped outright, recovering value from tonnage that would otherwise be a straight loss, and doing so without requiring a manual blend-ratio recalculation from the shift supervisor.
Right-First-Time: The Metric Behind the Metric
Quality rate answers a narrow question — did this tonne pass the test at the point it was checked. Right-first-time answers a broader one — did this tonne ship as originally intended, with no rework, no reblending, and no downgrade at any point in its production. A batch that gets caught mid-process and blended down into a lower-grade product still counts as "good tonnes" in a simple quality-rate calculation, but it represents lost revenue every bit as real as an outright reject, because the plant sold premium-grade capacity at a lower-grade price. The two metrics tend to move together, but the gap between them is where a plant's real financial exposure to off-spec production usually hides.
90–95%
Typical right-first-time rate at cement plants without real-time monitoring
95%+
Right-first-time target once startup, transition, and deviation losses are closed
₹50–100/t
Typical price gap between premium and downgraded product
Tracking right-first-time alongside quality rate gives a plant a truer picture of what off-spec production is actually costing, because it captures the revenue lost to a silent downgrade — not just the tonnes that failed the test outright. It is also the metric that shows up most directly in customer-facing terms: fewer grade substitutions, fewer contract-compliance conversations, and a more consistent product reaching the same customer shipment after shipment. Sales teams and account managers notice this shift even when they never see the underlying quality dashboard, because it translates directly into fewer complaint calls and a stronger reputation for consistency with the plant's largest institutional buyers, the kind of customers who notice batch-to-batch variation long before it ever appears on an internal report.
What Closing the Quality Gap Is Worth
Quality rate improvement rarely requires new capital equipment — most of the gain comes from data timing and process discipline, which is why the payback tends to be faster than availability-focused projects that need mechanical upgrades. Where an availability project might involve replacing a gearbox or upgrading a cooler grate, a quality-rate project is usually a matter of connecting existing lab and control-room data faster and giving operators a clearer signal earlier in the process — which is also why the figures below tend to hold up across plants of very different ages and configurations.
3–8%
Typical OEE points recoverable from quality alone
30–50 t
Tonnage saved per optimized startup event
35%
Cut in transition time with AI-guided sequencing
4–8 mo
Typical payback window for quality-focused deployments
On a mid-size 5,000 TPD line, moving quality rate from the industry-average 95% toward the 98–99% world-class band typically recovers several thousand tonnes of premium-grade product a year that would otherwise have been downgraded or reworked — value that shows up directly in realized price per tonne, not just in a KPI dashboard, and compounds further once the right-first-time gains from fewer silent downgrades are factored in alongside the direct tonnage recovery.
Frequently Asked Questions
The questions quality managers and production heads ask most often when they start tracking quality rate as a distinct OEE lever.
Why does quality rate matter more than it looks on the OEE dashboard?
Because OEE multiplies its three factors instead of averaging them, a few missing points of quality rate compound with existing availability and performance losses rather than sitting on top of them separately. A plant already losing ground on availability and performance gets hit hardest by quality loss on top of that, because the multiplication effect means the final OEE score drops faster than any single factor suggests on its own. Treating quality as a minor rounding error on the dashboard is usually the reason a plant plateaus below world-class OEE even after fixing its biggest breakdown problems. To see how quality loss is compounding with your specific availability and performance numbers,
book a demo with the iFactory team.
Is startup loss really worth fixing before process deviation loss?
It depends on which one is larger in your specific loss register, but startup loss is usually the faster win because it is concentrated, predictable, and procedural rather than continuous. A plant can typically implement AI-guided startup sequencing and see the tonnage impact within the first month, while reducing process deviation loss requires building out real-time LIMS integration and control-limit alerting across every parameter, which takes longer to fully operationalize. Most plants run both in parallel once the loss register makes clear how much revenue each one is actually costing, but if forced to choose a single starting point, startup loss usually offers the better first project because the fix does not depend on instrumenting every quality parameter across the plant — it depends on tracking one stabilization curve per startup event, which is a much smaller integration effort to stand up and prove out.
How much off-spec material can realistically be recovered through blending instead of scrapped?
A meaningful share of transition-loss material is not truly defective — it simply falls between two specifications rather than clearly failing either one, which makes it a strong candidate for automated routing into a lower-grade product rather than an outright loss. Startup-loss material is more variable and depends on how far into the ramp-up window it was produced, but even partial recovery through intelligent blending materially changes the economics of a startup event compared to treating every off-spec tonne as scrap. The key operational shift is deciding the blend destination automatically and immediately, rather than holding the material in a quarantine silo while someone manually works out where it can go — that delay is often what turns recoverable material into a written-off batch.
Does tighter quality monitoring slow down production or add operator workload?
No — the goal is the opposite. Real-time drift alerts are designed to reduce the manual sampling burden by flagging only the parameters actually trending toward a control limit, rather than requiring operators to interpret every lab result manually against every specification. Because alerts fire while there is still time to make a small adjustment, most plants find that fewer full stoppages and downgrade decisions are needed overall, which reduces total operator workload rather than adding to it — the team spends less time reacting to problems that have already become costly and more time making small corrections that prevent them from becoming costly in the first place.
What does iFactory need from our plant to start tracking quality rate this way?
iFactory connects to your existing LIMS, DCS, and SCADA systems using standard industrial protocols including OPC-UA, Modbus, and REST APIs, so no replacement of your current lab or control infrastructure is required. The platform operates as an intelligence layer that consumes data you are already generating and returns real-time drift alerts, startup sequencing guidance, and a loss register broken out by source, without asking your team to change how the lab records results or how operators log production data day to day. Contact
iFactory support to review the specific integration requirements for your LIMS and control system vendor.
STOP TESTING AND REJECTING. START PREDICTING AND PREVENTING.
Recover the Quality Points Hiding Inside Your OEE Score
Bring a month of LIMS and production data and iFactory's team will return a loss breakdown across startup, transition, and process deviation — with the tonnage and revenue impact of each, a right-first-time baseline, and a plan to close the gap toward world-class quality rate.