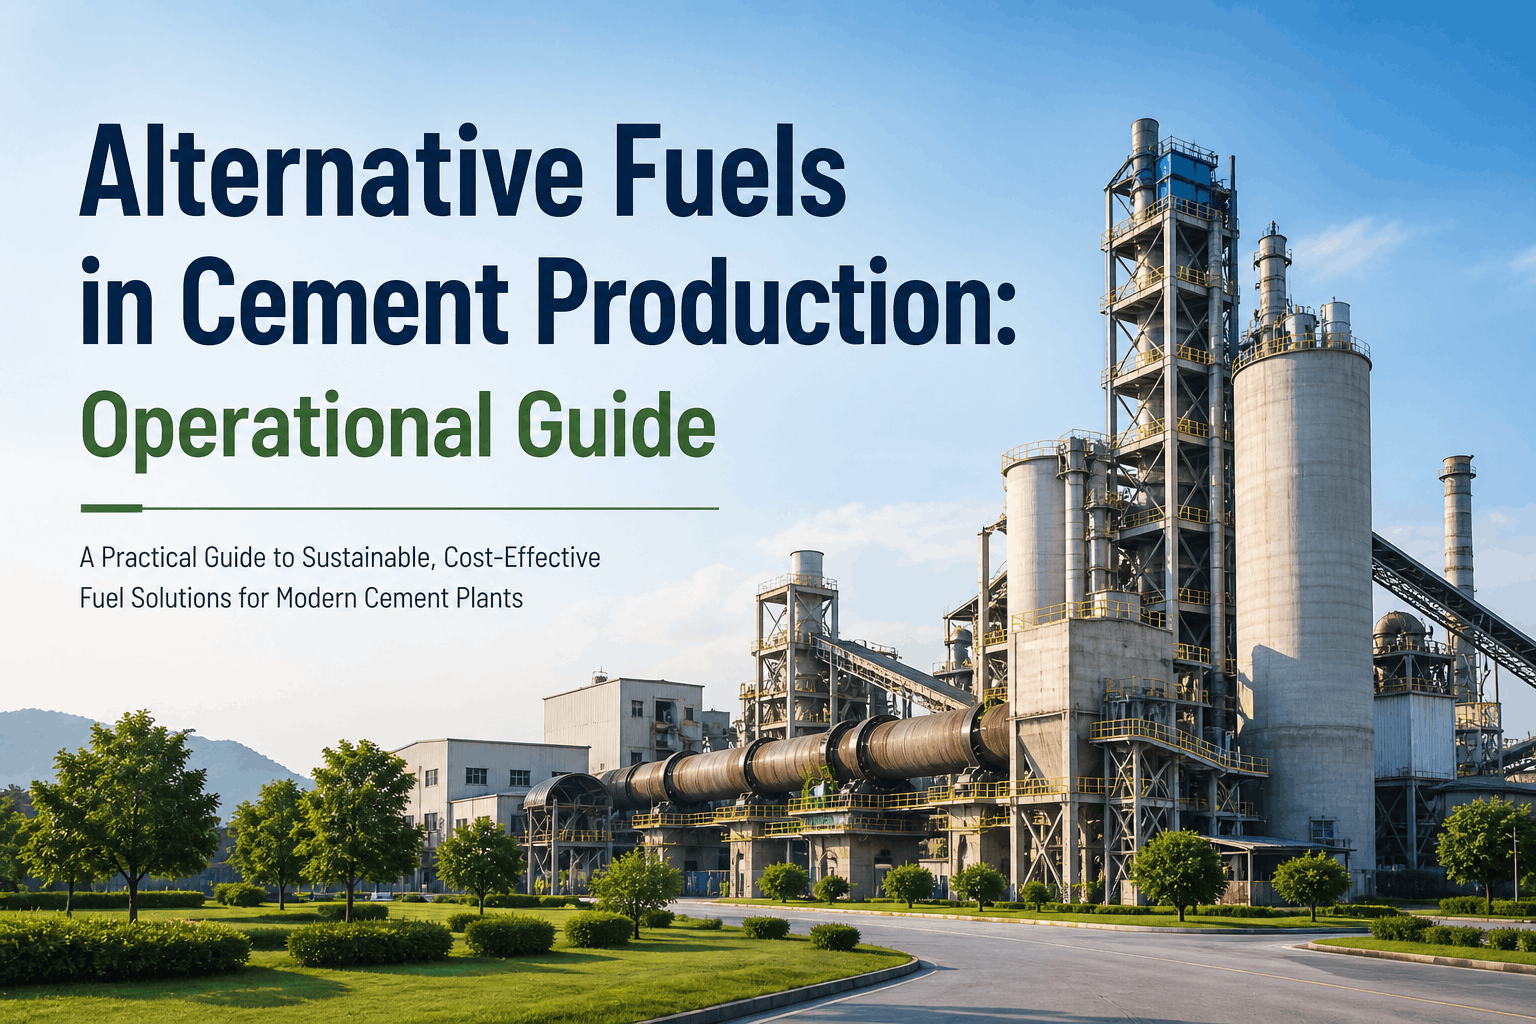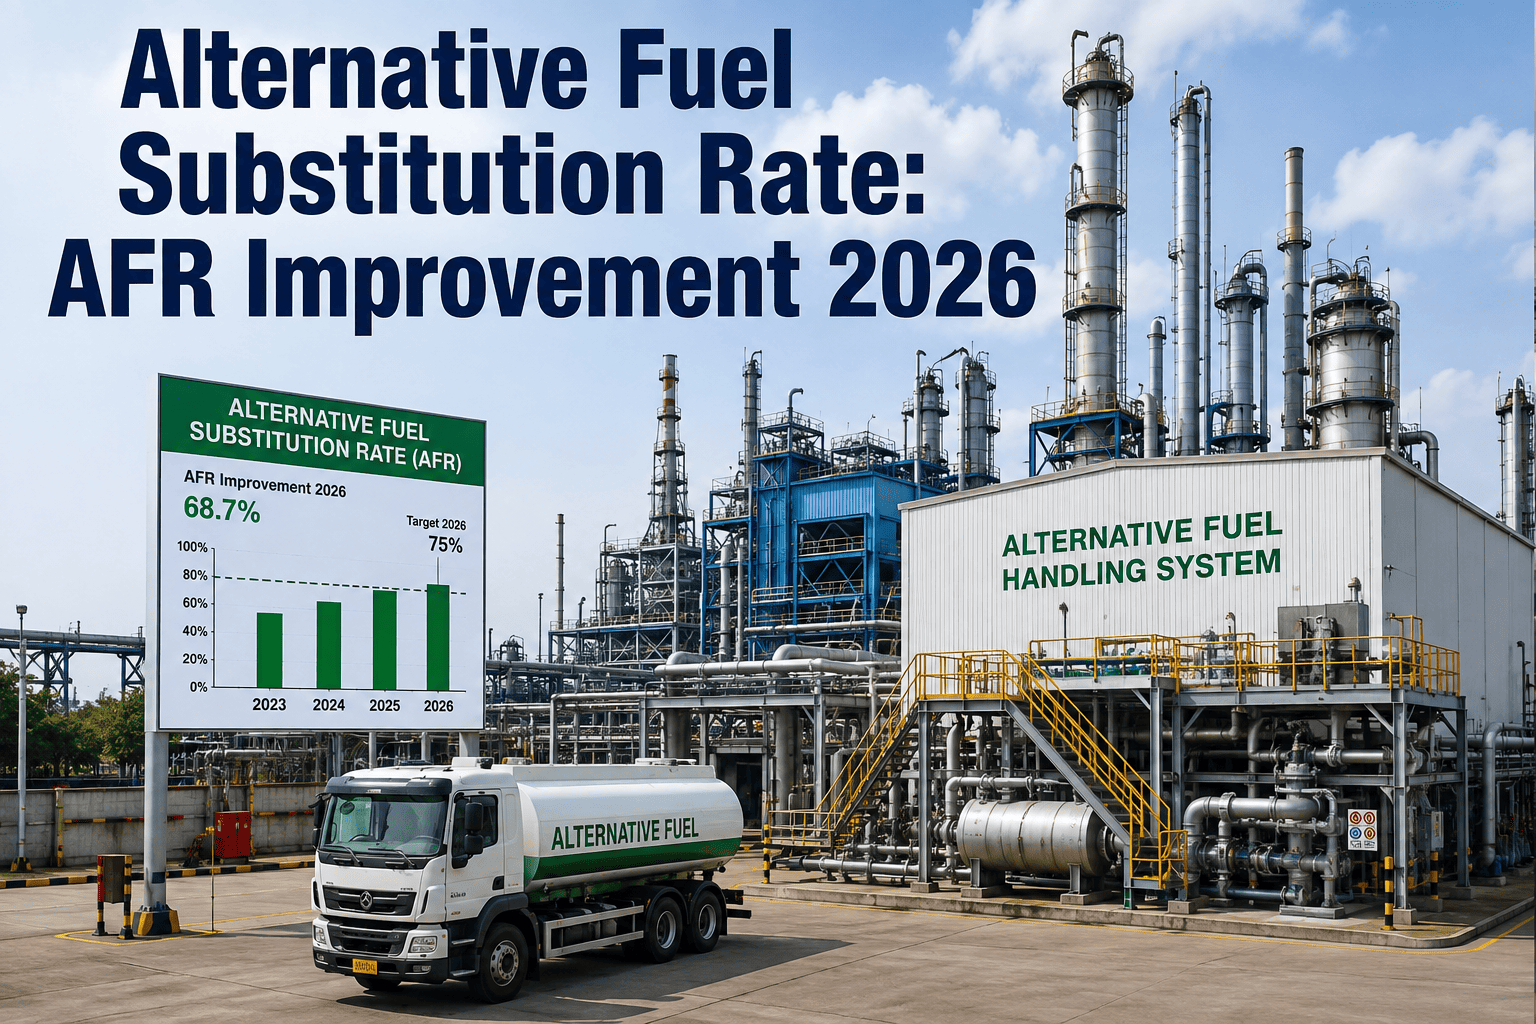
Most cement plants don't get stuck at a low alternative fuel substitution rate because alternative fuel isn't available, they get stuck because the fuel handling infrastructure, quality monitoring, and kiln control weren't built for the variability that shows up once substitution climbs past the easy first stretch. Getting from 10% to 30% thermal substitution rate feels manageable by feel and manual correction. Getting from 30% to 50% and beyond is a different operation entirely, and it's where most plants plateau for years without a clear roadmap. This walks through what actually needs to change at each stage, and a working session with our team can map where your kiln currently sits against that roadmap.
Cement · Fuel Optimization
Alternative Fuel Substitution Rate Improvement: A TSR Roadmap for Cement Kilns
A staged path from single-digit thermal substitution rate to 50%-plus, covering the fuel handling infrastructure, quality monitoring, and kiln control changes each stage actually requires before the next jump becomes safe.
18%
approximate global average TSR, versus 46%+ across Europe
30%
the point where manual fuel-rate correction stops being enough
$7.81/GJ
potential fuel cost savings reported at 50% TSR versus conventional fuel
Why TSR Stalls
The Gap Between 15% and 50% Is Rarely About Fuel Availability
Industry leaders including CEMEX, HeidelbergMaterials, and Holcim have already crossed the 30% thermal substitution rate mark, with several European operations running above 70% and some approaching full alternative fuel use. Holcim's own net-zero roadmap targets a 50% group-wide thermal substitution rate by 2030 and over 70% by 2050, and several of its European sites are already operating close to that long-term target today. Plants stuck below 15% almost always have access to the same refuse-derived fuel, tire-derived fuel, and biomass streams as the leaders do. What differs is feed system design, how tightly quality is monitored batch to batch, and whether the kiln control loop can react fast enough to a moisture or calorific value swing before it becomes a torque upset or a coating problem. Below roughly 20% substitution, an experienced operator can often manage RDF variability by feel, nudging fuel rates manually when something feels off. Past 30%, that same manual approach starts producing kiln behavior nobody can explain until someone traces it back to a fuel batch that arrived with moisture nearly double the prior week's average, which is exactly the point where a staged infrastructure and monitoring roadmap becomes necessary rather than optional. The plants that reach 50% and beyond didn't get there by raising a single dial; they moved through each stage below in order, closing the gap between what their fuel handling and monitoring could tolerate and what their TSR target actually demanded.
The Four-Stage Path
What Changes at Each TSR Stage Before the Next Jump Is Safe
Jumping straight to a 50% TSR target without passing through the earlier stages is how plants end up with coating buildup, free lime spikes, and preheater blockages that get blamed on the fuel itself rather than on skipping the groundwork the fuel needed.
1
0% - 10% TSR · Foundation
Start with the most consistent available stream, typically tire-derived fuel or waste oil, run structured trials with stack testing at set intervals, and build baseline data on how the kiln responds before layering in less predictable fuels.
2
10% - 30% TSR · Scale-Up
Introduce RDF and biomass in larger volumes, add dedicated storage and dosing infrastructure sized for real throughput, and move from occasional lab checks to routine batch-level moisture and calorific value testing.
3
30% - 50% TSR · Optimization
Manual fuel-rate correction stops keeping pace with variability here. This stage needs real-time feed adjustment tied to kiln thermal response, chlorine and sulfur tracking, and pre-processing investment to narrow the range of moisture and energy content arriving at the burner.
4
50%+ TSR · Advanced
Reaching the range where European leaders operate requires calciner-side substitution pushed toward 80-100%, multi-channel burner tuning, and continuous chemistry monitoring to hold clinker quality steady as fuel variability becomes the baseline operating condition rather than an occasional upset. Very few plants need to reach this stage to capture most of the available cost and carbon benefit, but for lines with the calciner capacity and grid access to support it, the fuel cost savings compound meaningfully beyond what the 30-50% range already delivers.
Find Out Which Stage Your Kiln Is Actually Ready For
A short roadmap review compares your current fuel mix, infrastructure, and kiln stability data against these four stages to show exactly what the next jump in TSR would require.
Fuel Handling Infrastructure
What Each TSR Range Actually Demands From Your Fuel Handling System
Infrastructure investment scales with substitution target, and trying to run a 40% TSR fuel mix through storage and dosing equipment sized for 10% is one of the most common reasons plants see instability they can't explain. Reported infrastructure spend for a meaningful TSR jump has ranged from a couple million dollars for incremental upgrades to the high single digits for a fuller storage, pre-processing, and dosing overhaul, with payback windows commonly landing between 18 and 36 months once fuel cost savings are factored in against the capital outlay. Fuel cost itself is usually the larger driver of that payback: alternative fuel has been reported at roughly a third to half the cost per unit of energy compared with conventional coal or petcoke, even after adding in the cost of pre-processing to get incoming waste streams to a usable specification. The table below lines up typical infrastructure requirements against TSR range.
| TSR Range | Storage & Handling | Feed & Dosing |
|---|---|---|
| 0% - 10% | Basic covered storage, single fuel stream | Manual or semi-automated dosing, low precision needed |
| 10% - 30% | Segregated storage by fuel type, moisture protection | Automated dosing with batch-level rate logging |
| 30% - 50% | Pre-processing capacity to blend and stabilize incoming fuel | Real-time feed rate control tied to kiln response |
| 50%+ | Multi-stream storage with quality segregation and buffering | Multi-channel burner dosing with calciner-side feed splitting |
Quality Monitoring at High AFR
The Fuel Properties That Have to Be Tracked Once Substitution Climbs
Stable co-processing at meaningful substitution rates generally needs fuel with net calorific value above roughly 14 MJ per kilogram and moisture held under about 15%, though tire-derived fuel can run considerably hotter than that baseline, often in the 26 to 33 MJ per kilogram range. Winter RDF moisture swings above 20%, sometimes past 30%, are exactly the kind of variability that quality monitoring exists to catch before it reaches the burner, since a single unflagged batch can undo weeks of otherwise stable kiln operation.
Moisture Content
Elevated moisture cools the flame and produces weakly burned clinker with elevated free lime, a direct path to downstream quality problems.
Net Calorific Value
Batch-to-batch swings in energy density force constant fuel rate correction; tracking NCV per load keeps the kiln's thermal input predictable.
Chlorine Content
High chlorine fuel streams demand continuous bypass monitoring to prevent preheater blockage from chloride buildup.
Ash & Sulfur
Ash chemistry can alter clinker mineralogy at high substitution, while sulfur variability affects SO2 emissions and requires tracking against permit limits.
What a Stalled TSR Actually Looks Like
Four Warning Signs a Plant Is Pushing Substitution Faster Than Its Controls Can Handle
These are the operational symptoms that typically show up when a plant increases alternative fuel substitution without the monitoring and control changes each stage requires, and they are frequently misattributed to the fuel itself rather than to the gap in how that fuel is being managed. Recognizing which symptom is showing up is often the fastest way to diagnose which part of the roadmap got skipped, since each one points back to a different missing piece of infrastructure or monitoring rather than a fuel quality problem that can't be solved.
Kiln Torque Swings
Unexplained torque variation traced back, batch by batch, to fuel moisture or density inconsistency the control loop wasn't reacting to fast enough.
Coating and Build-Up
Poor-quality or unsuitable AFR introduces variability in calorific value and volatiles that drives coating formation inside the kiln.
Free Lime Spikes
Moisture-cooled flame zones produce weakly burned clinker, showing up downstream as elevated free lime and inconsistent early-age strength.
Preheater Chloride Blockage
Chlorine-heavy fuel streams without continuous bypass monitoring can build up chloride deposits that restrict preheater gas flow over time.
Applied Example
How One Kiln Traced Unexplained Torque Swings Back to a Fuel Batch
A precalciner cement plant had been running RDF substitution comfortably below 20% for over a year, correcting for moisture swings by feel the way most operators do at that range. Once substitution climbed past 30% as part of a planned increase, kiln torque began swinging in a pattern operators couldn't immediately explain, since the manual correction habits that worked fine at lower substitution weren't catching the variability fast enough anymore. Digging into the fuel delivery records eventually traced the pattern back to RDF batches arriving with moisture levels nearly double the prior week's average, a shift no one had flagged because testing was still running on a periodic lab schedule that lagged a day or more behind the fuel actually reaching the burner. The fix wasn't more frequent lab testing on its own, it was tying real-time feed rate adjustment to the kiln's actual thermal response instead of relying on lab results that were already outdated by the time they reached the control room. Within a few weeks of that change, the same torque pattern stopped recurring even as the plant continued receiving fuel batches with similar moisture variability, because the control loop was now reacting to the variability as it arrived rather than a day after the fact.
Before You Push TSR Higher
What to Confirm Before Committing to Your Next Substitution Target
Answering these honestly before setting a new TSR target keeps the next increase from becoming the one that triggers a quality or stability problem, and gives your team a documented baseline to measure progress against once changes are made.
| Question | Why It Matters |
|---|---|
| What is your current TSR and how long has it held steady at that level? | Establishes the actual starting stage on the roadmap, not the target on paper |
| How is fuel moisture and calorific value tested — periodic lab or real-time? | Determines whether variability gets caught before or after it reaches the kiln |
| Is storage and dosing infrastructure sized for the target TSR or the current one? | Undersized infrastructure is one of the most common causes of stalled substitution |
| What chlorine and sulfur limits apply to your fuel streams and permit conditions? | High-chlorine fuel without bypass monitoring risks preheater blockage |
| How quickly can fuel feed rate actually respond to a kiln thermal shift? | Manual correction speed is the ceiling on how much variability the kiln can absorb |
Common Questions
AFR and TSR Improvement — Frequently Asked
These are the questions cement plant energy and process teams tend to raise first when planning the next stage of an alternative fuel substitution program.
What TSR is realistic for a plant just starting with alternative fuels?
Most operational guidance recommends beginning around 5% to 10% thermal substitution using the most consistent available stream, typically tire-derived fuel or waste oil, before layering in more variable streams like RDF or biomass. This staged start protects clinker quality and kiln stability while the plant builds real operating experience with alternative fuel handling rather than jumping straight to a headline TSR number. European operators now average above 50% substitution, which shows the ceiling is far higher than the 10-15% many plants assume is the practical limit. Book a review to map a realistic first-year TSR target for your kiln.
Why does the same fuel variability feel manageable at 20% TSR but not at 40%?
At lower substitution, alternative fuel is a smaller share of total thermal input, so a moisture or calorific value swing in that fraction gets diluted by the more consistent conventional fuel still carrying most of the load. As substitution climbs, alternative fuel becomes a larger share of total energy input, so the same percentage swing in fuel quality has a proportionally larger effect on kiln stability. Past roughly 30% substitution, fuel variability stops being an occasional upset an operator can ride out and becomes the baseline condition the control system has to manage continuously. Contact our team to see how real-time feed control changes that math.
Does higher TSR always mean lower clinker quality?
Not when the substitution is properly matched to monitoring and control capability, but quality risk rises sharply when TSR is pushed ahead of that capability. High-quality fuel selection, moisture and calorific value tracking at the batch level, and feed systems that can react to kiln thermal response in real time are what keep clinker mineralogy and free lime stable even at high substitution rates. Plants that skip straight to an aggressive TSR target without those controls are the ones that see coating build-up, reduced kiln efficiency, and compromised clinker quality that then gets blamed on alternative fuel generally rather than on the missing groundwork. Book a demo to see quality tracking modeled against your current fuel mix.
What's the typical payback on fuel handling infrastructure investment?
Infrastructure investment for meaningful TSR increases has been reported in the range of a few million dollars up to the high single digits, depending on scale, with payback periods commonly falling between 18 and 36 months once fuel cost savings are factored in. Alternative fuel typically costs meaningfully less per unit of energy than coal or petcoke even after accounting for pre-processing costs, so the payback math tends to improve as substitution rate increases toward the 40-50% range. The exact numbers depend heavily on local fuel availability, tipping fees, and existing infrastructure already in place, which is why a plant-specific estimate tends to matter far more than an industry-wide average. Ask our team for a payback estimate specific to your plant's fuel access.
Can AI-based monitoring actually raise TSR without adding kiln risk?
Yes, and this is where most of the gap between median and leading-producer TSR gets closed in practice. AI-based monitoring ties fuel quality data and kiln thermal response together in real time, catching a moisture or calorific value swing within the batch it arrives in rather than a day later on a lab report, and adjusting feed rate before that swing becomes a torque upset or a free lime spike. This turns fuel variability from an operational risk that caps how high TSR can safely climb into a variable the control system manages continuously as substitution increases. Book a session to see this kind of real-time control modeled against your kiln's history.
Move Past the TSR Plateau With Real-Time Fuel Quality Monitoring
iFactory tracks moisture, calorific value, and chemistry on every alternative fuel batch against your kiln's thermal response, so feed rate adjusts before variability becomes a torque swing, a coating problem, or a quality issue.