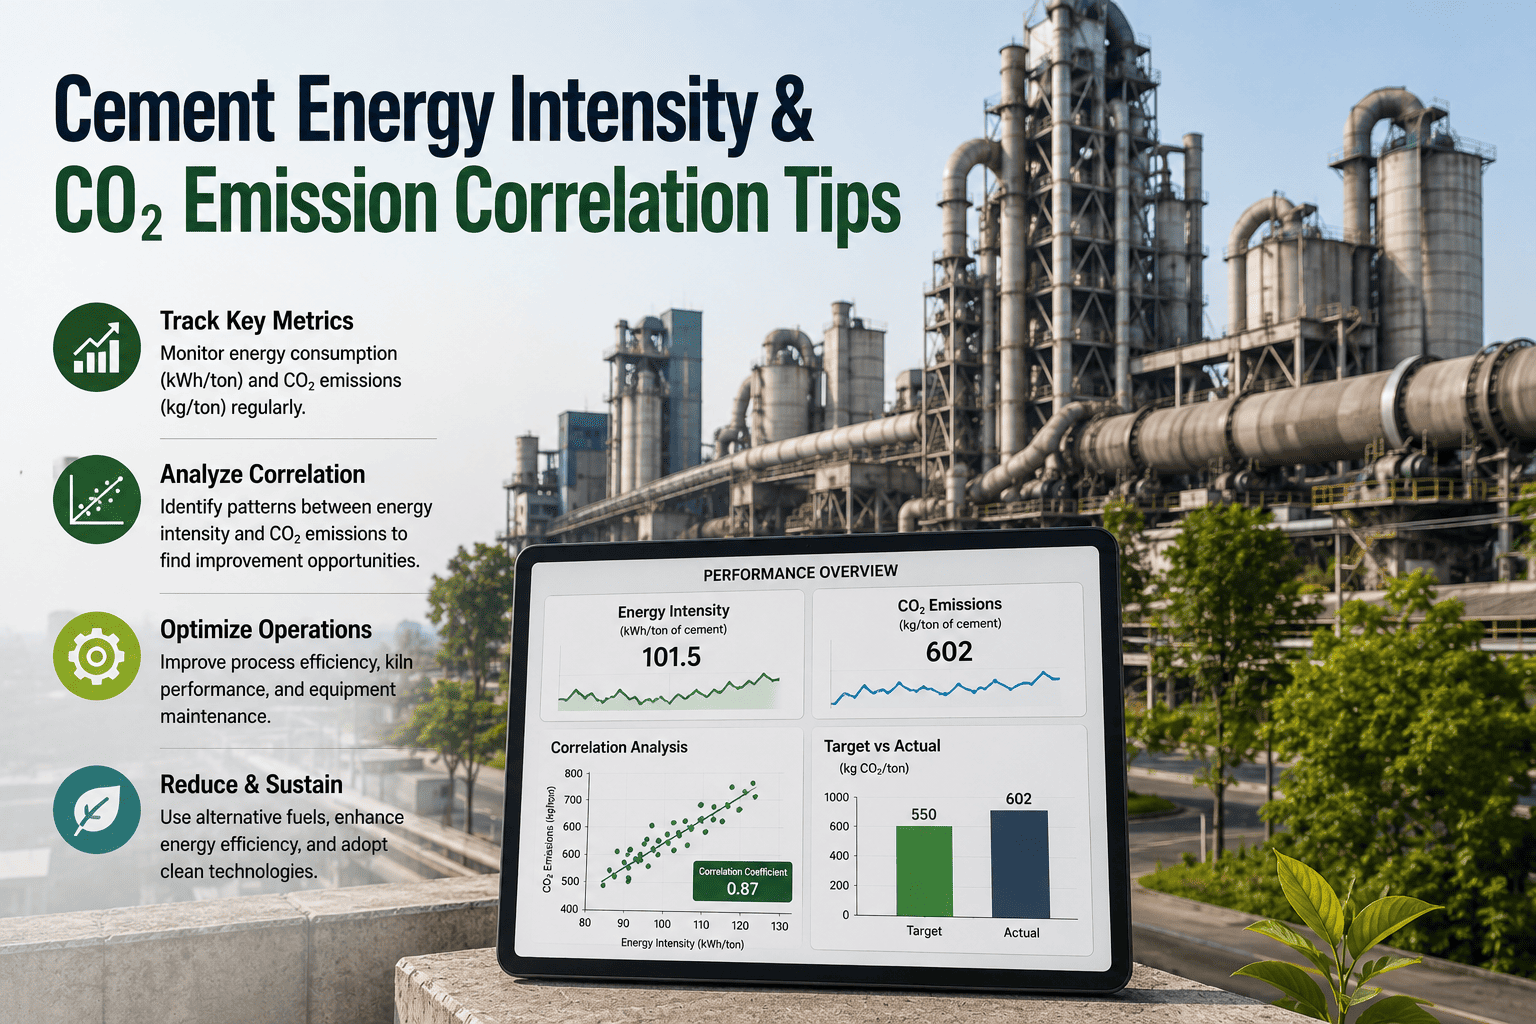
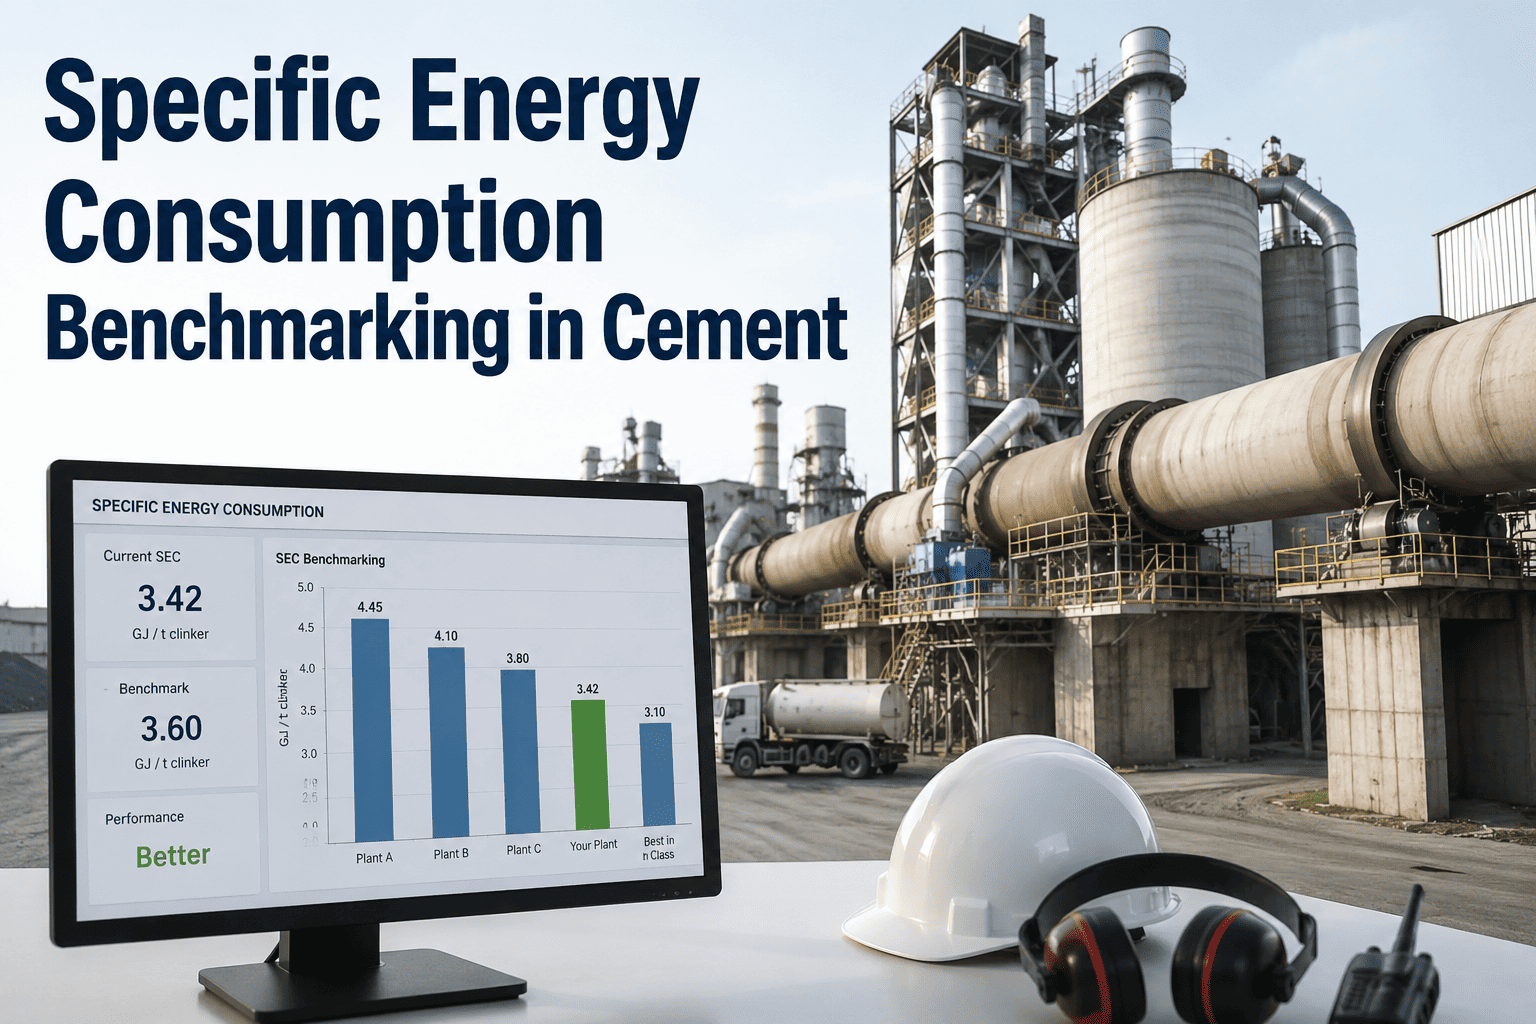
Specific energy consumption is the single number that best captures how efficiently a cement plant is converting raw material and fuel into finished product, expressed as kWh per tonne of cement on the electrical side and kcal per kg of clinker on the thermal side. Best-in-class modern dry-process plants with multi-stage preheaters achieve electrical SEC in the mid-80s to mid-90s kWh per tonne, while the global industry average sits closer to 110 to 120 kWh per tonne — a gap that represents real, recoverable cost for any plant sitting above the leading tier. Tracking that gap accurately requires the same discipline as continuous equipment-level energy monitoring, not an annual estimate reconstructed from utility bills.
Where Does Your Plant Sit on the SEC Curve?
Specific energy consumption varies widely across the global cement industry. Here's the range plants actually fall into, and what separates each tier from the next.
Two Numbers, Two Halves of the Energy Story
Specific energy consumption is reported as two related but distinct figures, and confusing them leads to a distorted picture of plant performance. Electrical SEC, measured in kWh per tonne of cement or clinker, captures grinding, fans, conveying, and other electrically driven equipment. Thermal SEC — often called specific fuel consumption — measured in kcal per kg of clinker, captures the fuel energy consumed by the kiln system to convert raw meal into clinker. A modern dry-process precalciner kiln typically achieves thermal SEC in the range of 700 to 770 kcal/kg clinker, while semi-dry kilns run higher and legacy wet-process kilns can run considerably higher still. A plant reporting a single blended "energy per tonne" figure without separating these two is hiding which half of the process actually needs attention.
Electrical SEC
kWh per tonne of cement or clinker, driven primarily by grinding circuit condition, fan efficiency, and conveying — commonly 85 to 150 kWh/t depending on plant technology and condition.
Thermal SEC
kcal per kg of clinker, driven by kiln heat balance, refractory condition, and cooler heat recovery — commonly 680 to 900 kcal/kg for dry-process kilns depending on configuration and condition.
Blended Figures Hide the Signal
A single combined energy-per-tonne number, while convenient for a finance report, obscures whether an efficiency gap sits on the electrical or thermal side — and each side requires a completely different fix.
The Four Benchmark Tiers
Normalization: The Step Most SEC Comparisons Skip
Comparing raw SEC figures across plants without adjusting for the factors that legitimately affect energy consumption produces conclusions that don't hold up. Raw material hardness, measured by the Bond Work Index, changes how much grinding energy a mill genuinely requires. Product fineness, measured in Blaine, has a direct effect on electrical SEC — a finer cement specification costs more energy to grind, and that's a product decision, not an inefficiency. Clinker-to-cement ratio changes thermal SEC per tonne of finished cement even when the kiln itself is running efficiently, because a lower clinker factor means less thermal energy embedded in each tonne of final product. Ambient temperature and altitude both affect achievable baselines in ways that have nothing to do with maintenance or operational quality.
A plant grinding hard limestone to a fine Blaine target will show a higher electrical SEC than a plant grinding soft chalk to a coarser target, even if both plants are running their equipment in excellent condition. Normalizing for these factors before drawing a conclusion is what separates a useful benchmark exercise from a misleading one that sends improvement effort in the wrong direction.
What Drives SEC Up When Equipment Isn't Actually Broken
SEC is directly influenced by maintenance quality, and this connection is closer than most energy reports acknowledge. Worn grinding media and degraded liner profile increase specific power consumption before any failure alarm would ever fire, sometimes by 15 to 20 percent above design specification. A misaligned kiln drive or a degraded cooler grate raises thermal SEC gradually, without ever producing a discrete fault event. A separator running below its design efficiency forces the mill to over-grind material to reach target fineness, consuming extra energy for no quality benefit. None of these conditions show up on a production report, because production output and quality both remain within spec — only the energy cost per tonne quietly rises.
| Condition | SEC Impact | Typical Detection Method |
|---|---|---|
| Worn mill liners / media | Electrical SEC rises 15–20% above design specification | Continuous power-per-tonne trending against design baseline |
| Degraded cooler grate plates | Thermal SEC rises roughly 8–12 kcal/kg per 50°C drop in secondary air temperature | Secondary air temperature trending alongside cooler condition inspection |
| Separator inefficiency | Extra grinding energy consumed with no fineness benefit | Circulating load and reject rate analysis |
| Kiln seal wear | Thermal SEC rises from false air ingress before mechanical failure is visible | Oxygen and draft trending at kiln inlet and outlet |
| Compressed air leaks | Electrical SEC rises from compressors running against artificially high demand | Off-shift baseline air demand monitoring |
A Composite Scenario: Closing an SEC Gap Without New Capital
A cement producer operating an integrated plant had been reporting electrical SEC consistently around 128 kWh per tonne of cement for over a year, roughly in line with what the team assumed was simply a normal outcome given the plant's raw material profile. When the plant began normalizing its SEC data against Bond Work Index and Blaine target rather than reporting the raw figure, the normalized comparison against a peer plant with a genuinely similar raw material and fineness profile showed the peer running closer to 108 kWh per tonne — a twenty-point gap that the plant's own team had been implicitly attributing to unavoidable raw material differences.
Digging into equipment condition data rather than raw material assumptions revealed the actual driver: the cement mill's separator had been running below its design efficiency for an extended period, forcing a higher circulating load and extra regrinding of material that had already reached acceptable fineness. Once the separator was recalibrated during a routine maintenance window, electrical SEC dropped to within a few points of the peer benchmark within the following month, without any change to raw material sourcing, product specification, or capital equipment. The gap the plant had assumed was structural turned out to be a maintenance and calibration issue the entire time — the kind of finding that only surfaces when SEC tracking is normalized and connected to underlying equipment data rather than treated as an isolated finance metric.
Your SEC Gap Has a Root Cause — Find It, Don't Guess It
iFactory connects normalized SEC tracking to the equipment condition data that actually explains the gap, so every kWh and kcal number points to a specific, actionable fix.
Turning SEC From a Report Into a Daily Signal
The plants that sustain a lower SEC over time treat it as a live operational signal rather than a monthly or quarterly report. A brief daily check of any section trending above its normalized baseline, a weekly ranking of the largest open SEC gaps by dollar impact, and a monthly review comparing progress against the four-tier benchmark keep the improvement program active long after the initial benchmarking exercise is complete. SEC drift is gradual by nature — equipment wears slowly — which means it's exactly the kind of problem that a periodic annual review catches far too late compared with a program that watches the trend continuously.
A quick daily look at which sections are trending above their normalized SEC baseline, catching drift while it's still small.
Open SEC gaps ranked by total dollar impact, directing improvement effort to the highest-value opportunity first.
Progress checked against all four benchmark tiers, confirming whether gains against historical best are translating into closing the gap toward peer and industry tiers.
Every corrective action rechecked against pre-fix SEC data to confirm the improvement held rather than quietly reversing as equipment wears again.
Alternative Fuel Substitution and Its Effect on Thermal SEC
Thermal substitution rate — the percentage of kiln thermal energy supplied by alternative fuels rather than coal or petcoke — has become an increasingly important part of the SEC conversation, and it complicates a simple year-over-year comparison in ways worth understanding before drawing conclusions. Leading cement producers now target substitution rates well above 40 percent, with some plants in more mature alternative fuel markets operating in the 60 to 80 percent range. Alternative fuels typically carry lower and more variable calorific values than conventional fossil fuels, which means a rising thermal substitution rate can push raw thermal SEC upward even while the plant is making genuine progress on its decarbonization and fuel cost goals.
This is exactly the kind of nuance that a normalized benchmark comparison needs to account for. A plant increasing its thermal substitution rate from 20 to 50 percent over a year will very likely show a thermal SEC increase in kcal per kg over that same period, and reading that increase as a maintenance or efficiency decline without accounting for the fuel mix shift would be a mistake. The correct comparison separates fuel-mix effects from genuine kiln efficiency effects, tracking each one on its own trend line rather than folding them into a single blended thermal SEC number that obscures which factor is actually driving the change.
Building an SEC Improvement Roadmap From the Benchmark Gaps
Once gaps are identified against all four benchmark tiers and normalized appropriately, the next step is sequencing the improvement roadmap by payback speed rather than by which gap looks largest on paper. Operational adjustments — recalibrating a separator, correcting an air balance, adjusting burner alignment — typically deliver results within weeks and require no capital outlay. Maintenance corrections — replacing worn liners, restoring cooler grate condition, repairing seals — usually take months and require planned downtime but modest capital. Equipment upgrades and technology replacements sit at the far end of the roadmap, delivering the largest single gains but requiring one to seven years of payback depending on scope.
Weeks: Operational Tuning
Separator recalibration, air balance correction, and burner alignment adjustments that require no capital investment and deliver results almost immediately.
Months: Maintenance Corrections
Liner replacement, cooler grate restoration, and seal repair that require planned downtime and modest capital but close a meaningful share of the SEC gap.
Years: Capital Upgrades
Grinding technology replacement or major process redesign, delivering the largest gains but requiring significant capital and multi-year payback horizons.
Reporting SEC in a Way Leadership Actually Trusts
An SEC figure that fluctuates unpredictably from month to month, without a clear explanation for the swings, tends to lose credibility with plant leadership over time, even if the underlying tracking methodology is sound. Building trust in the number requires consistently separating the factors that legitimately move it — raw material shifts, fineness targets, fuel mix changes, seasonal ambient conditions — from the factors that represent genuine equipment or operational performance. A monthly SEC report that walks through both categories, rather than presenting a single unexplained figure, gives leadership the context needed to act on the number rather than dismiss an unfavorable month as noise or, worse, chase a favorable month that was actually just a product mix effect.
This same discipline pays off when justifying capital requests. A maintenance team asking for budget to address a grinding circuit SEC gap has a much stronger case when the request is backed by normalized, equipment-linked SEC data showing exactly how much of the gap traces to liner wear versus how much traces to raw material or product mix differences that no maintenance spend could ever close. Vague appeals to "our SEC is high" rarely secure budget; a specific, normalized, equipment-linked case usually does.
The same logic extends to how SEC improvement gets recognized internally. Teams that can point to a specific, verified before-and-after SEC change tied to a specific corrective action build a track record that makes the next capital request easier to approve, while teams that only ever report a blended plant-wide figure struggle to demonstrate which of their initiatives actually moved the number. Over several improvement cycles, this difference compounds — plants with disciplined, normalized, equipment-linked SEC reporting tend to secure ongoing investment in reliability and efficiency programs more consistently than plants reporting a single opaque figure once a quarter, since every future request can point back to a documented history of results rather than starting the credibility conversation over from scratch each time.
Frequently Asked Questions
The questions below reflect what plant managers and energy engineers most often ask once they start benchmarking their own SEC data against the four reference tiers, whether for the first time or as part of an established annual review.
What is considered a good specific energy consumption for a cement plant?
Best-in-class modern dry-process plants with multi-stage preheaters and efficient grinding technology achieve electrical SEC in the range of 85 to 95 kWh per tonne of cement, while best-practice plants on a clinker basis target below roughly 105 kWh per tonne. The global industry average sits closer to 110 to 120 kWh per tonne, and plants running above about 135 kWh per tonne are typically considered to have significant improvement potential. Book a demo to see how your normalized SEC compares against these tiers.
What is a typical thermal SEC for a modern kiln?
A modern dry-process precalciner kiln typically achieves specific fuel consumption in the range of 700 to 770 kcal per kg of clinker, with best-practice plants running closer to 680 kcal/kg. Semi-dry kilns generally run higher, in the 800 to 900 kcal/kg range, and legacy wet-process kilns considerably higher still. Visit support to see how thermal SEC is tracked and benchmarked by kiln zone.
Why does my plant's SEC look worse than a similar plant's published figure?
A raw, unnormalized SEC comparison is often misleading. Differences in raw material hardness, product fineness target, clinker-to-cement ratio, ambient temperature, and altitude all legitimately affect achievable SEC, and skipping normalization for these factors can make a well-run plant look inefficient simply because it's being compared against a plant with an easier raw material and product profile.
Is a high SEC always a sign of an equipment problem?
Not always, but it's worth investigating in most cases. SEC is directly influenced by maintenance quality — worn grinding media, misaligned drives, degraded cooler grates, and inefficient separators all raise SEC without necessarily triggering any other operational alarm, since production output and quality can remain within spec even as energy cost per tonne climbs. It can also rise for legitimate reasons such as a fineness target change or a higher alternative fuel substitution rate, which is why normalization matters before assigning a cause. Contact support to see how equipment condition data is connected to SEC tracking.
How often should SEC benchmarking be updated?
While a full four-tier formal benchmarking exercise is often run annually, the underlying SEC data should be tracked continuously rather than only reviewed at benchmark time. Continuous tracking catches gradual drift caused by wearing equipment well before it would show up in the next scheduled annual comparison, when the accumulated cost would already be significant. A monthly internal check against the plant's own historical best is a reasonable middle ground for teams not yet ready for full continuous tracking, and it still catches the majority of drift long before an annual review cycle would surface the same issue.
Stop Comparing Your SEC to a Number That Isn't Yours
iFactory tracks normalized, equipment-linked SEC continuously across your plant — so every benchmark comparison is fair, and every gap points to a fix you can actually schedule.