Depot catchment boundaries usually get drawn once, early on, and then inherited by every planner who comes after without anyone asking whether the stop density underneath them still matches where the boundary sits. A service area built around a suburb that has since tripled in delivery volume looks identical on the map to one that has not changed at all, right up until delivery time bands start slipping. Model your own catchments against current stop density.
Redraw Service Areas Around Where Volume Actually Is
iFactory AI models depot catchments against live stop density, service boundaries, and delivery time bands, so network decisions are based on current demand, not inherited lines on a map.
When a Catchment Stops Fitting Reality
Stop density shifts as neighborhoods grow, businesses relocate, and order patterns change, but depot boundaries rarely move at the same pace.
A catchment that made sense at launch can quietly become the reason delivery time bands slip in one corner of the territory while another depot runs under capacity a few miles away. Scenario modeling makes that mismatch visible before it shows up as a service complaint.
Two Catchment Scenarios, Side by Side
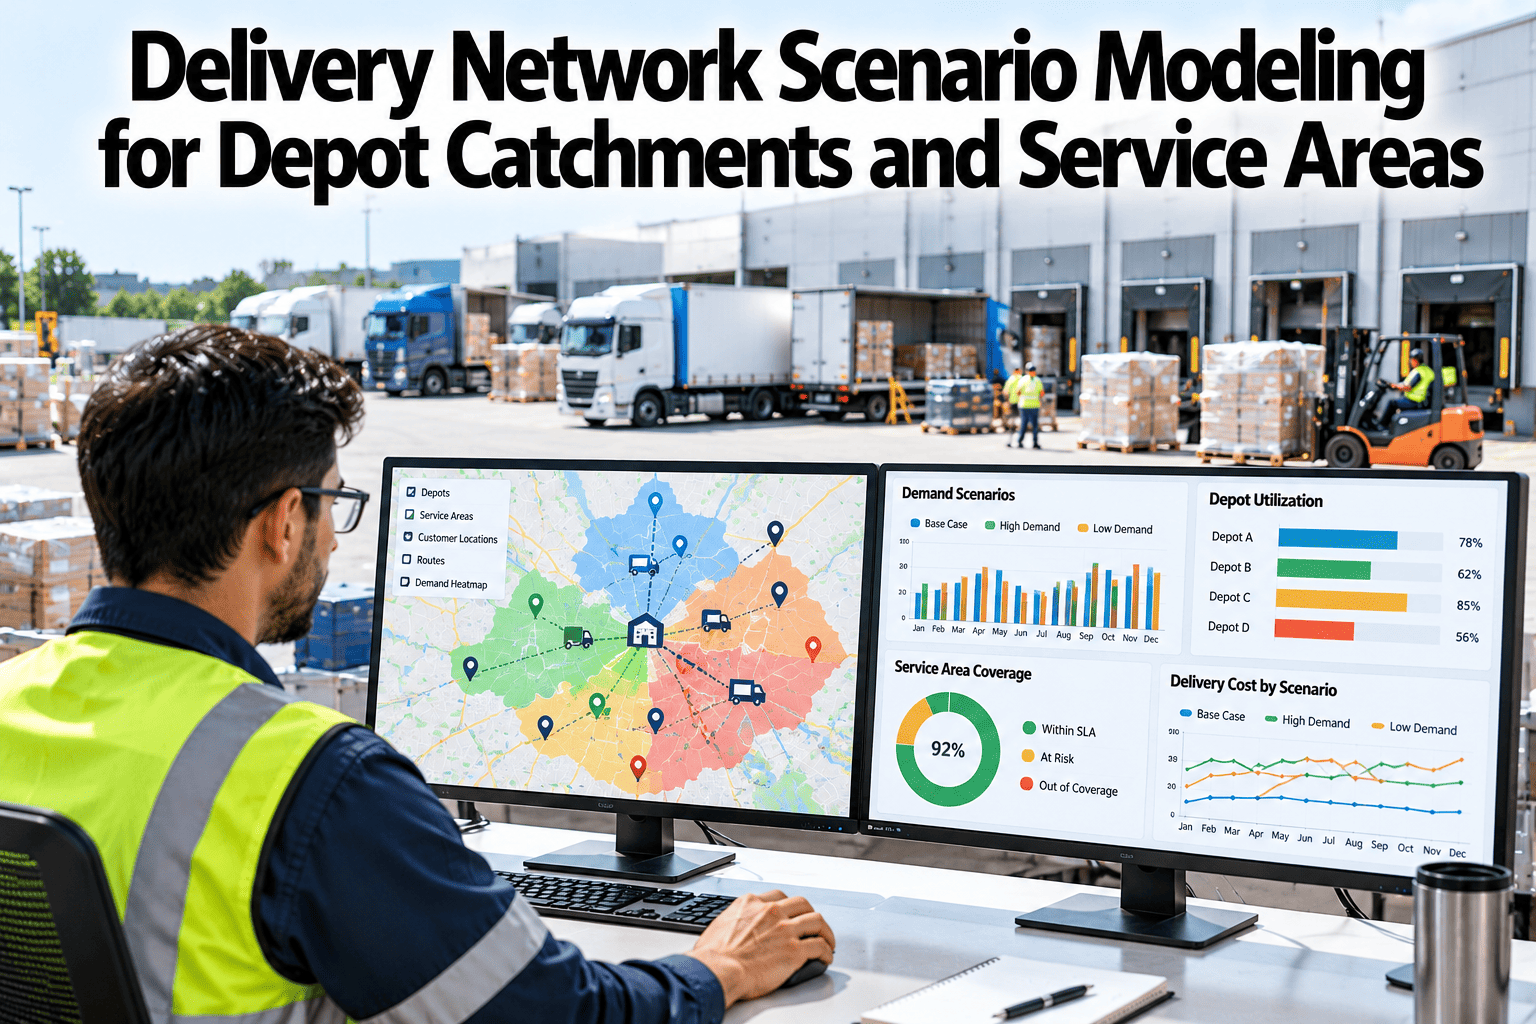
Comparing a current boundary against a stop-density-driven redraw makes the trade-off concrete.
Compare Your Own Catchment Scenarios
Book a 30-minute session and see a current-versus-redraw comparison for your own depot territory.
What Goes Into a Scenario
A useful catchment model weighs more than geography alone.
| Input | What It Shapes |
|---|---|
| Stop Density | Where route density supports a tighter or looser boundary |
| Delivery Time Bands | How boundary changes affect promised delivery windows |
| Depot Capacity | Whether a receiving depot can absorb shifted volume |
| Route Cost Model | Cost per stop under each scenario, not just total miles driven |
Reading the Cost and Service Trade-Off
Every catchment redraw moves cost and service in some direction. The scenario model shows which direction before a decision is made.
Where Scenario Modeling Feeds Into Decisions
Annual Network Review
Catchments re-tested against current stop density on a recurring schedule, not left static for years.
New Depot Justification
Projected catchment split and cost impact modeled before committing to a new facility.
Service Level Negotiation
Cost implications of a tighter delivery promise shown before it is committed to a customer.
Seasonal Flexing
Temporary boundary adjustments modeled for known seasonal demand shifts.
Getting It Running on Your Network
iFactory AI connects to your route, order, and depot capacity data to build scenario models from real stop-level detail.
Frequently Asked Questions
Does this automatically redraw our catchment boundaries?
No, the model presents scenarios with projected cost and service outcomes, and your team decides which boundary, if any, to implement.
How often should catchments be re-modeled?
Most networks benefit from an annual review at minimum, with an additional check whenever a territory sees a significant shift in order volume. Support can suggest a review cadence for your network.
Can this model a scenario with an added depot?
Yes, a hypothetical new depot location can be tested against current stop density to project how it would split an existing overloaded catchment.
Does the cost model account for seasonal volume changes?
Yes, scenarios can be run against both average and peak-season volume, since a boundary that works well most of the year may strain during a seasonal spike.
How accurate is the cost-per-stop projection?
Accuracy depends on how closely the route cost model is calibrated to your actual operating costs, which is set during deployment. Ask what inputs this would need in a walkthrough.
Draw Catchments Around Today's Volume
iFactory AI models depot catchments against live stop density and service time bands. Book a walkthrough to compare your own scenarios.