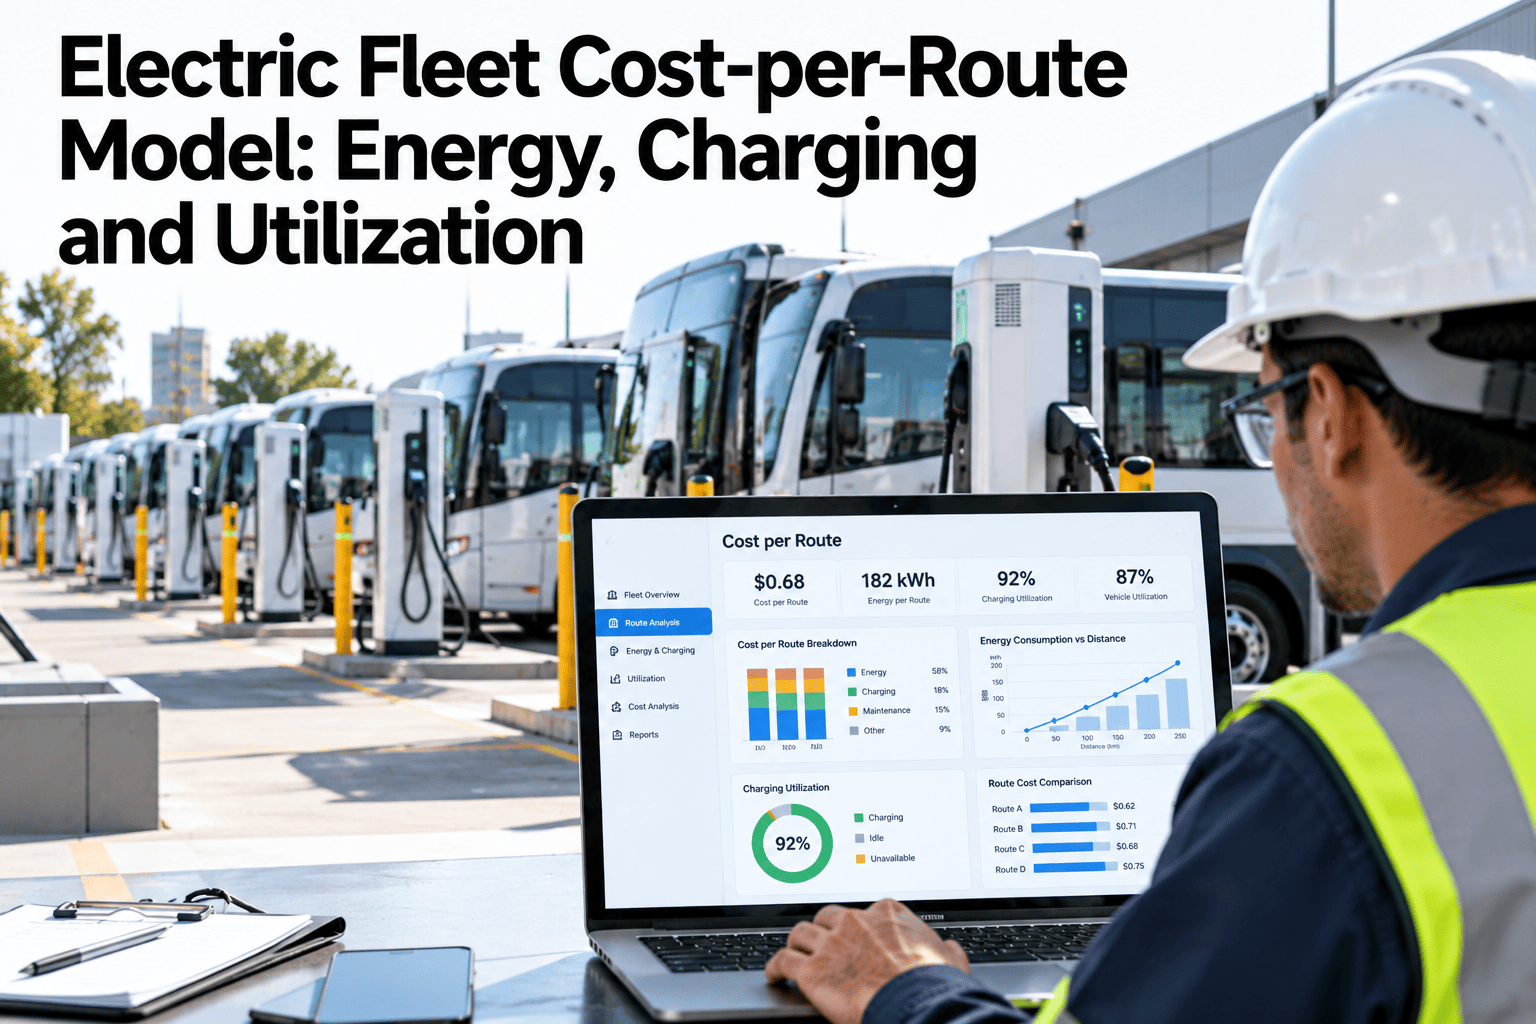
Running an electric delivery fleet changes the cost structure from fuel and oil changes to kilowatt-hours and charger amortisation. The shift is not complicated, but it does require a different model. A cost-per-route framework breaks the total operating expense into energy consumed, charging infrastructure allocated, vehicle utilisation and maintenance, and assigns each component to every route the fleet runs. That model gives operations leaders one number per route they can compare, optimise and forecast. Teams building their first electric route-cost model can book a session with iFactory AI to see how the platform structures the calculation automatically from telematics and charging data.
Electric Fleet Cost-per-Route Model: Energy, Charging and Utilization
Assess electric delivery operations using route range, payload, depot charging capacity and electricity tariffs. Build a per-route cost that replaces the fuel-card number your diesel model used.
Why Cost-per-Route Matters for Electric Fleets
Diesel fleets have a simple proxy for route cost: litres consumed times fuel price. Electric fleets do not have that single number because the cost of a kilowatt-hour depends on when the vehicle charges, what charger it uses, and how the demand charge is allocated across vehicles.
A cost-per-route model solves this by assembling four cost layers into one figure that operations can use for pricing, scheduling and capital decisions.
Energy layer
The kilowatt-hours the vehicle draws from the battery to complete the route, multiplied by the blended electricity rate at the depot. This layer replaces the fuel cost line in the diesel model and is the largest variable component.
Charging infrastructure layer
The capital and installation cost of depot chargers, amortised across the total number of charging sessions they will serve over their operational life. A Level 2 charger at $5,000 installed, serving 1,500 sessions over seven years, adds roughly $3.30 per session.
Demand charge layer
Utilities charge commercial customers for peak power draw, not just total energy consumed. When ten vehicles plug in at the same time after returning from routes, the demand spike can add $10 to $30 per kW to the monthly bill. Allocating that spike across routes is where most models get inaccurate.
Maintenance and battery layer
Electric vans carry lower per-kilometre maintenance costs than diesel, typically 40 to 60 percent lower, but battery degradation adds a long-term cost that should be spread across the routes that consume the charge cycles. A battery that loses 20 percent capacity after 1,500 full cycles has a per-cycle cost tied to the replacement price.
When all four layers are assigned to each route, the operations team can see which routes are profitable at current pricing and which need adjustment. That visibility is what turns an electric fleet from a sustainability initiative into an operating business with clear unit economics. Teams that want to see their own routes modelled can schedule a route-cost session with iFactory AI.
Energy Consumption: The Variables That Move the Number
The energy a vehicle uses on a route is not a fixed rate. It depends on at least five factors that change from route to route and season to season.
Route distance
The most obvious factor. A 120-kilometre suburban route consumes roughly twice the energy of a 60-kilometre urban route, but the per-kilometre rate differs because of speed profiles and stop frequency.
Payload weight
A fully loaded van at 80 percent of gross vehicle weight draws 15 to 25 percent more energy per kilometre than the same van running empty. The model needs a payload factor per route, not a fleet average.
Ambient temperature
Battery efficiency drops in cold weather and cabin heating draws directly from the traction battery. Winter routes in cold climates can consume 20 to 35 percent more energy than the same route in mild conditions.
Driving pattern
Stop-and-go urban delivery with frequent regenerative braking is more efficient per kilometre than highway cruise at 100 km/h where aerodynamic drag dominates. The consumption profile of a last-mile route is very different from a trunk route.
Elevation change
A route with significant uphill segments draws more energy on the climb than it recovers on the descent. Hilly terrain increases net consumption by 5 to 15 percent compared to a flat route of the same distance.
Vehicle age and battery health
A three-year-old van with 85 percent battery health draws more energy per kilometre than the same model when new, because the degraded cells work harder to deliver the same range. State of health should enter the model as a multiplier.
A model that uses a single fleet-wide kWh-per-kilometre figure ignores all of this variation and produces a route cost that is wrong for every route. The point of a per-route model is to capture the actual consumption for each route's conditions. iFactory AI pulls real energy data from the vehicle telematics system and builds the consumption profile per route automatically. Fleets that want to see their route-level data structured this way can contact iFactory support for a data integration review.
Electricity Tariff Structures and What They Mean for Route Cost
The price of a kilowatt-hour at the depot is not a single number. Commercial electricity tariffs have multiple components, and each one affects when and how the fleet should charge.
The most common mistake in fleet cost modelling is using the energy charge alone and ignoring the demand charge. In many cases the demand charge adds 30 to 50 percent to the effective cost per kWh when the fleet charges during peak demand windows. Smart charging software that staggers start times can flatten the demand peak and cut this component significantly. Teams that want to model their tariff structure against their route schedule can book a tariff modelling session with iFactory AI.
Charging Infrastructure Cost Allocation
Depot chargers are a capital investment that gets spread across the routes they support. The allocation method matters because it determines whether high-utilisation routes look cheap and low-utilisation routes look expensive, or whether the cost is smoothed across the fleet.
A fleet that runs one shift per day and returns to depot overnight needs Level 2 chargers and eight hours of dwell time. A fleet that runs two shifts needs DC fast chargers or a larger battery to survive the double shift without mid-day charging. The infrastructure choice cascades into the route cost model, and getting it wrong over-allocates or under-allocates capital to each route.
iFactory AI tracks charger sessions, vehicle assignments and energy delivered per session, then allocates the charger capital cost to the routes that used each charging session. The allocation is automatic and auditable. Fleets setting up depot charging can request an infrastructure planning session to size chargers against their route schedule.
Model Your Route Costs Live
Book a 30-minute session and iFactory AI will build a cost-per-route model from your telematics data, tariff schedule and charger configuration.
Utilisation: The Multiplier Most Models Ignore
A vehicle that completes two routes per day spreads its fixed costs, depreciation, insurance and charger allocation, across twice as many revenue-generating trips as a vehicle that runs one route. Utilisation is the lever that makes electric fleets economically competitive or not.
Routes per vehicle per day
The most direct utilisation metric. A vehicle completing 1.8 routes per day versus 1.2 routes per day has 50 percent higher utilisation and a proportionally lower fixed cost per route. Charging time between routes is the constraint that sets this number for electric vehicles.
Uptime percentage
Days the vehicle is available for dispatch divided by calendar days. A vehicle in for scheduled maintenance or waiting for a part is not earning routes. Electric vans typically achieve 92 to 96 percent uptime because of fewer moving parts and longer service intervals.
Range utilisation per route
The percentage of available range a route consumes. A route that uses 75 percent of the battery leaves less margin for a second trip than one that uses 40 percent. Over-specifying vehicle range wastes capital; under-specifying creates range anxiety and charging delays.
Charger utilisation
The percentage of available charging time a charger is actually dispensing energy. A Level 2 charger used 10 hours out of a 14-hour overnight window runs at 71 percent utilisation. Low charger utilisation means the depot is over-provisioned and each session carries more capital cost.
Tracking these four utilisation metrics per vehicle and per route lets the operations team identify where capacity is wasted and where it is constrained. A vehicle that consistently uses 90 percent of its range on a single route is a candidate for a shorter route assignment or a larger battery. A charger that sits idle every other night is a candidate for shared use with a second vehicle. These decisions flow directly from the utilisation data iFactory AI collects. Fleet managers ready to build utilisation into their cost model can arrange a data session with the iFactory team.
Maintenance Cost Assumptions for Electric Versus Diesel
The maintenance line in an electric fleet cost model is structurally different from a diesel model. Some cost categories drop sharply, some stay the same, and one new category, battery health management, appears.
| Cost category | Diesel delivery van | Electric delivery van | Impact on route cost |
|---|---|---|---|
| Engine oil and filter | Every 15,000 to 20,000 km | Not applicable | Removes a recurring cost entirely |
| Brake pads and discs | Every 40,000 to 60,000 km | Every 80,000 to 120,000 km | Regenerative braking cuts wear by 50 percent or more |
| Transmission service | Every 60,000 to 80,000 km | Minimal, single-speed gearbox | Near elimination of drivetrain service cost |
| Tyres | Every 40,000 to 50,000 km | Every 35,000 to 45,000 km | Heavier kerb weight accelerates wear slightly |
| Battery health check | Not applicable | Annual diagnostic, software update | New cost category, typically $200 to $400 per year |
| Coolant system | Every 80,000 km | Battery thermal management check | Similar cost, different components |
The net effect is a maintenance cost per kilometre that runs 40 to 60 percent lower for electric vans in most operating environments. The savings are larger for urban delivery with frequent stops and smaller for highway trunk routes where brake wear savings are minimal. Fleets transitioning from diesel can book a cost comparison session to see their actual maintenance data modelled side by side.
Building the Model: Inputs, Outputs and What to Watch
A practical cost-per-route model needs clean inputs and produces outputs the operations team can act on. The list below covers the essential inputs and the key outputs they produce.
Route telematics
Distance, duration, average speed, stop count and elevation profile per route per day from the vehicle GPS and CAN bus.
Energy per route
Actual kWh consumed per route, adjusted for payload and conditions, replacing the estimated fleet average.
Charger session logs
Start time, end time, energy delivered, peak power and charger ID for every session at the depot.
Charging cost per vehicle
Blended cost per kWh including energy rate, demand charge allocation and charger amortisation per vehicle per day.
Utility bill breakdown
Monthly energy charges, demand charges, time-of-use tiers and fixed service fees from the depot electricity account.
True cost per kWh
The fully loaded electricity rate that includes all bill components, not just the headline energy charge.
Maintenance records
Work orders, part costs, labour hours and vehicle odometer at each service event from the CMMS or fleet management system.
Maintenance cost per km
Rolling maintenance rate per vehicle that feeds into the per-route model and trends against vehicle age.
iFactory AI is smart manufacturing and industrial software delivered as a pre-configured NVIDIA AI server. For fleet operations it connects to telematics, charger management systems and utility accounts, then assembles the cost-per-route calculation automatically. Deployment to a working model typically takes six to twelve weeks. Fleet teams ready to scope the integration can book a scoping session with the iFactory team.
Frequently Asked Questions
How accurate is a cost-per-route model compared to a fleet-wide average?
A per-route model captures the actual energy consumed, the tariff in effect when the vehicle charged, and the specific maintenance costs of the vehicle that ran the route. A fleet average smooths over all of that variation and can be off by 20 to 40 percent on any individual route. The per-route approach gives operations leaders a number they can use for pricing decisions. Book a demo to compare per-route versus fleet averages on your own data.
Does the model account for demand charges?
Yes. iFactory AI reads charger session timestamps and correlates them with the depot's 15-minute demand intervals. The demand charge for each billing period is allocated to the vehicles and routes that contributed to the peak draw, so routes that charge during peak windows carry their true cost. Book a tariff modelling session to see demand allocation in practice.
Can the model handle mixed fleets with diesel and electric vehicles?
Yes. The platform models diesel vehicles using fuel purchase records and electric vehicles using charging data. Both feed into the same cost-per-route output, so the operations team can compare the cost of running a route on diesel versus electric with the same methodology. Book a session to see mixed-fleet modelling applied to your route network.
What data sources does iFactory AI need to build the model?
At minimum, the platform needs route telematics from the vehicle GPS or fleet management system, charger session logs from the depot charging management system and the monthly utility bill breakdown. Maintenance records from the CMMS add the maintenance cost layer. Most fleets already collect this data in separate systems. Contact support for integration details on your specific systems.
How long does it take to go from installation to a working cost model?
The turnkey NVIDIA AI server deploys in the depot, connects to data sources, and begins collecting route and charging data immediately. A baseline cost model is typically available within four to six weeks of data collection, with refinement as more data accumulates. Full deployment to a production cost model runs six to twelve weeks. Book a scoping call to map your deployment timeline.
Know What Every Route Actually Costs
iFactory AI connects telematics, charging and tariff data into a per-route cost model your operations team can act on. Book a session scoped to your fleet.