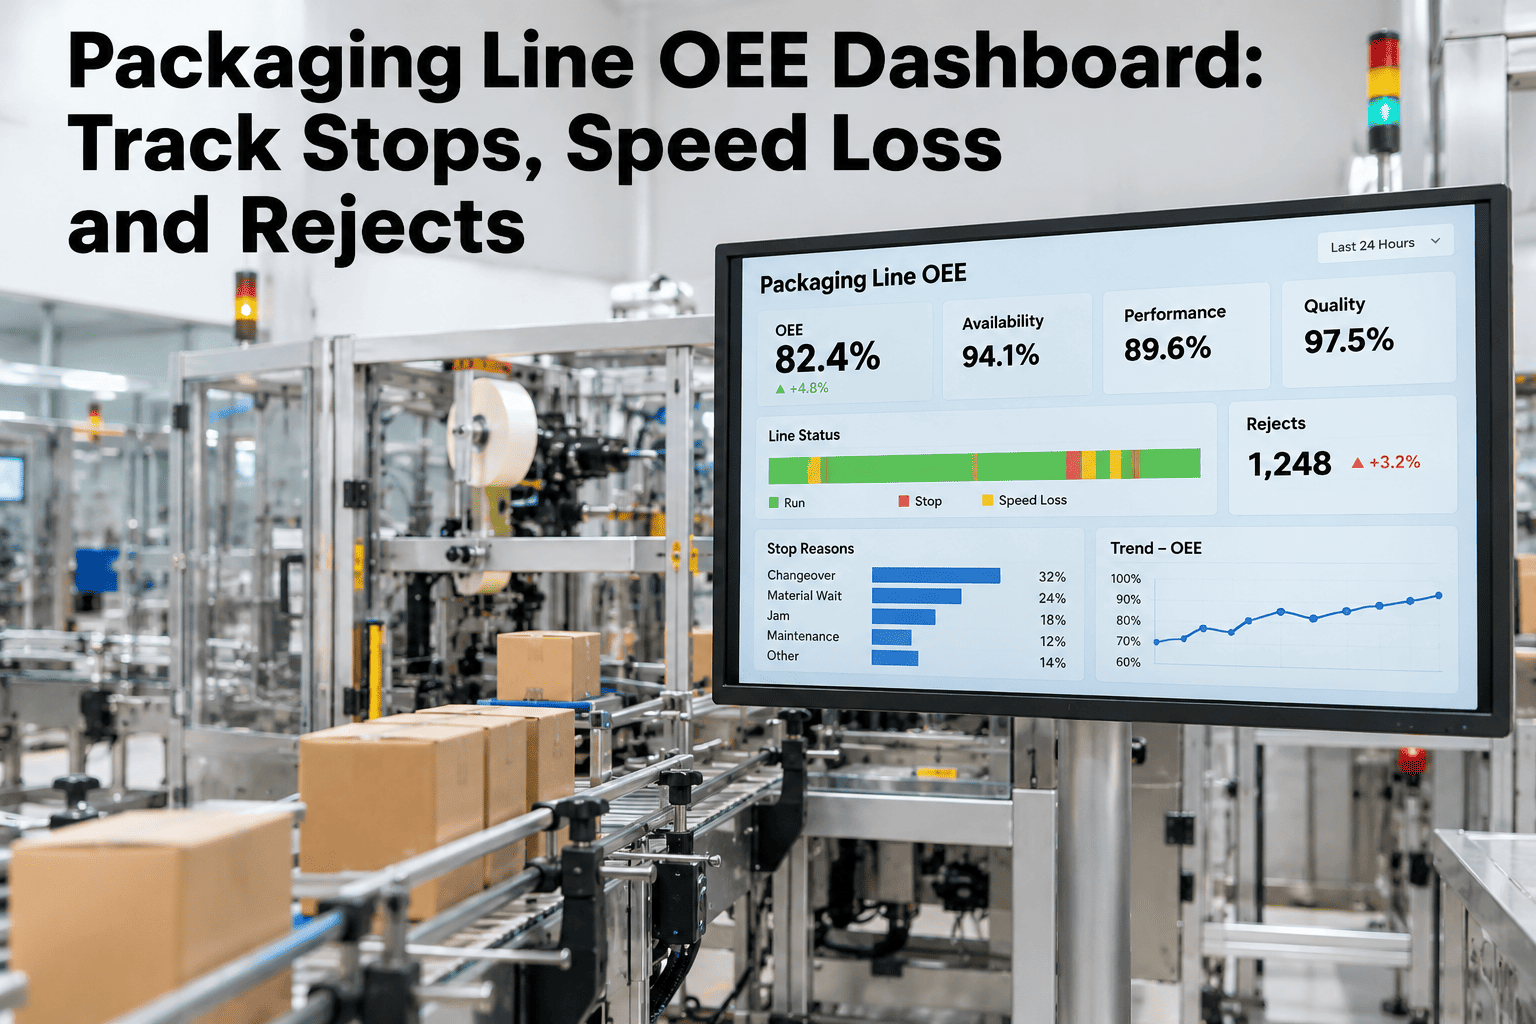
Industry benchmarks put the median packaging line somewhere around 60 percent OEE, with top-quartile lines closer to 75, and the gap between them is rarely one dramatic breakdown. It's hundreds of micro-stops under two minutes that never get logged, a line running at 90 percent speed that nobody questions because it's technically running, and a reject rate reviewed weekly instead of by shift. iFactory AI's packaging operations team can show where your own line's OEE is actually leaking against availability, performance and quality.
The Loss You Can't See Is the Loss You Can't Fix
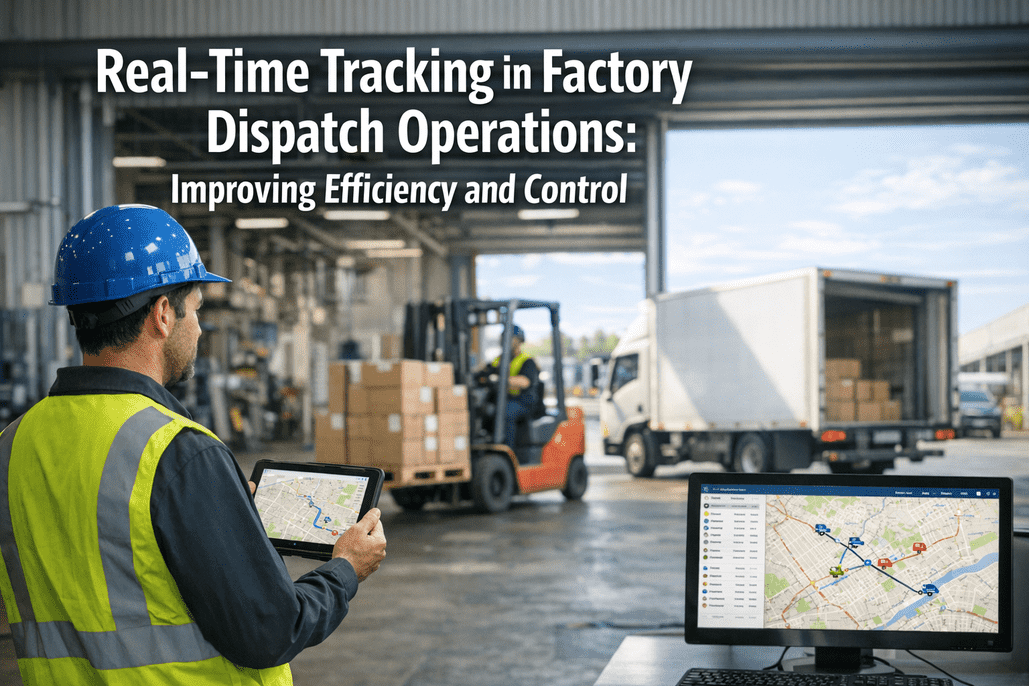
An OEE dashboard split into availability, performance and quality — with micro-stops, reject rates, shift comparison and a loss Pareto — turns invisible fragmented loss into a prioritized action list.
Why Packaging Lines Lose OEE Differently Than Heavy Equipment
A packaging line rarely fails catastrophically the way a furnace or a press might; instead it dies a death by a thousand small cuts — a jam cleared in ninety seconds, a sensor fault, a label misfeed — each individually trivial and collectively enormous. A line logging eight micro-stops an hour at roughly two minutes each loses well over an eighth of its available production time to events that, on paper, never happened, because nobody wrote them down.
Changeovers, sanitation windows and unlogged micro-stops eat the clock.
A line running at 90 percent speed loses more than most teams assume.
Rejects, giveaway and startup scrap after a changeover all count here.
Paper logs never capture stops under a few minutes, so they vanish from the record.
What Each OEE Bucket Actually Measures
Treating OEE as one number hides which of the three factors is actually costing the most. Our team can break down your current OEE into its three components before prioritizing a fix.
| OEE Factor | What It Captures | Common Blind Spot |
|---|---|---|
| Availability | Planned run time actually used | Micro-stops under 2 minutes, rarely logged on paper |
| Performance | Actual speed vs rated speed | A "running" line quietly losing speed nobody questions |
| Quality | Good units vs total units produced | Startup scrap after changeover, often uncounted |
Catching Micro-Stops the Paper Log Misses
PLC signal integration logs a stop the moment it happens, duration included.
Rank causes by total minutes lost, not by how memorable each stop was.
A stop type clustering around one SKU or one shift points to a specific fix.
See Your Own Micro-Stop Pareto
Connect one packaging line and see the stop types, shifts and products behind your real availability loss within the first few weeks.
Shift Comparison: Where the Real Gaps Hide
A Composite Scenario: The Line That Wasn't Actually Slow
Picture a packaging line flagged for a capital upgrade based on its OEE trailing similar lines elsewhere in the plant, with the assumption that the equipment itself was simply older and slower.
A shift-level breakdown of the same line's data showed the OEE gap was concentrated almost entirely in one shift, with a micro-stop rate roughly three times its counterparts on the same equipment. The capital request was shelved in favor of a targeted training and process review for that shift, which closed most of the gap at a fraction of the cost. The scenario illustrates the value of segmented data; actual findings depend on each line's own history.
Where iFactory AI Fits
iFactory AI captures every stop automatically through PLC signal integration, builds a loss Pareto by cause, correlates it against product and shift, and splits OEE into its three factors so a plant can see exactly where the next hour of recovered capacity is hiding.
Every micro-stop logged automatically, not estimated from a paper log.
Availability, performance and quality tracked and ranked separately.
Loss patterns tied to the specific conditions that cause them.
Frequently Asked Questions
Industry benchmarks put the median packaging line around 60 percent OEE, with top-quartile lines reaching roughly 75, which makes the top quartile a reasonable aspirational target rather than a fixed universal number. Benchmark your own line against similar equipment.
A single catastrophic failure gets noticed and fixed, but dozens of two-minute stops a shift accumulate into far more lost time while staying invisible on a paper log, which is why they're often the larger recoverable opportunity. Ask how micro-stops are captured on your line.
Availability loss means the line wasn't running at all, while performance loss means it was running but below its rated speed — a line can look healthy on an availability report while still losing meaningful output to a quiet speed gap. Review your own performance factor separately from availability.
The same three-factor structure applies everywhere, but which stop types and quality checks matter most varies by line and product, so the dashboard should be configured around each line's actual failure modes rather than a generic template. Discuss configuration for your specific lines.
Most pilots on a single line surface a usable stop Pareto and shift comparison within the first few weeks of connection, giving an early, prioritized view of where the biggest recoverable loss actually sits. Scope a pilot timeline for one of your lines.
Find the OEE Loss That Never Made It Onto Paper
iFactory AI captures every micro-stop, speed loss and reject automatically, splitting OEE into availability, performance and quality so you know exactly where to act first.