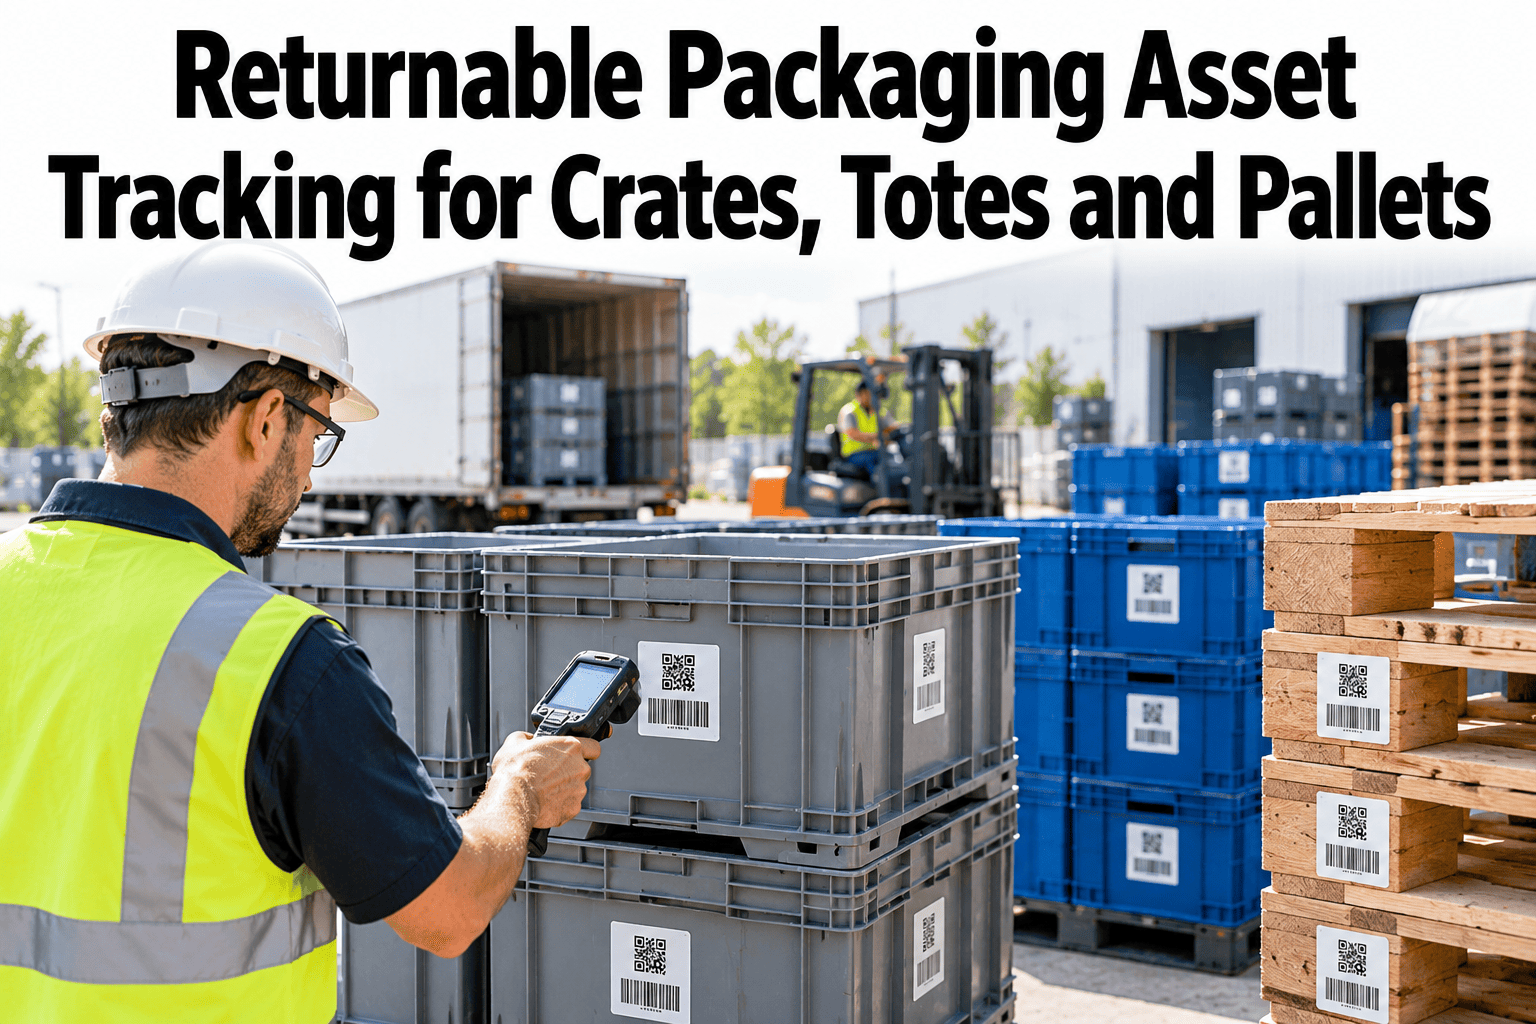
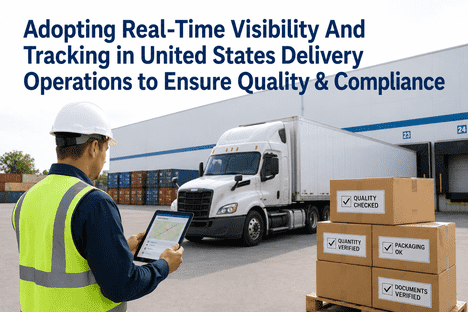
Crates, totes and pallets are expensive assets that leave the warehouse every day and return late, damaged or not at all. Many operations track them with spreadsheets and goodwill, so losses are only noticed when new stock has to be bought. Returnable packaging asset tracking gives each item an identity, records who holds it and shows when it is due back. The result is a smaller pool, fewer losses and fair charges for customers who keep assets too long. To see how this could work for your operation, you can review a returnable packaging tracking plan with our team.
Returns, reverse logistics and delivery claims
Know Where Every Crate, Tote and Pallet Is and When It Is Due Back
iFactory AI tracks returnable packaging by asset ID, customer and site, so losses are caught early and the asset pool can be sized with confidence.
Four things every asset record should answer
Who holds itSince whenDue back whenIn what condition
The hidden costPackaging Losses Rarely Appear on a Report Until It Is Too Late
Returnable packaging looks like a small cost per unit, yet fleets of crates, totes and pallets can represent a large investment. The cost is hidden because assets are rarely counted at the moment they leave or return.
Purchase
Replacing lost units adds to capital spend
Idle stock
Extra assets are bought to cover uncertainty
Disputes
Customers and carriers argue about who held what
Disruption
Shortages delay loading and deliveries
A simple tracking record turns these invisible costs into numbers a manager can act on.
Asset identityFour Ways to Identify Each Item
Tracking starts with a unique identity for each asset or group of assets. The right method depends on value, volume and how assets are handled.
| Method | Best for | Strength | Limit |
|---|
| Printed barcode or QR code | Totes and crates in high volume | Cheap and easy to scan | Labels can wear or be damaged |
| RFID tag | Pallets and high-value items | Reads without line of sight | Tag cost and reading conditions |
| Moulded or engraved ID | Long-life assets | Durable and tamper resistant | Needs a camera or manual entry |
| Batch tracking | Low-value, high-volume items | Low effort | Less precise, no unit history |
Match the method to the asset value. Tracking a cheap tote individually can cost more than the tote.
Chain of custodyFollow the Asset Through Four Hand-Offs
An asset passes through several hands in each cycle. Recording each hand-off shows where losses happen.
1
Issue
Assets are scanned out of the warehouse against an order.
2
Deliver
The customer confirms receipt of assets with the goods.
3
Collect
Empty assets are picked up and scanned at the customer site.
4
Return
Assets are scanned back in at the warehouse and checked.
Each hand-off creates a record. A missing scan at any step is a clear signal that something needs attention.
See Where Your Packaging Assets Really Are
Share your asset counts and customer lists and see how iFactory AI would build a custody record and flag assets overdue for return.
Customer and site custodyKnow Who Holds Your Assets at Any Moment
When assets sit at customer sites, the question of who is responsible becomes commercial. A clear custody record supports fair conversations.
Customer account
Total assets held by each customer.
Delivery site
Assets by location for customers with several sites.
Asset type
Crates, totes and pallets counted separately.
Age at site
How long each item has been away from the warehouse.
Share the record with customers regularly. Many holdings are unintentional, and a simple balance statement brings assets back quickly.
Return due datesSet Expectations and Remind Before They Are Overdue
Customers return assets faster when they know what is due and when. Reminders work better before the deadline than after.
On time
Asset is within the agreed return window.
Due soon
Reminder sent and pickup planned.
Overdue
Escalated to the account owner and charged according to the agreement.
Terms and charges should match the customer agreement. Always check contracts before applying fees.
Loss and damageSpot Problems Early and Charge Fairly
Losses and damage are easier to resolve when evidence exists at the time of the event.
1
Missing at collection
Compare assets delivered with assets collected and flag differences immediately.
2
Damaged on return
Photograph and scan damaged assets at the warehouse, linking them to the last customer.
3
Wear and tear versus misuse
Set clear inspection criteria so decisions are consistent.
4
Charge-back and credit
Apply agreed charges with evidence attached.
5
Repair or retire
Decide whether to repair or scrap based on cost and condition.
Cycle timeMeasure How Long Assets Spend Away From the Warehouse
Cycle time is the average number of days an asset takes to complete a trip and return. It drives how many assets you need.
Assets needed = daily demand for assets x cycle time in days + safety buffer
12
Average cycle time in days
2,400
Assets in circulation
+10%
Safety buffer to cover variation
In this illustrative example the pool needed is about 2,640 assets. If cycle time falls from 12 to 9 days, the pool needed falls to about 1,980, a large saving in capital.
Where assets get stuckAn Illustrative Split of Time Spent per Cycle
Assets rarely spend all their time in transit. Most of the delay sits at customer sites and in the return process. This split is illustrative.
10 percent: In the warehouse
Cleaning, inspection and staging.
15 percent: In transit
Delivery and collection trips.
60 percent: At the customer
Waiting for collection or unpacking.
15 percent: Return and reconciliation
Scanning, counting and handling.
The largest slice tells you where to focus. If assets sit at customers, tighter collection planning will pay back more than faster washing.
Pool sizeMatch the Size of the Pool to the Risk
An oversized pool wastes capital. An undersized pool disrupts deliveries. The right size balances demand, cycle time and loss.
Pool position
Cycle time stable
Cycle time variable
Low loss
Right-size
Keep the pool lean and monitor
Add buffer
Variability needs a larger safety stock
High loss
Recover losses
Fix losses before buying more
Fix both
Stabilise cycle time and reduce losses first
Buying more assets to cover losses treats the symptom. Tracking shows the cause.
Who is involvedSeveral Teams Own Part of the Asset Cycle
Warehouse
We issue, receive and inspect assets.
Drivers
We scan at delivery and collection.
Customer service
We handle balances, reminders and disputes.
Finance
We approve charges and track the cost of loss.
Agree responsibilities in writing. When nobody owns the cycle, nobody notices the loss.
What improvement looks likeBefore and After Asset Tracking
Track losses, cycle time and disputes before and after introducing tracking. This view is illustrative.
Spreadsheets and goodwill
Manual versus trackedWhat Changes in Daily Work
Manual tracking
Counts done occasionally
Balances disputed with customers
Losses found at year end
Pool sized by guesswork
Tracked assets
Scans at every hand-off
Shared balances with customers
Losses flagged within days
Pool sized from cycle time data
The change is largely about timing. Problems are found while evidence still exists.
Data and reportingFour Reports Every Asset Programme Needs
| Report | What it shows | Who uses it |
|---|
| Balance by customer | Assets held and age | Customer service and sales |
| Overdue assets | Items past their return date | Account owners and drivers |
| Loss and damage | Items lost or damaged with causes | Finance and operations |
| Cycle time trend | Days per cycle by customer and route | Planning and logistics |
Start with these four and add more as questions arise. To design reports for your team, ask our team about asset tracking reports.
RolloutFive Steps From First Count to a Tracked Pool
1
Count what you have
Do a physical count by asset type and location.
2
Choose identification
Match tags or labels to asset value.
3
Start with key customers
Track the customers holding the most assets.
4
Add reminders and charges
Apply agreed rules with evidence.
5
Review cycle time and size the pool
Use data to adjust purchases and plans.
Physical asset count completed
Identification method chosen by asset type
Scans at issue, delivery, collection and return
Customer balances shared regularly
Return due dates and reminders set
Loss and damage process with photos
Cycle time tracked by customer and route
Owner named for the asset pool
Charges and depositsFour Commercial Models for Returnable Assets
How you charge for assets shapes customer behaviour. Models differ in how much they encourage prompt return and how much administration they need.
Deposit
The customer pays a deposit per asset and receives it back on return. Strong incentive, but needs careful accounting.
Rental
A small daily or weekly fee applies while the asset is at the customer. Encourages quick return.
Loss charge
A fee applies only for assets not returned within an agreed period.
Included in price
Assets are part of the delivery price with no separate charge. Simple, but offers little incentive.
Whatever model you choose, make sure the data can support it. A charge without evidence of custody is likely to be disputed.
Cleaning and hygieneKeep Food-Grade Assets Clean and Traceable
In food and beverage supply chains, returnable packaging must come back clean and fit for use. Cleaning is part of the asset cycle, not an afterthought.
Collect
Empty assets are collected and checked for contamination
Wash
Assets pass through an approved cleaning process
Inspect
Cleaned assets are checked for damage and residue
Release
Approved assets return to the pool
Record the wash date or batch against each asset where possible. A cleaning record supports audits and customer assurance.
Own pool or shared poolCompare Ways to Run a Pallet and Container Pool
Some operations own their assets, while others rent from a pooling service or share with partners. Each option has trade-offs.
| Model | Strength | Watch for |
|---|
| Own pool | Full control and no rental cost | Capital tied up and loss risk carried internally |
| Pooling service | Less capital and shared management | Fees and dependence on the provider |
| Shared with partners | Efficient use across the chain | Needs clear rules on custody and charges |
| Hybrid | Mix of control and flexibility | More complex to manage and report |
The right model depends on volumes, customer mix and the cost of capital. To compare options, ask our team for a pool model comparison.
MaturityMove From Counting to Managing Assets
Most programmes move through clear stages. Each stage adds control and value.
Level 1: CountPeriodic physical counts by type and location
Level 2: RecordScans at issue and return with customer balances
Level 3: ManageDue dates, reminders, charges and loss analysis
Level 4: OptimiseCycle time targets and data-led pool sizing
Start where you are and move up one level at a time. Each stage pays for the next by reducing losses and tied-up capital.
Expert reviewWhat a Logistics Asset Manager Would Check First
Asset tracking succeeds when scanning is built into existing routines and customers see the value of shared balances. Tags and software are secondary to simple, consistent habits.
Verdict
Strong when custody is recorded at every hand-off and balances are shared.
Watch for
Tags that come off, scans skipped under time pressure and charges applied without evidence.
Do next
Track the top ten customers by asset holding and review their balances monthly.
Frequently asked questionsWhat Operations Teams Ask About Returnable Packaging Tracking
Do we need to tag every crate and tote?
Not necessarily. High-value assets such as pallets and large crates often justify individual tags, while low-value totes may be tracked by batch or by customer balance. Match the method to value and loss rate, and review it as you learn.
Compare tracking methods.
How do we get customers to return assets faster?
Share balances regularly, set clear return windows, send reminders before deadlines and plan collections with deliveries. Charges applied fairly and with evidence reinforce good behaviour.
Ask about return reminders.
What is a reasonable loss rate?
It varies by industry, customer mix and asset type, so measure your own baseline first. Track loss by customer and route to see where it concentrates, then target those areas.
Plan a baseline.
Can tracking reduce how many assets we buy?
Often yes. Shorter cycle times and fewer losses mean a smaller pool serves the same demand. Use cycle time data to size purchases instead of buying to cover uncertainty.
Ask about pool sizing.
How do we handle damaged assets fairly?
Set inspection criteria that separate normal wear from misuse, record condition with photos at collection and return, and apply agreed charges with evidence attached.
Review inspection criteria.
Every asset accounted for
Stop Buying Replacements for Assets You Never Lost Track Of
Book a session with iFactory AI to count your assets, choose a tracking method and set up custody records that keep crates, totes and pallets coming back.