Ask any FMCG operations leader six months after an AI pilot ended whether it worked, and most will say yes. Ask them for the number that proves it, and the conversation often stalls — because nobody wrote down what "before" looked like. A baseline is not a formality; it is the only thing that turns a subjective sense of improvement into a defensible number a finance team can act on. Every deployment the iFactory team runs begins with a documented baseline capture, before a single model prediction ever reaches the plant floor.
MEASUREMENT DISCIPLINE
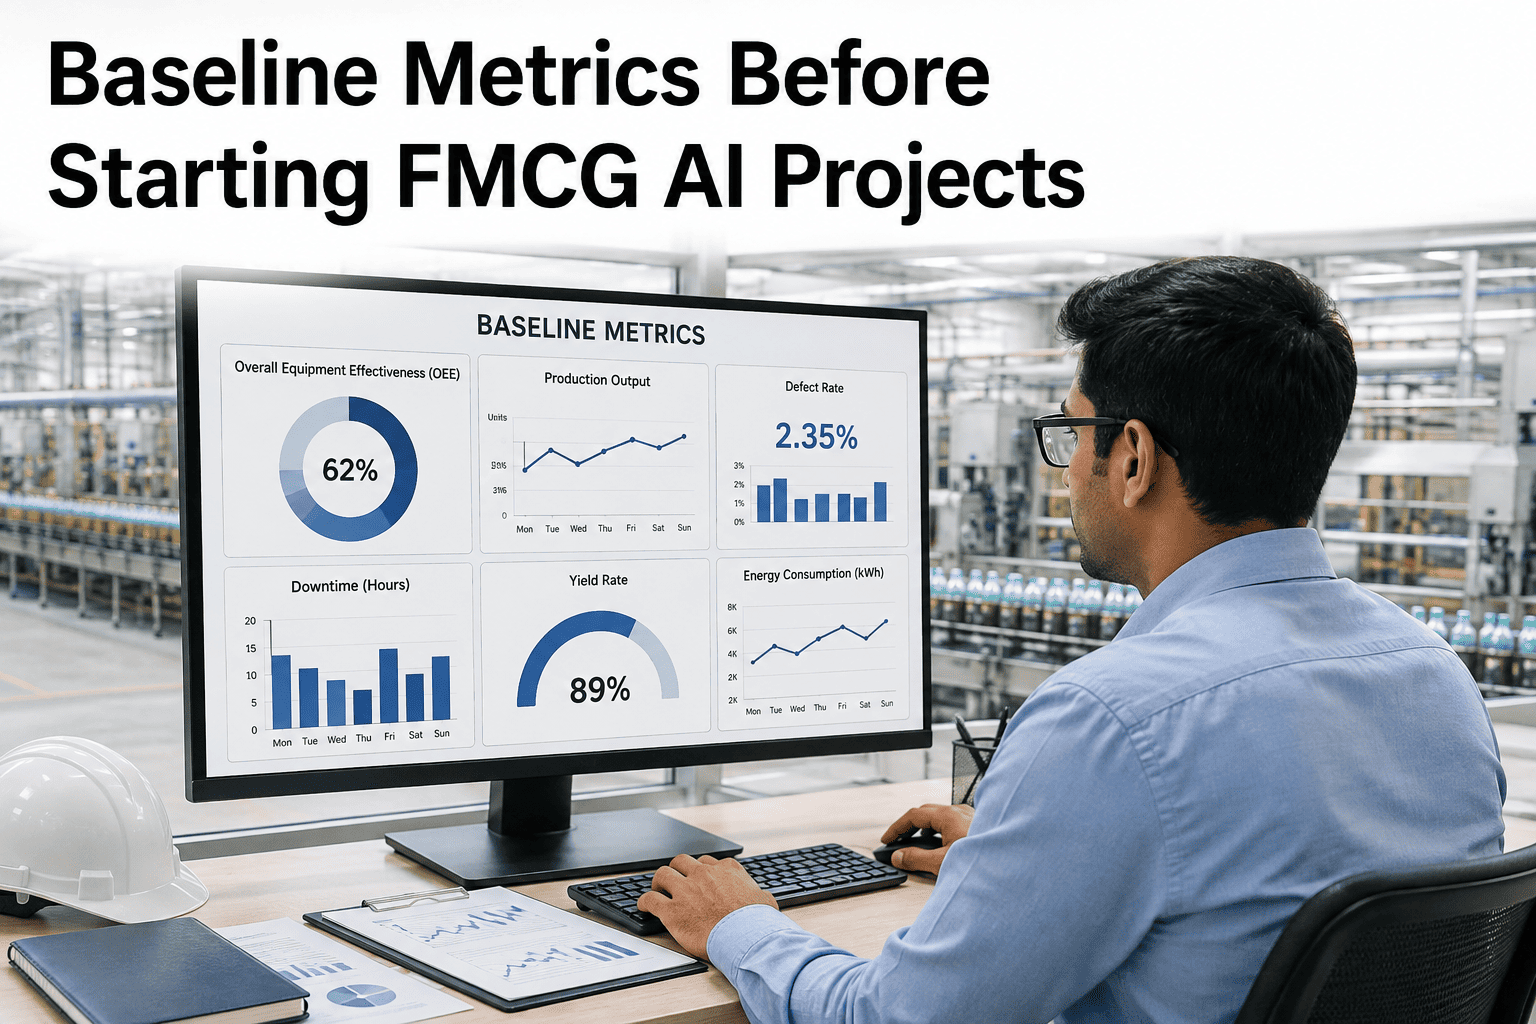
Baseline Metrics Before Starting FMCG AI Projects
The four-week baseline protocol that makes value proof possible once a project reaches steady state — what to measure, how long to measure it, and why skipping this step quietly kills more AI business cases than any model performance issue.
Why "We Think It Got Better" Doesn't Survive a Budget Review
A CFO evaluating whether to fund a wider AI rollout needs a comparison: performance before, performance after, difference in dollars. Without a documented baseline, that comparison simply cannot be made rigorously, no matter how confident the operations team feels about the improvement. What typically happens instead is a rough, after-the-fact estimate reconstructed from memory or incomplete historical records — a number nobody fully trusts, including the people presenting it.
The Four-Week Baseline Protocol
A consistent, repeatable measurement window is what separates a defensible baseline from a guess. The protocol below is the structure most FMCG deployments follow, adjusted slightly based on how much natural day-to-day variability exists in the specific metric being tracked.
Week 1
Define the exact metric and measurement method that will be used both before and after deployment, with no changes allowed once tracking starts.
Week 2
Begin daily data capture across all relevant shifts, lines, and conditions, avoiding any measurement gaps that would bias the baseline number.
Week 3
Continue capture through a full weekly operating cycle, including any known variation such as different product runs or shift patterns.
Week 4
Finalize the baseline figure as an average or range, document it formally, and sign it off jointly with operations and finance before go-live.
Build a Baseline Protocol for Your Next AI Deployment
iFactory helps design and run the baseline capture window before any model goes live, so the value case for your AI investment is measurable from day one rather than reconstructed after the fact.
What to Actually Measure, by Use Case
The right baseline metric depends entirely on the use case, and choosing the wrong one is almost as damaging as skipping the baseline altogether — a baseline that does not directly connect to the outcome the AI system is meant to improve will not hold up to scrutiny later. The table below maps common FMCG use cases to the specific metric worth capturing.
| Use Case | Primary Baseline Metric | Recommended Capture Window |
|---|
| Computer vision quality inspection | Current defect escape rate and manual inspection labor hours | 4 weeks |
| Predictive maintenance | Unplanned downtime hours per line per month | 4-6 weeks |
| Demand forecasting | Forecast error rate against actual sales by SKU | 8-12 weeks (seasonal factor) |
| Fresh product quality monitoring | Current shrink and markdown rate by department | 4 weeks |
| Warehouse routing optimization | Average pick time and travel distance per order | 3-4 weeks |
Common Baseline Mistakes That Undermine the Whole Comparison
Even teams that understand the importance of a baseline sometimes capture one that cannot support a valid before-and-after comparison. The patterns below are the most frequent ways a baseline gets quietly compromised before anyone notices.
Measuring During an Unusual Period
Capturing a baseline during a holiday production run, a known equipment issue, or an atypical staffing period produces a number that does not represent normal operations.
Changing the Measurement Method Mid-Project
If the post-deployment number is calculated differently than the baseline was, the comparison becomes meaningless no matter how the actual numbers moved.
Capturing Too Short a Window
A baseline shorter than one full operating cycle risks capturing an unrepresentative snapshot rather than a stable average.
Skipping Sign-Off From Finance
A baseline that operations captures alone, without finance validation, often gets challenged later when the improvement number is presented for budget approval.
Before and After — What a Documented Comparison Looks Like
The example below illustrates the kind of clean comparison a proper baseline makes possible, using a representative computer vision quality inspection deployment as an illustration of the format, not a guaranteed outcome for every deployment.
Documented Baseline
3.8%
Defect escape rate, averaged across a 4-week capture window before go-live
→
Post-Deployment Result
1.2%
Defect escape rate, measured the same way after 90 days in production
A Continuous Improvement Manager on Learning the Baseline Lesson Once
"
The first time we deployed a predictive maintenance model, we were confident enough in the expected impact that we skipped a formal baseline period and just went live, planning to compare against "typical" downtime numbers from our existing reporting system. It seemed reasonable at the time. Six months later, when leadership asked what the model had actually saved us, our existing downtime reports turned out to categorize things differently than we needed, mixed planned and unplanned downtime in ways that muddied the comparison, and simply did not give us a clean number to point to. We knew, informally, that things had improved. We could not prove it, and that mattered enormously when it came time to ask for budget to roll the system out to our other plants. On the second deployment, we spent four weeks doing nothing but capturing a clean baseline using the exact definition we would use afterward, and when that project ended, the improvement number was completely unambiguous. It took an extra month up front. It saved us months of budget negotiation on the back end.
— Continuous Improvement Manager, National FMCG Manufacturer · Led Baseline Standardization Across 8 Plants
Frequently Asked Questions
Is four weeks always the right length for a baseline capture window?
Four weeks is a reasonable default for metrics with moderate day-to-day variability, such as defect rates or downtime hours, because it typically covers a full weekly operating cycle including any weekend or shift-pattern effects. Metrics with stronger seasonal patterns, such as demand forecasting accuracy, often need a longer window — sometimes eight to twelve weeks — to capture representative variation rather than a single season's behavior. The right length depends on how much natural variability the specific metric has, and it is worth reviewing this with your data or operations team before finalizing the capture window.
What if our existing reporting systems already track the metric we need?
Existing reports can be a useful starting point, but it is worth verifying carefully that the historical data was captured using the exact definition and method you plan to use post-deployment, since subtle differences in categorization or measurement timing can quietly undermine the comparison later. In many cases, teams discover that existing reports mix categories differently than needed, or were not captured consistently across all the shifts and lines the AI project will cover. A short verification period confirming the historical data lines up with your intended measurement approach is usually worthwhile before relying on it as an official baseline.
Should the baseline period overlap with pilot setup and integration work?
Yes, and this is generally the most efficient approach — the baseline measurement window can run in parallel with technical integration and infrastructure work, since the two activities do not depend on each other. Running them sequentially, with baseline capture first and integration only starting afterward, adds unnecessary time to the overall project timeline without any measurement benefit. The one requirement is that the baseline capture must be completely finished, with the model not yet influencing operations, before go-live begins.
How do you handle a baseline for a brand-new product line with no historical data?
For genuinely new lines or products with no operating history, a short live baseline period run under standard operating conditions — without any AI assistance — is the most reliable option, even though it may need to be shorter than the ideal four weeks given launch timelines. In some cases a comparable existing line or product with similar characteristics can serve as a reasonable proxy baseline, though this should be flagged clearly as an approximation rather than presented with the same confidence as a direct baseline measurement.
Can iFactory help design a baseline protocol specific to our metrics and systems?
Yes — baseline design is one of the first working sessions in any iFactory engagement, covering which metric to track, how long the capture window should run, and how to align the measurement method with what your existing systems can reliably report. Our team works directly with your operations and finance stakeholders to make sure the baseline that gets captured is one everyone will trust when the results are presented later. To set up a baseline planning session,
book a demo, or
reach out to our support team with specific questions about your systems.
Don't Let a Missing Baseline Undercut a Working AI System
The difference between "we think it helped" and a number your CFO will approve is a documented baseline captured before go-live. iFactory builds baseline protocol design into every deployment from the very first week.