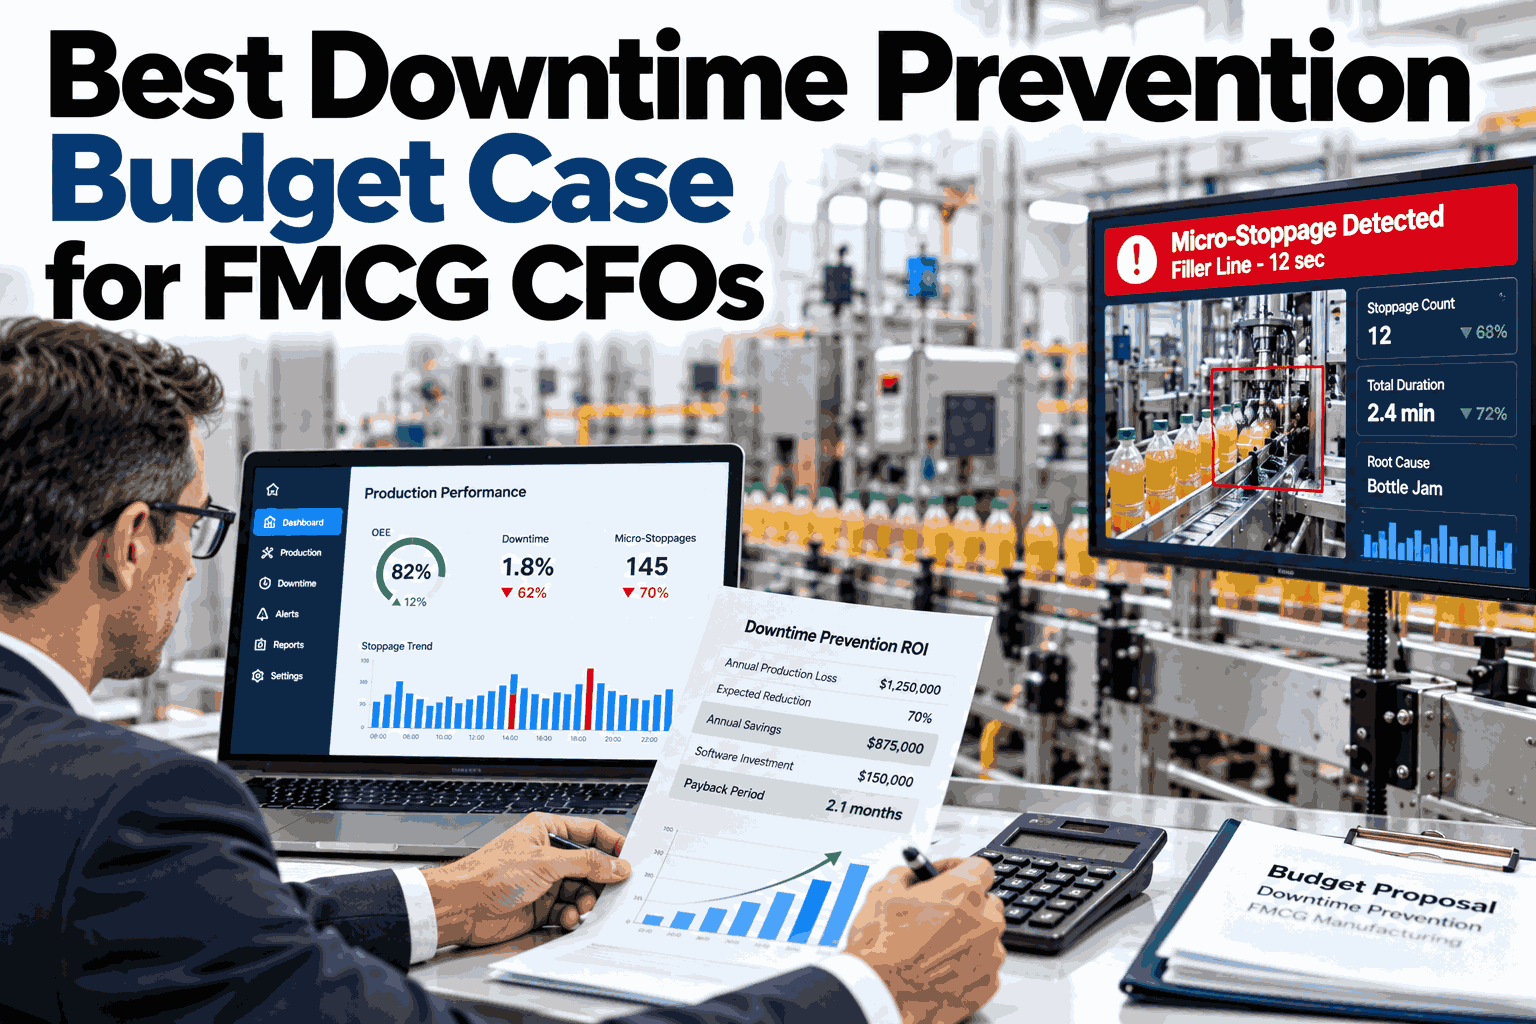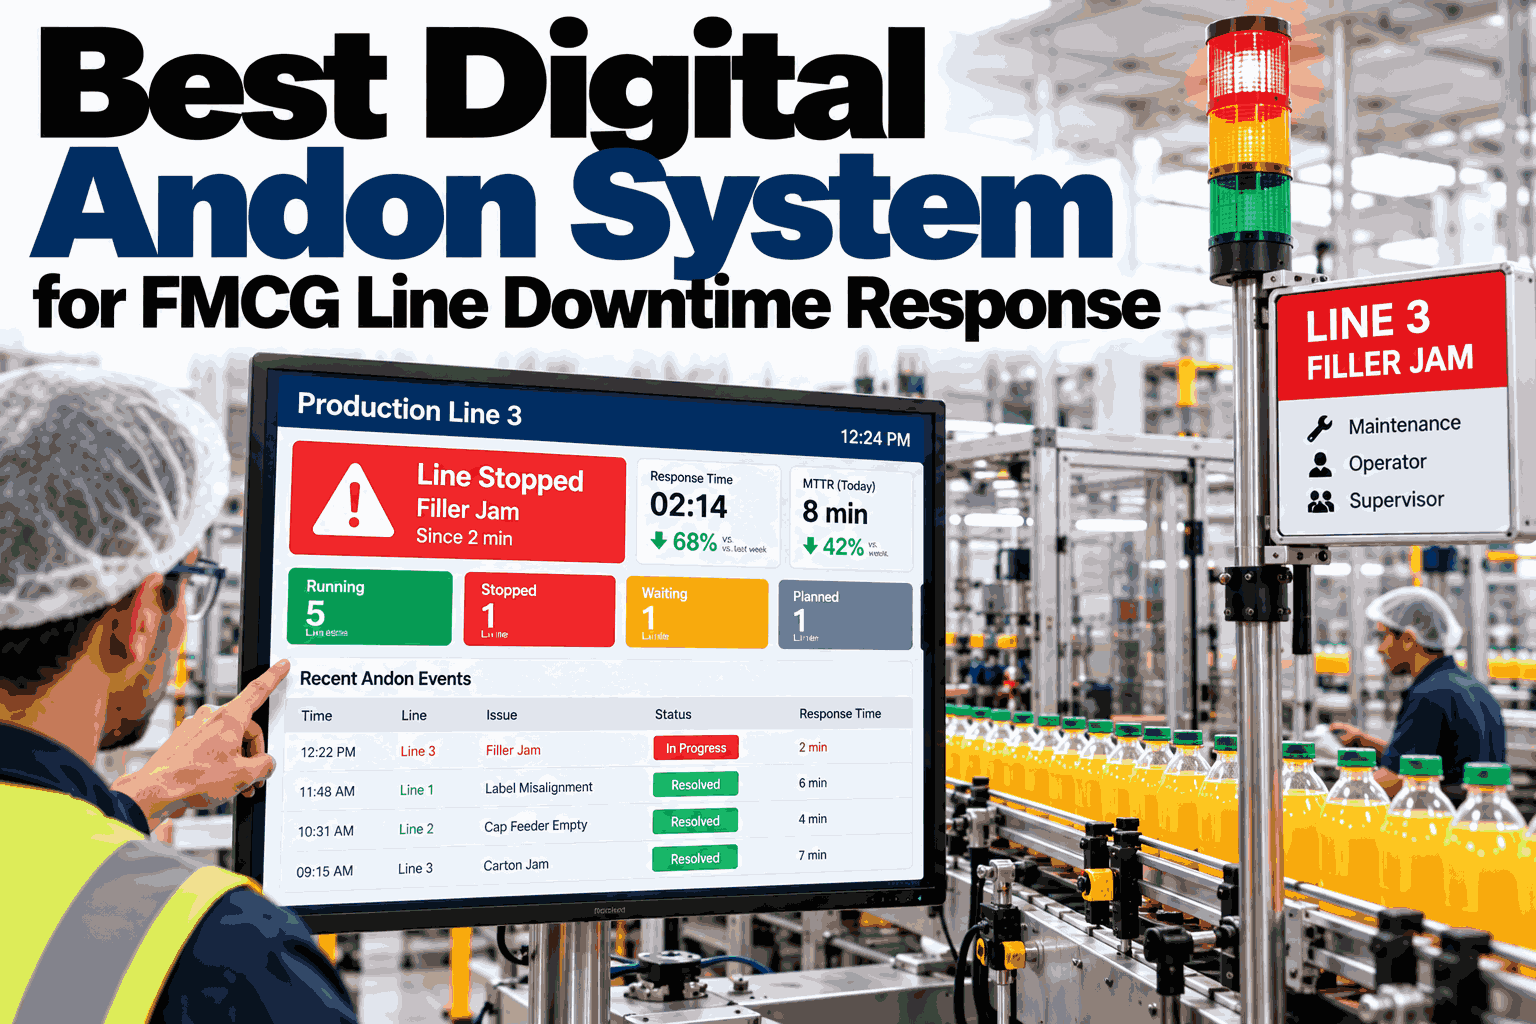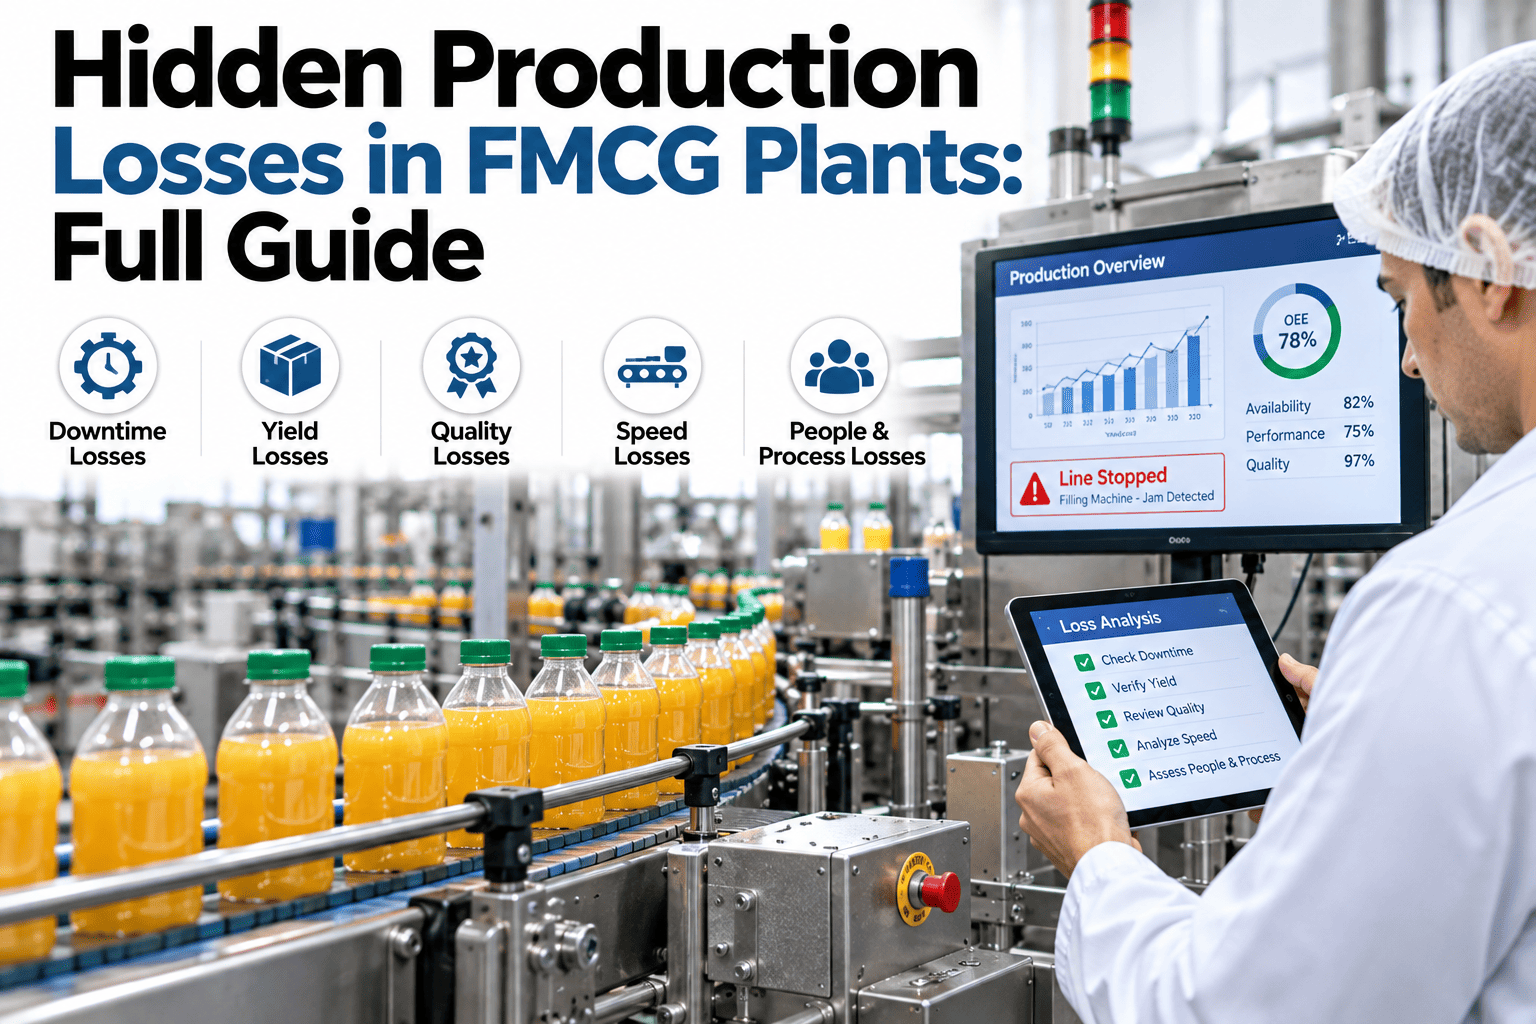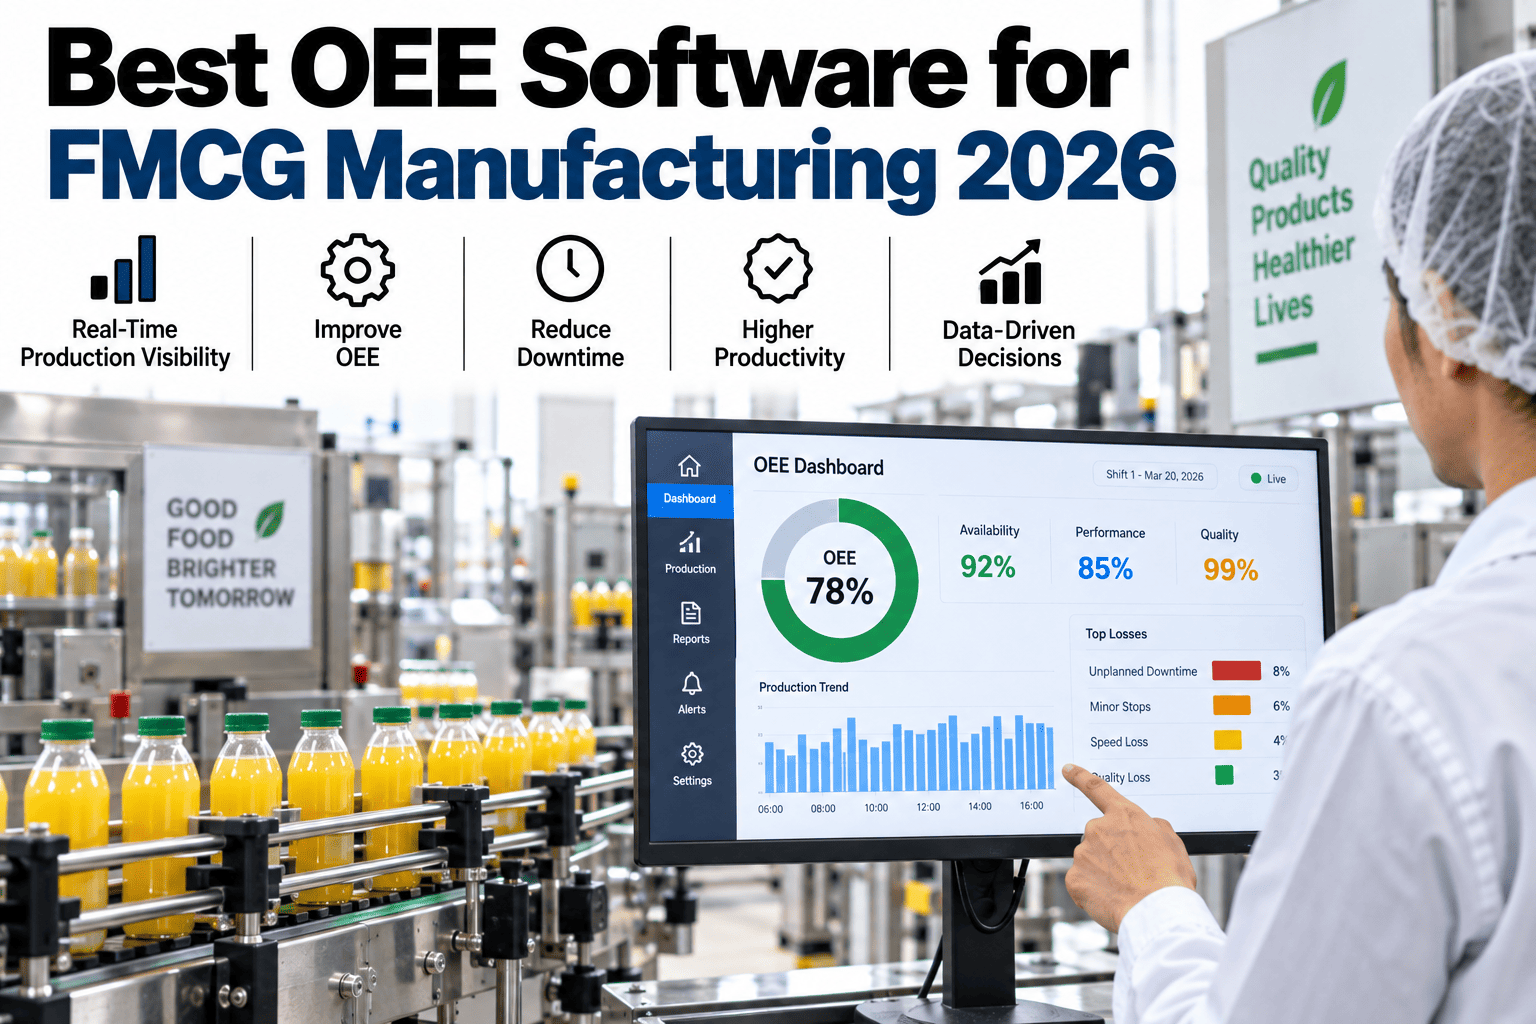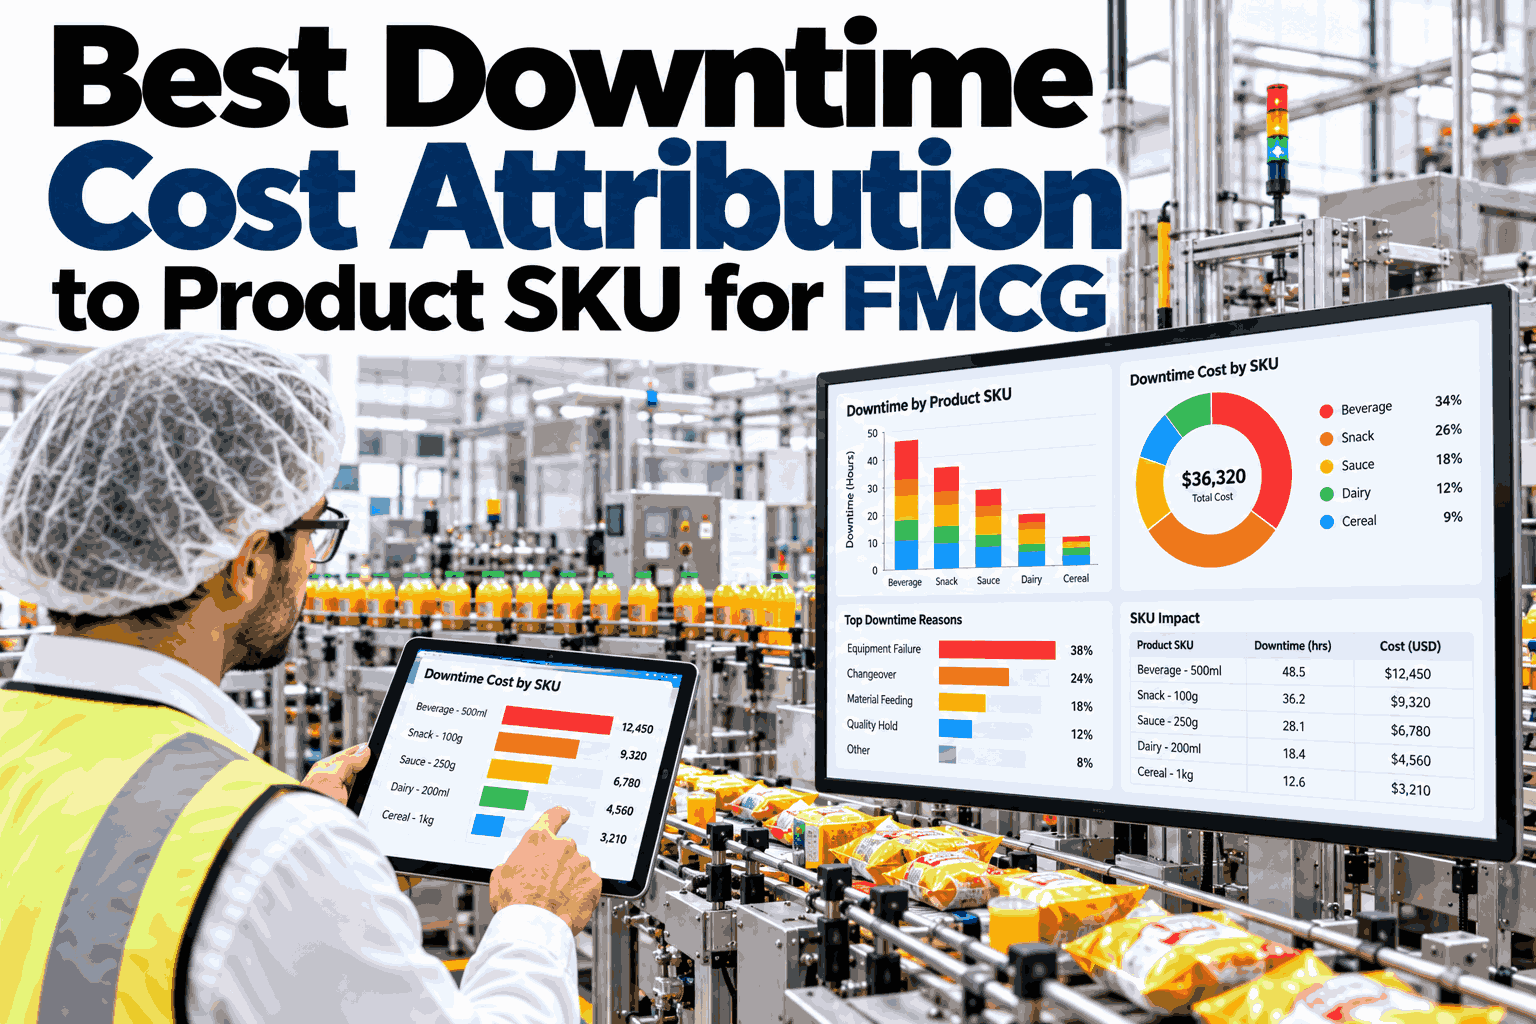
A line that goes down unplanned rarely costs what the maintenance report says it costs. The repair labor and the replacement part are the visible part of the bill, while the lost production hours, the missed shipment window, and the retailer chargeback for a late delivery sit in three different ledgers that nobody adds together. For FMCG finance teams building next year's budget, the clearer comparison is dollar for dollar: what prevention spend costs against what an unplanned stoppage actually drains from margin once every line item is counted.
The Budget Question Is Not "Can We Afford Prevention," It Is "Can We Afford Not To"
iFactory AI turns downtime prevention from a maintenance request into a finance conversation, comparing planned spend against the real, fully loaded cost of emergency response on an FMCG line. The comparison below reflects the figures finance teams actually use once the full cost of a stop is counted, not just the repair invoice.
The Maintenance Ticket Only Captures a Quarter of the Real Cost
When a filler or a case packer stops without warning, the work order tracks the repair. It rarely tracks everything that stopped moving around it, or everything that had to be thrown away, reworked or rescheduled as a result.
None of these four categories is hidden on purpose. They simply live in different systems, owned by different teams, and nobody is asked to add them up until a CFO asks why unplanned downtime keeps eating into forecast margin despite a maintenance budget that looks reasonable on paper.
This is also why prevention requests so often lose to other budget priorities. A $42,000 ask looks large next to a $4,800 repair history, and looks very different once lost production, spoiled product and chargebacks are added to the same column.
What a Fully Loaded Downtime Cost Actually Includes
A fair comparison needs a fair cost figure. Here is the structure finance teams use to turn one stoppage into a number that reflects what the business actually lost.
Added together, a single four-hour stoppage on a mid-size packaging line can cost well over six times what the repair ticket alone suggests, and that gap only widens on lines running near-perishable product or tight retailer delivery windows. Finance teams who build this breakdown once tend to reuse it for every line in the plant, since the categories rarely change even when the dollar amounts do.
Prevention Spend Against Avoided Cost, Line by Line
Numbers persuade a budget committee faster than a general argument. Here is a simple annual comparison for one packaging line with a known history of unplanned stops.
At $42,000 a year, a prevention program that cuts unplanned stoppages by even half pays for itself more than twice over, before counting the chargebacks and spoiled product that a prevented stop never creates in the first place. The committee rarely questions a number built this way, because it ties directly back to twelve months of the plant's own history rather than a vendor's general claim.
Build This Case With Your Own Downtime Numbers
Bring your last twelve months of stoppage data and we will build the fully loaded cost comparison for your own lines.
Where Prevention Dollars Go, and What Each One Buys Back
Not all prevention spend behaves the same way. Some of it stops a failure from happening, and some of it simply makes the response faster once a failure has already started.
These meters are directional rather than measured figures, but the pattern holds across most FMCG plants: emergency spend is unpredictable and disruptive by nature, while planned prevention spend is the one lever a finance team can actually forecast. That predictability is often worth as much to a budget committee as the dollar savings themselves.
Not Every Line Needs the Same Level of Prevention Investment
Budget works harder when it follows the lines where a stop is most expensive, not simply the lines that fail most often. These four factors usually decide where to spend first.
| Risk factor | Why it raises the cost of a stop | Where to check first |
|---|---|---|
| Perishable or short shelf-life product | In-process product cannot wait for a repair without spoiling | Dairy, fresh bakery, ready-to-eat lines |
| Tight retailer delivery windows | A missed slot triggers chargebacks beyond the product's own value | Lines feeding large retail accounts |
| Single point of failure equipment | No redundant unit means the whole line waits on one repair | Fillers, cappers, case packers without backup |
| High changeover frequency | More changeovers mean more chances for a setup-related stop | Multi-SKU lines running frequent format changes |
A line that scores high on two or more of these factors is usually where the next prevention dollar returns the most, well before a plant-wide rollout is justified.
What a Downtime Prevention Program Actually Buys
Prevention spend is not one thing. It covers several layers of visibility and response, each addressing a different stage of equipment failure.
That last layer is the one most programs skip, and it is the one that keeps the budget line funded the following year, because a finance team that cannot see the avoided cost has no reason to protect the spend.
See This Reporting Model Applied to Your Plant
Walk through how avoided downtime gets tracked and reported back in terms your finance team will actually use.
Building a Budget Request That Survives Committee Review
A prevention budget request competes with every other line item on a CFO's desk. The requests that get approved tend to share the same structure, built around a baseline, a target and a named owner.
Committees rarely reject a request built this way outright. They ask for a smaller pilot first, which is exactly the opening a single-line comparison like the one in this guide is built to answer.
Four Mistakes That Sink a Downtime Prevention Budget Request
A prevention program can be technically sound and still lose its funding the following year. These are the mistakes that most often cause that to happen.
Each of these is a planning gap rather than a program failure, and each one is fixable before the budget request is ever submitted for approval.
How iFactory AI Supports This Same Budget Case
Everything in this guide reflects the way FMCG finance and plant teams build their own prevention case with iFactory, so it is worth being direct about what the platform contributes to each step.
None of this replaces the judgment of the plant and finance teams running the program. It gives them a single, shared number to argue about, instead of four disconnected ones that never quite add up the same way twice.
What FMCG Finance Teams Ask Before Approving This Budget
Build Your Own Downtime Prevention Budget Case
Book a session with iFactory AI and turn your plant's stoppage history into a budget case finance can approve with confidence.