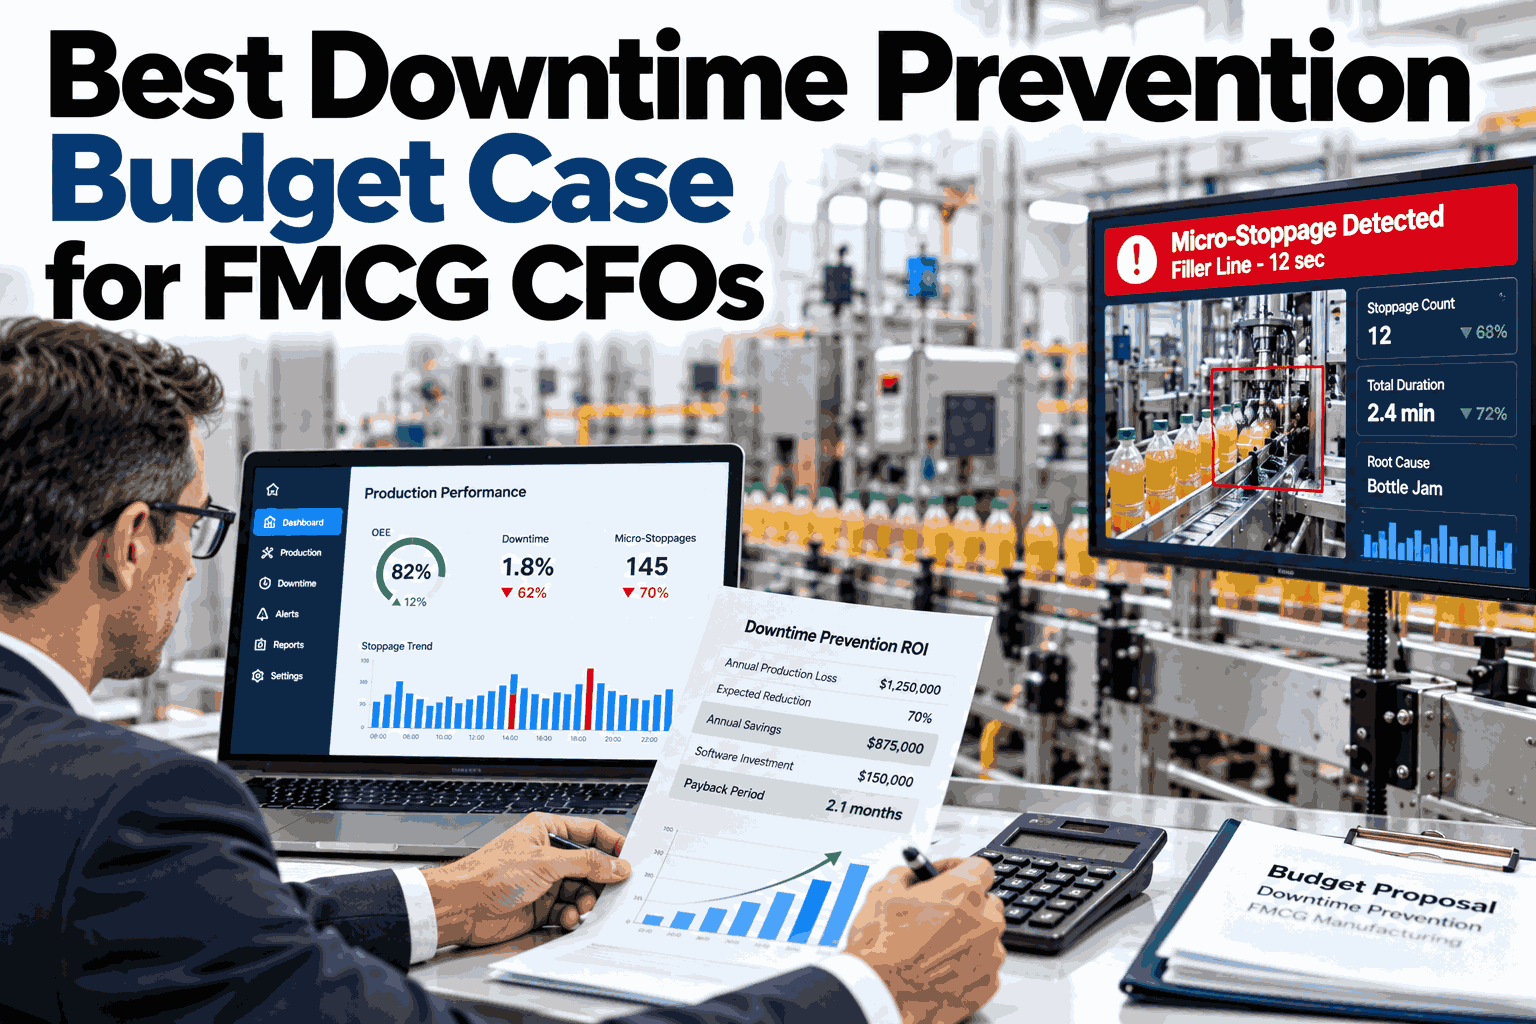
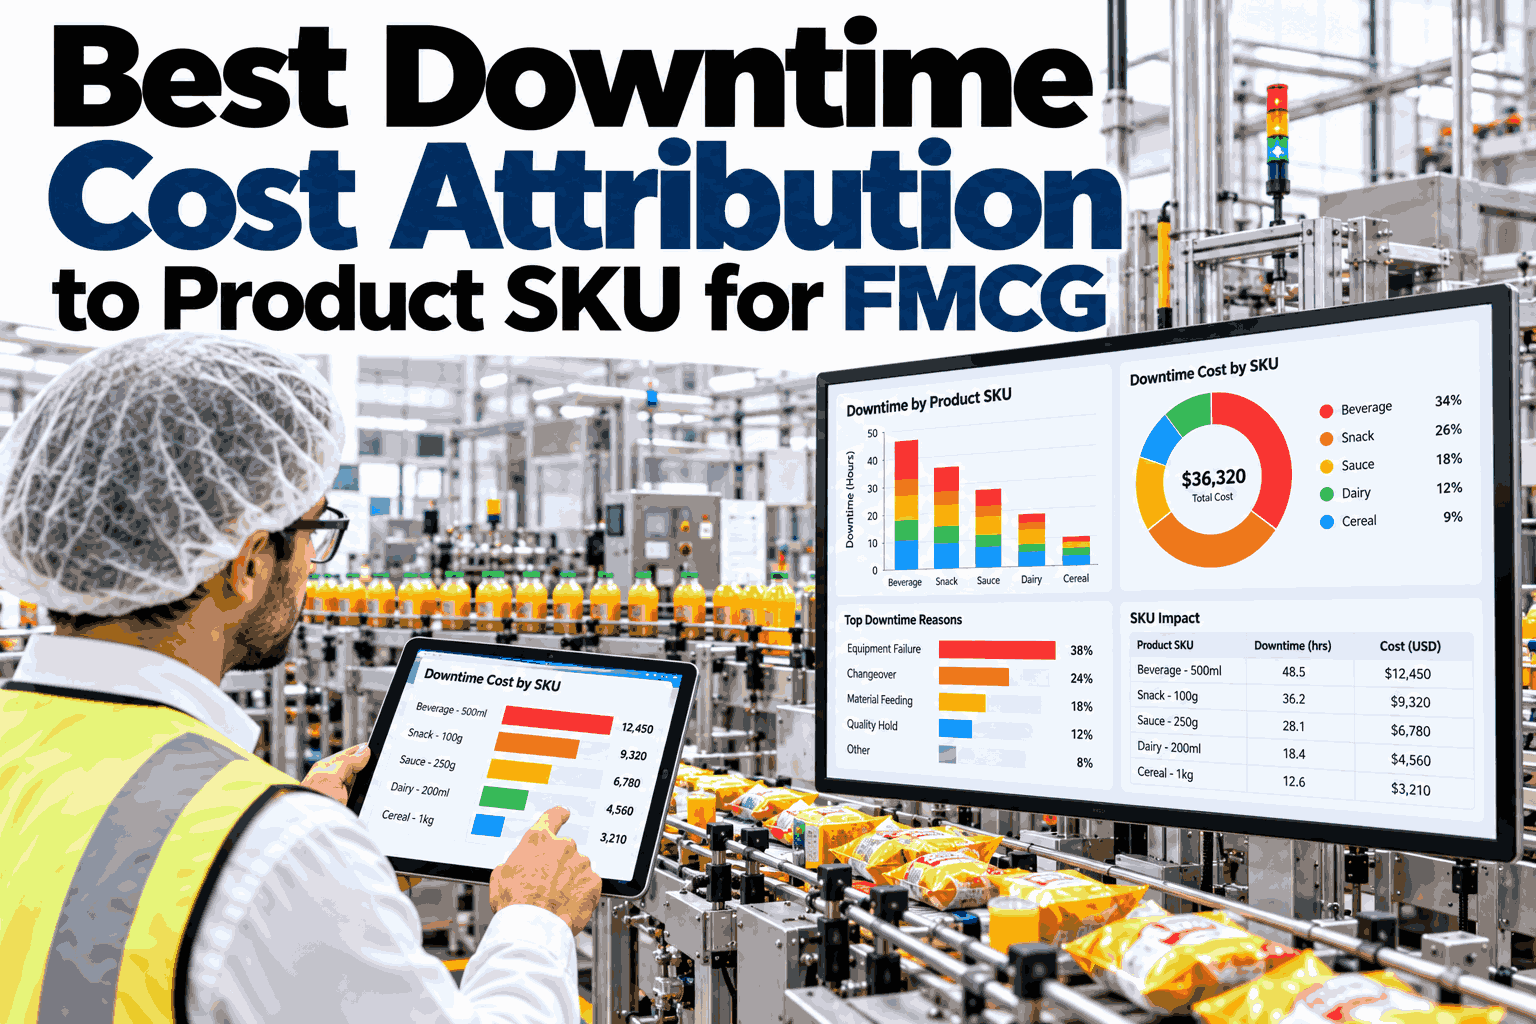
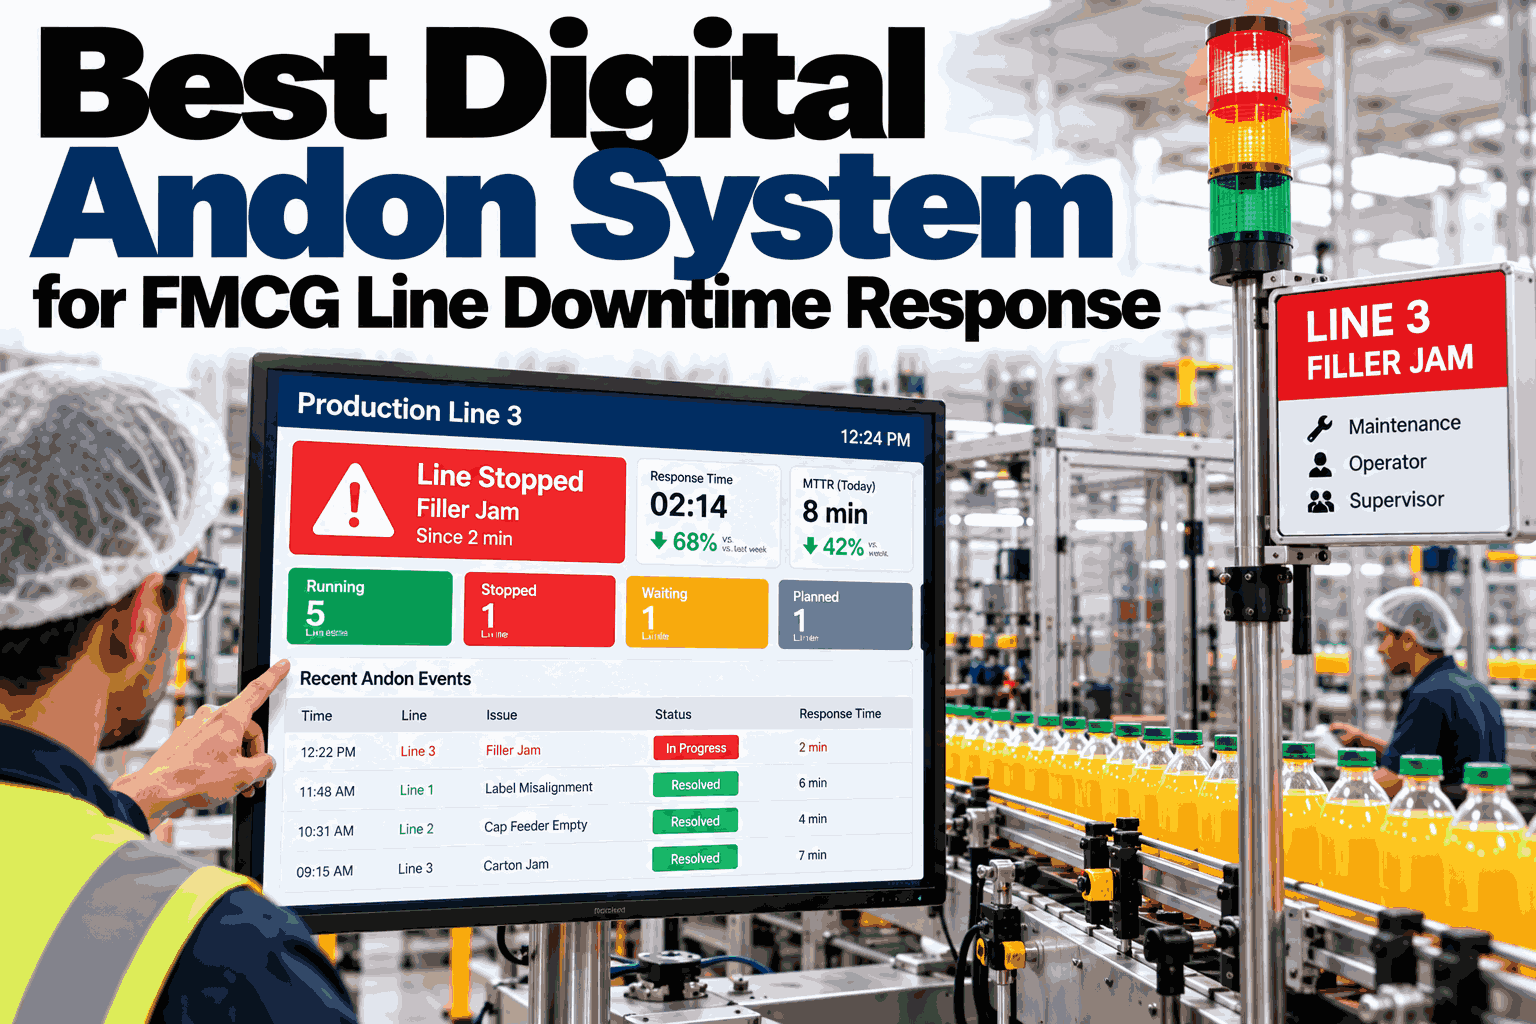
A maintenance manager asking for a few hundred dollars to replace a bearing before it fails is an easy line item to defer when budgets get tight. The same manager asking for emergency repair, expedited freight, and a retailer chargeback explanation after that same bearing seizes mid-shift is a much harder conversation, and usually a far more expensive one. The dollar gap between those two requests is the entire case for a prevention budget, and you can build that comparison for your own plant's numbers with our team before your next budget cycle.
Budget case for CFOs
Make the Downtime Prevention Budget Case in Numbers Finance Actually Trusts
A dollar-for-dollar comparison of prevention spend against the emergency repair, freight, and chargeback costs it avoids, framed the way a CFO evaluates any other investment.
Typical prevention spend, per avoided eventLow hundreds of dollars
Typical emergency cost, same event unaddressedLow five figures and up
Where it hides
Four Places Downtime Cost Hides From the Production Report
A production report usually shows lost output. It rarely shows the full financial tail that follows a single unplanned stop through the rest of the business.
Emergency labor premium
After-hours and rush repair rates often run well above standard scheduled maintenance labor cost.
Expedited freight
A missed ship date frequently gets patched with rush shipping, at a steep premium over standard freight.
Retailer chargebacks
A late or incomplete shipment can trigger a direct chargeback from the retail partner receiving it.
Lost margin on missed orders
Orders that cannot be recovered within the customer's window are simply lost margin, not just delayed revenue.
The comparison
Three Scenarios: Prevention Cost Against the Emergency It Avoids
These are illustrative planning figures to show the shape of the comparison. Your own numbers should be built from your plant's actual repair and freight history.
Scheduled bearing replacement
In each case, the prevention spend is a small fraction of the emergency cost it avoids, which is the comparison a budget case needs to lead with.
Build This Comparison With Your Own Numbers
Bring your recent emergency repair and freight costs, and we will help you build the dollar-for-dollar case for your budget cycle.
Anatomy of one event
What a Single Unplanned Stop Actually Adds Up To
A breakdown rarely shows up as one clean line item. It is usually a stack of smaller costs that only add up to the real total once someone puts them side by side.
| Cost line | Illustrative amount | Why it gets missed |
| Emergency repair labor |
$2,000 to $6,000 |
Recorded under maintenance, rarely compared to scheduled rate |
| Expedited parts or freight |
$1,500 to $5,000 |
Booked under logistics, separate from the maintenance event |
| Retailer chargeback |
$3,000 to $8,000 |
Processed by finance, often weeks after the actual stop |
| Lost margin on missed orders |
Varies by order size |
Shows up as lower revenue, not as a downtime cost line |
Once these lines are pulled into one view, the true cost of a single unplanned stop is usually several times higher than what appears on the maintenance report alone.
Making the case
Building a Budget Case Leadership Will Actually Approve
A prevention budget request lands differently when it is framed as a reallocation away from emergency spend rather than as new, additional cost.
1
Pull the last twelve months of emergency repair, freight, and chargeback costs tied to unplanned stops.
2
Estimate the prevention program cost needed to address the top recurring causes behind those stops.
3
Present the two figures side by side, framed as reallocating emergency spend into planned spend.
4
Set a simple payback milestone leadership can track, rather than a vague promise of fewer breakdowns.
What to expect
A Realistic Payback Timeline for a Prevention Program
Most prevention programs do not pay back instantly, but the timeline is usually shorter than finance teams expect once emergency cost avoidance is counted properly.
Months 1 to 3
Program cost is incurred while baseline emergency spend is still being phased out.
Months 4 to 6
Avoided emergency events begin offsetting program cost, typically reaching breakeven in this window.
Month 7 onward
Avoided cost consistently exceeds program spend, turning into a net saving leadership can track quarter over quarter.
Frequently asked questions
What CFOs Ask Before Approving a Prevention Budget
How do we get accurate numbers instead of industry averages?
The most credible numbers come from your own twelve months of repair invoices, freight charges, and chargeback records, since these reflect your actual equipment and supplier costs rather than a generic published range.
Pull your own cost baseline with our team.
Is prevention spend really a reallocation, or is it additional cost on top of maintenance?
In most cases it replaces a portion of the emergency repair and expedited freight spend already happening, so the honest framing is a shift in when and how the money is spent, not a pure addition to the budget.
Ask support how this nets out for a typical plant.
How confident can we be in a payback estimate before the program starts?
A payback estimate built from your own historical emergency event frequency and cost is reasonably reliable, though actual results will vary with how consistently the prevention program is followed on the floor.
Review a realistic estimate for your plant.
Should chargebacks really be counted as a downtime cost?
Yes, if the chargeback was triggered by a late or incomplete shipment caused by an unplanned stop, it is a direct financial consequence of that downtime and belongs in the same cost comparison as repair and freight.
Confirm how to categorize chargebacks with our team.
What is the easiest first step toward building this budget case?
Start with your three or four most frequent emergency repair events from the past year and compare their actual cost against a realistic prevention cost for each, since a small, concrete comparison is usually more persuasive than a broad estimate.
Build your first comparison with our specialists.
Numbers finance can approve
Build a Downtime Prevention Budget Case for Your Next Cycle
Book a session with iFactory AI to turn your own emergency repair and freight history into a clear, dollar-for-dollar prevention budget case.