Most FMCG plants do not have an AI shortage, they have a pilot surplus. A vision model on one packing line, a forecasting trial in one category, a maintenance proof of concept on one filler, each one technically impressive and each one quietly parked when the budget review asks what it actually changed. The gap is rarely the algorithm. It is the missing link between the pilot and a number the plant already reports, which is why the teams that scale AI start from an outcome KPI instead of a model. If you want to see that link built on your own plant data, you can walk through the framework in a live session with the iFactory team.
AI VALUE FRAMEWORK · FMCG OUTCOMES
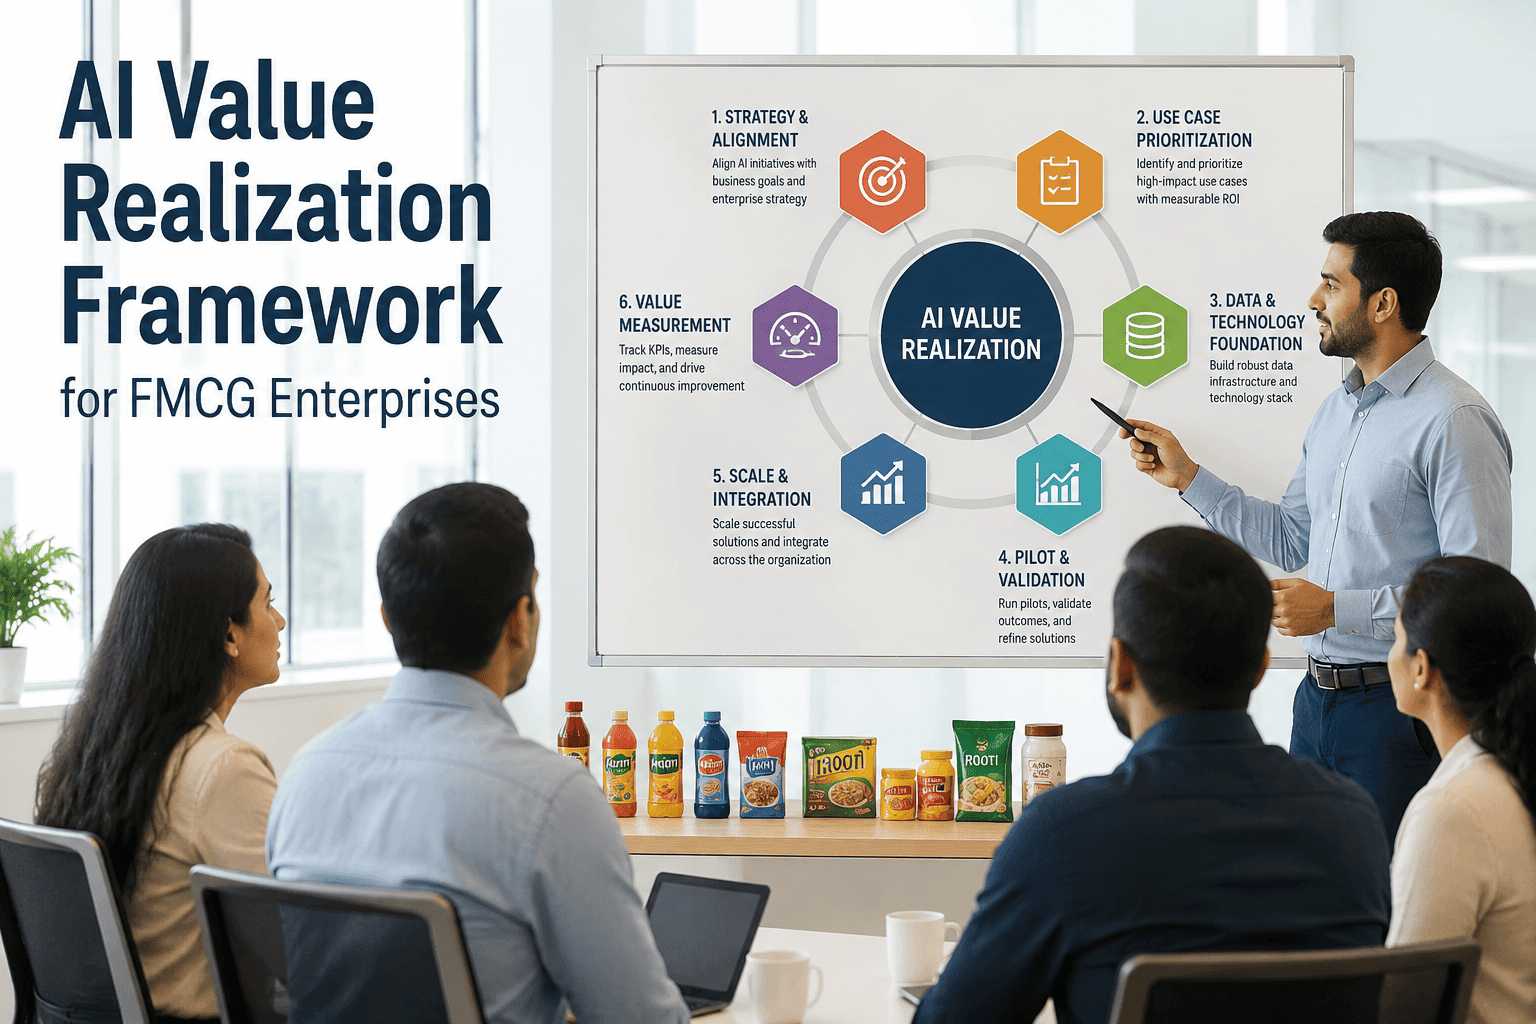
Connecting AI Pilots to Measurable FMCG Outcomes
iFactory AI ties every initiative to one outcome KPI, one baseline, one owner, and one review date, so FMCG pilots end in a scale decision instead of a slide deck.
WHY PILOTS STALL
The Pilot Worked. The Business Case Did Not Move.
In fast-moving consumer goods, margins are thin, changeovers are constant, and every line already has a scorecard. An AI pilot that cannot show up on that scorecard is treated as a science project, no matter how good the model is.
No agreed baseline
The pilot starts without a frozen record of how the line performed before. When results arrive, nobody can prove what changed, so the debate becomes about opinion instead of data.
A metric nobody owns
Model accuracy is owned by the data team, but plant output is owned by operations. When no operations leader is named against the KPI, nobody has a reason to change a shift routine.
Results live outside the scorecard
Pilot dashboards sit in a separate tool from the weekly production review. Leaders never see the AI result next to the numbers they already trust, so it never earns a place in the conversation.
Success defined after the fact
When targets are written after the pilot ends, every result can be framed as a win or a miss. A target set before launch is the only version that survives a skeptical finance review.
The pilot purgatory cycle
01Excited launch
02Impressive demo
03No baseline to compare
04Budget review stalls
05Pilot parked, next pilot starts
THE OUTCOME LADDER
Every AI Initiative Should Climb Five Rungs
A useful pilot can be traced upward from the data it reads to the profit line it protects. If any rung is missing, the chain breaks and the result cannot be defended. Read the ladder from the narrow top, where the business cares, down to the wide base, where the data lives.
1
Business outcome
The P&L line leadership tracks, such as cost per case or service level.
2
Plant KPI
The number the plant already reports weekly, such as OEE, days of cover, or forecast accuracy.
3
Operational driver
The behavior that moves the KPI, such as fewer micro-stops, faster changeovers, or earlier replenishment.
4
AI use case
The specific model or workflow that influences the driver, chosen only after the first three rungs are clear.
5
Data and signals
Machine states, quality checks, orders, stock movements, and the other signals the use case reads every day.
The one-line rule
One pilot, one outcome KPI, one named owner, one review date. If a pilot cannot be described in that sentence, it is not ready to start.
FOUR OUTCOME FAMILIES
The KPIs That Turn AI Into Money
Almost every FMCG AI initiative that survives a finance review lands in one of four families. Choosing the family first keeps the pilot honest, because each one already has a definition, a data source, and an owner inside the plant.
Throughput and OEE
What it measuresAvailability, performance, and quality combined into one line-level score.
Where AI moves itPredicting breakdowns, spotting micro-stops, and flagging slow cycles early.
30-day signalFewer unplanned stops on the pilot line against the frozen baseline.
Typical ownerPlant manager or line operations lead.
Inventory and service level
What it measuresDays of cover, stock-outs, write-offs from expired product, and order fill rate.
Where AI moves itLinking production plans to real demand so stock sits where it sells.
30-day signalLower cover on slow SKUs without a rise in stock-outs on fast ones.
Typical ownerSupply chain or planning manager.
Forecast accuracy
What it measuresThe gap between planned and actual demand at SKU and week level, plus bias.
Where AI moves itReading promotions, seasonality, and channel signals that spreadsheets miss.
30-day signalLower error on the pilot category compared with the legacy forecast.
Typical ownerDemand planning lead.
Cost and waste
What it measuresScrap, giveaway, rework, energy per unit, and unplanned maintenance spend.
Where AI moves itCatching drift in fill weights, seals, and energy use before rejects build up.
30-day signalReduced reject rate or energy per case on the pilot line.
Typical ownerQuality head or plant controller.
See which outcome family fits your plant first
Bring one line and one KPI to a short session. iFactory will map the ladder, the baseline, and the likely pilot signal with you.
BASELINE FIRST
Measure Before You Model
The baseline is the most skipped step and the most valuable one. A frozen baseline turns a vague improvement into a before-and-after comparison that finance, operations, and leadership can all accept without argument.
Illustrative baseline versus pilot target for one packaging line
Overall equipment effectiveness (higher is better)
Unplanned downtime, share of scheduled time (lower is better)
Forecast accuracy at SKU-week level (higher is better)
Finished goods days of cover (lower is better)
These figures are made-up examples that show the method. They are not customer results, and your own baseline will set your own targets.
Pick a representative window
Use eight to twelve weeks of history that includes a promotion, a changeover-heavy stretch, and a normal stretch, so the baseline is not flattered by a quiet month.
Freeze the definition
Write down exactly how the KPI is calculated, including what counts as planned downtime, and lock it. Changing a definition mid-pilot is the fastest way to lose trust.
Record the noise
Note the natural week-to-week swing of the KPI. An improvement smaller than normal noise is not yet proof, and saying so early builds credibility.
THE KPI MAP
From Use Case to Number: A Working Reference
Use this table as a starting point when a team proposes a pilot. If a row cannot be filled in for the idea on the table, the idea needs more thought before it needs a budget.
| AI use case |
Outcome KPI |
Data needed |
Owner |
Review cadence |
| Predictive maintenance on fillers and sealers |
Unplanned downtime, OEE availability |
Vibration, temperature, stop codes, work orders |
Maintenance lead |
Weekly |
| Micro-stop detection on packing lines |
OEE performance rate |
Machine states, cycle times, operator notes |
Line supervisor |
Daily huddle |
| Automated visual inspection |
Reject rate, customer complaints |
Camera images, reject reasons, batch records |
Quality head |
Weekly |
| Demand-linked production planning |
Forecast accuracy, days of cover |
Orders, promotions, shipments, stock levels |
Planning manager |
Weekly S&OP |
| Changeover optimization |
Changeover minutes, schedule adherence |
Changeover logs, product sequence, crew data |
Operations manager |
Weekly |
| Energy and utilities monitoring |
Energy per case, peak demand charges |
Meter data, line states, production counts |
Plant controller |
Monthly |
| Shelf-life and expiry risk alerts |
Write-offs from expired stock |
Batch dates, stock positions, sell-through |
Supply chain lead |
Weekly |
Notice that every row ends with a named owner and a rhythm. That pairing is what keeps a pilot alive after the launch event, and iFactory can fill in this map with you for your own lines during a working session.
THE 90-DAY PROOF PLAN
A Pilot Calendar That Ends in a Decision
Ninety days is long enough to see a real shift pattern and short enough to hold attention. Each stage has an exit check, so the team always knows whether it is allowed to move on.
Days 1 to 15
Frame the outcome
Choose one line, one KPI, and one owner. Walk the five-rung ladder together and write the target in a single sentence that everyone signs.
Exit check: the target is written and the owner has agreed to it.
Days 16 to 30
Lock the baseline
Pull historical data, freeze the KPI definition, and measure natural variation. Confirm that the signals the use case needs are available and trustworthy.
Exit check: baseline and data quality are both accepted by operations.
Days 31 to 60
Run in shadow mode
The AI makes recommendations, but nobody has to act yet. Compare what it would have flagged with what actually happened, and tune the thresholds.
Exit check: operators agree the alerts are worth acting on.
Days 61 to 80
Act and measure
Shift teams start responding to recommendations as part of the normal routine. The KPI is tracked daily on the same screen as the existing scorecard.
Exit check: responses are logged, so impact can be separated from luck.
Days 81 to 90
Decide: scale, fix, or stop
Score the pilot against the rules agreed on day one, present the result next to the baseline, and make a clear decision on the next step.
Exit check: a decision is recorded, not postponed.
THE SCORECARD
Scale, Fix, or Stop: A Decision Rule Before You Start
The kindest thing you can do for a pilot team is agree on how the verdict will be reached before the results arrive. Three outcomes are enough, and each one is a good result because it ends the uncertainty.
Scale
The KPI moved beyond normal noise, operators used the output, and the data held up. Repeat the pattern on a second line and write the playbook for the next plant.
Fix
The signal is real but adoption or data quality held it back. Address the named blocker, extend the run for a fixed number of weeks, and rescore with the same rules.
Stop
The KPI did not move and the cause is the use case itself, not execution. Close it cleanly, document what was learned, and redirect the budget to the next ranked idea.
Suggested decision weights for scoring a pilot
KPI movement against baseline40%
Ease of repeating on another line10%
Weights are a starting suggestion. Adjust them with your finance and operations leads before the pilot begins, then do not change them.
COMMON MISTAKES
Seven Habits That Break the Link
These patterns show up again and again when AI pilots fail to turn into outcomes. Each one is easy to avoid once the team can name it.
1
Starting with the model
Teams pick a technique they like and hunt for a problem afterward, which reverses the ladder.
2
Choosing too many KPIs
Five targets make every result look partly good, so nobody can say clearly whether it worked.
3
Piloting on the easiest line
A calm line proves little. Choose a line where the pain is real and the leader cares about the result.
4
Ignoring the shift handover
If alerts do not fit into the existing huddle, they will be missed on nights and weekends.
5
Counting savings nobody can bank
Minutes saved across a crew are not savings until they become overtime avoided or output gained.
6
Skipping the finance partner
A controller who helped set the target will defend the result later. One who was not will question it.
7
Never closing the loop
Pilots that end without a scale, fix, or stop decision teach the plant that AI work has no consequence.
WHERE IFACTORY AI FITS
The Framework, Applied by iFactory
iFactory AI is smart manufacturing and industrial software built to connect plant data to the outcomes operations teams already track. It is designed to sit beside your existing systems, so the framework can run on the data you have today.
What iFactory connects
Machine and line signals from the equipment already on your floor
Maintenance history, work orders, and stop reasons
Quality checks, batch records, and reject reasons
Order, stock, and production plan data for demand-linked views
What your team gets
A frozen baseline and KPI definition agreed before launch
Use case results shown beside the scorecard operations already trusts
A logged record of every alert and the response it received
A scale, fix, or stop review at the end of the proof window
Common starting points by plant type
Beverage and dairyFiller downtime, shelf-life risk, energy per liter
Snacks and bakeryPacking line micro-stops, giveaway, changeover time
Home and personal careForecast accuracy, SKU complexity, days of cover
Packaged foodsInspection rejects, batch yield, schedule adherence
The fastest way to test fit is a short conversation about one line and one KPI, and you can ask the support team about your plant setup before you book anything.
FREQUENTLY ASKED QUESTIONS
What FMCG Leaders Ask Before Starting a Pilot
How many KPIs should one AI pilot target?
One primary KPI, with at most two supporting measures that act as guardrails. A single target keeps the team focused and makes the final verdict easy to defend. If the pilot touches several areas, split it into separate pilots. You can
pressure-test your KPI choice in a working session.
How long before a pilot can show a result?
Most teams can see a directional signal inside the first thirty days of live operation, but a decision-grade result usually needs the full ninety-day window. That period covers different shifts, products, and changeover patterns. Rushing the verdict risks mistaking luck for improvement.
Ask our team how the timeline applies to your plant.
What if our data is messy or incomplete?
That is normal in FMCG, and the baseline stage is where it gets found and fixed. A data quality check is part of the exit criteria for days sixteen to thirty, so gaps are visible before any model is trusted. Some pilots start with one clean signal and grow from there.
Book a data readiness walkthrough to see where you stand.
Who should own the pilot, IT or operations?
Operations should own the outcome KPI, because they control the shift routines that move it. IT and data teams own the platform, the integrations, and data quality. When both are named in the pilot charter, accountability is clear and blockers get resolved faster.
Reach the support team for a sample charter outline.
What happens when a pilot misses its target?
A miss is still a useful result when it is measured against an honest baseline. The scorecard separates a fixable problem, such as low adoption, from a weak use case, so the budget can be redirected quickly. Teams that close missed pilots cleanly tend to trust the next one more.
Talk through a real scenario with the iFactory team.
FROM PILOT TO PROVEN OUTCOME
Turn Your Next AI Pilot Into a Number Finance Will Sign
iFactory AI helps FMCG plants link every initiative to a baseline, an owner, and a measurable outcome, so the next pilot ends in a clear decision to scale.