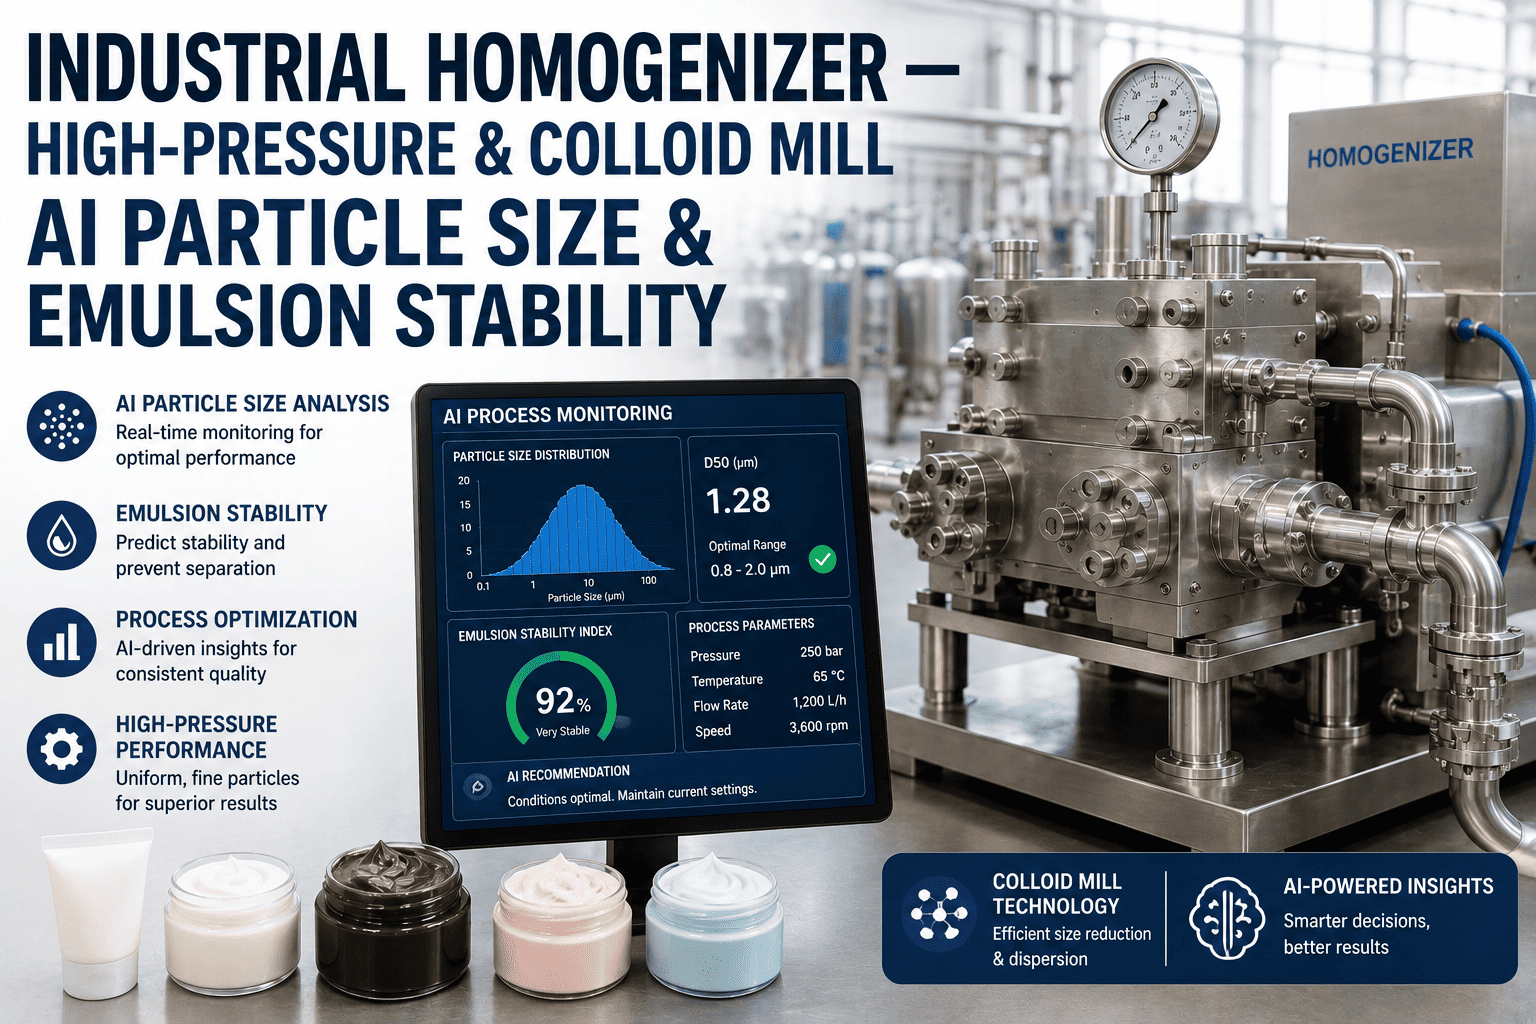
A homogenizer that has drifted two hundred bar off its set operating pressure will still fill every tank on schedule, still pass a visual check on the line, and still show a green status light on the HMI — and it will keep doing that for days while the product inside quietly separates faster than the label promises, or the texture starts reading as "off" to a customer who can't quite say why. Particle size distribution is the one number that actually predicts shelf stability, mouthfeel, and emulsion behavior, and on most lines nobody is watching it continuously. Read on to see how AI-based particle size monitoring closes that gap on high-pressure homogenizers and colloid mills before a batch of product ships with a texture problem nobody caught.
Process Engineering · Homogenization Quality
Your Homogenizer Passed Every Check Today — And Still Drifted Off Spec
AI-based monitoring for high-pressure homogenizers and colloid mills that tracks particle size, emulsion stability, and valve wear continuously — so texture problems get caught before they reach a pallet.
The Hidden Failure Mode
Why Homogenizers Fail Quietly Instead of Loudly
Most process equipment fails in ways that are easy to notice — a pump stops, a motor trips, a line jams. A homogenizer valve wearing down doesn't work that way. As the valve seat and impact ring erode, the machine keeps running at its programmed pressure setpoint, the flow rate stays roughly constant, and every gauge on the panel reads within normal range. What actually changes is the shear force being applied to the product as it passes through the valve gap, and that shear force is what determines whether fat globules, protein aggregates, or emulsion droplets get broken down to the target particle size. A worn valve can be delivering meaningfully less effective homogenization while every instrument the operator can see says the process is fine.
Instruments Read Normal
Pressure, flow, and temperature gauges all stay within their programmed bands even as valve geometry degrades, because none of them directly measure the shear energy actually reaching the product.
Particle Size Isn't Continuous
Most plants check particle size distribution by pulling a sample to a lab a few times per shift, which means a valve that degrades mid-run can produce hours of off-spec product before the next sample catches it.
Symptoms Show Up Downstream
A texture or stability problem traced back to homogenization usually surfaces after packaging, during shelf-life testing, or worse, after a customer complaint — long after the batch has already moved through the plant.
Valve Wear Is Gradual
Homogenizer valves don't fail suddenly; they erode over weeks of cycles, which means the degradation curve is exactly the kind of slow trend that infrequent sampling is least equipped to catch early.
How Continuous Monitoring Works
From Raw Signal to a Particle Size Confidence Score
1
Correlate Process Variables
Pressure differential, flow rate, product temperature, and viscosity readings are pulled continuously from the homogenizer's own instrumentation rather than requiring new sensors on most retrofit installs.
2
Model Effective Shear Energy
The model estimates the actual shear energy being delivered through the valve gap, which is the variable that predicts particle size reduction far more reliably than pressure alone.
3
Track Valve Condition Trend
Small, gradual shifts in the pressure-to-shear relationship are tracked over days and weeks, flagging valve wear well before it would show up as an out-of-spec lab sample.
4
Surface a Confidence Score
Engineers get a running particle size and emulsion stability confidence score between lab checks, rather than having to assume the process is fine simply because the last sample passed.
Close the Gap Between Lab Samples
Stop Relying on a Sample Taken Three Hours Ago
iFactory turns your homogenizer's existing pressure, flow, and temperature data into a continuous particle size and valve condition signal.
Where It Matters Most
Homogenization Quality Across Product Categories
| Application | What Poor Homogenization Causes | Primary Signal Tracked |
|---|
| Dairy (Milk, Cream) | Fat separation, creaming, inconsistent mouthfeel | Fat globule size distribution |
| Beverages (Juices, Plant-Based) | Sedimentation, ring formation, visual layering | Particle size uniformity |
| Sauces & Dressings | Oil-water separation, uneven viscosity | Emulsion droplet stability |
| Personal Care (Lotions, Creams) | Phase separation, grainy texture, poor spreadability | Emulsion consistency |
What Changes on the Floor
What Continuous Monitoring Actually Changes
01
Fewer Off-Spec Batches
Process engineers can intervene once the confidence score trends down rather than waiting for the next scheduled lab sample to confirm a problem that has already been running for hours.
02
Planned Valve Replacement
Valve wear trends give maintenance teams a data-backed replacement window instead of running valves to failure or replacing them on a fixed calendar schedule regardless of actual condition.
03
Faster Root Cause on Complaints
When a texture complaint does surface, the historical particle size trend for that batch is already logged, cutting investigation time from days of guesswork to a quick data pull.
04
Consistency Across Shifts
The same confidence score is visible to every shift, removing the variation that comes from different operators relying on their own experience to judge whether a homogenizer sounds or runs "normally."
Getting It Running
What Onboarding a Homogenizer Actually Involves
Most high-pressure homogenizers and colloid mills already report pressure, flow, and often temperature to a local PLC or SCADA historian, which means the monitoring layer can typically be built on existing instrumentation rather than requiring new sensors on the machine itself. The onboarding process starts by pulling several weeks of historical operating data alongside the corresponding lab particle size results, which lets the model learn the specific relationship between this machine's process variables and its actual output quality — a relationship that varies by product formulation, valve type, and machine model, so a generic threshold rarely works as well as one trained on the specific line.
Once the baseline is established, the model runs continuously in parallel with existing lab sampling rather than replacing it outright. Lab checks continue as the verification method, while the continuous signal fills the hours between samples with an estimate engineers can act on. Over time, as more lab results feed back into the model, the confidence score typically becomes precise enough that some plants extend their sampling interval, freeing up lab time for other quality checks without losing visibility into the homogenization process itself.
Common Questions
Frequently Asked Questions
Does this replace lab particle size testing?
No — lab testing remains the verification method and continues on its normal schedule. The continuous signal fills the gaps between lab samples so engineers aren't operating blind for the hours between checks, and lab results are used to keep refining the model's accuracy over time rather than being replaced by it.
Talk to support about how the two work together on your specific product line.
Does this work on colloid mills as well as high-pressure homogenizers?
Yes — both equipment types work by applying mechanical shear to reduce particle size, just through different mechanisms, and the model is built separately for each machine type using its own relevant process variables and historical lab data rather than applying a single generic model across different equipment.
How is valve wear distinguished from a normal process upset?
Valve wear shows up as a slow, gradual shift in the pressure-to-shear relationship over days or weeks, while a process upset like a viscosity change from a different raw material lot typically shows up as a sudden shift that resolves once the batch changes. The model tracks both timescales separately so a short-term upset doesn't get misread as long-term mechanical degradation.
What data does the plant need to have available before starting?
At minimum, historical pressure, flow, and temperature data from the homogenizer's own control system, along with corresponding lab particle size results covering the same time periods, gives enough to build an initial model. Plants with a longer overlapping history of process data and lab results typically see a more accurate baseline sooner.
Book a demo to walk through what your current data already supports.
Can one model cover multiple homogenizers running different products?
Each machine and product combination is modeled on its own data, since the relationship between process variables and particle size outcome depends heavily on formulation and equipment specifics, but a plant running several homogenizers can have all of them monitored under one unified view for engineers overseeing the full line.
Catch It Before It Ships
Give Your Homogenizer a Continuous Quality Signal, Not Just a Periodic One
iFactory turns existing pressure, flow, and temperature data into a running particle size and valve condition score, so texture problems get caught between lab samples, not after the pallet ships.