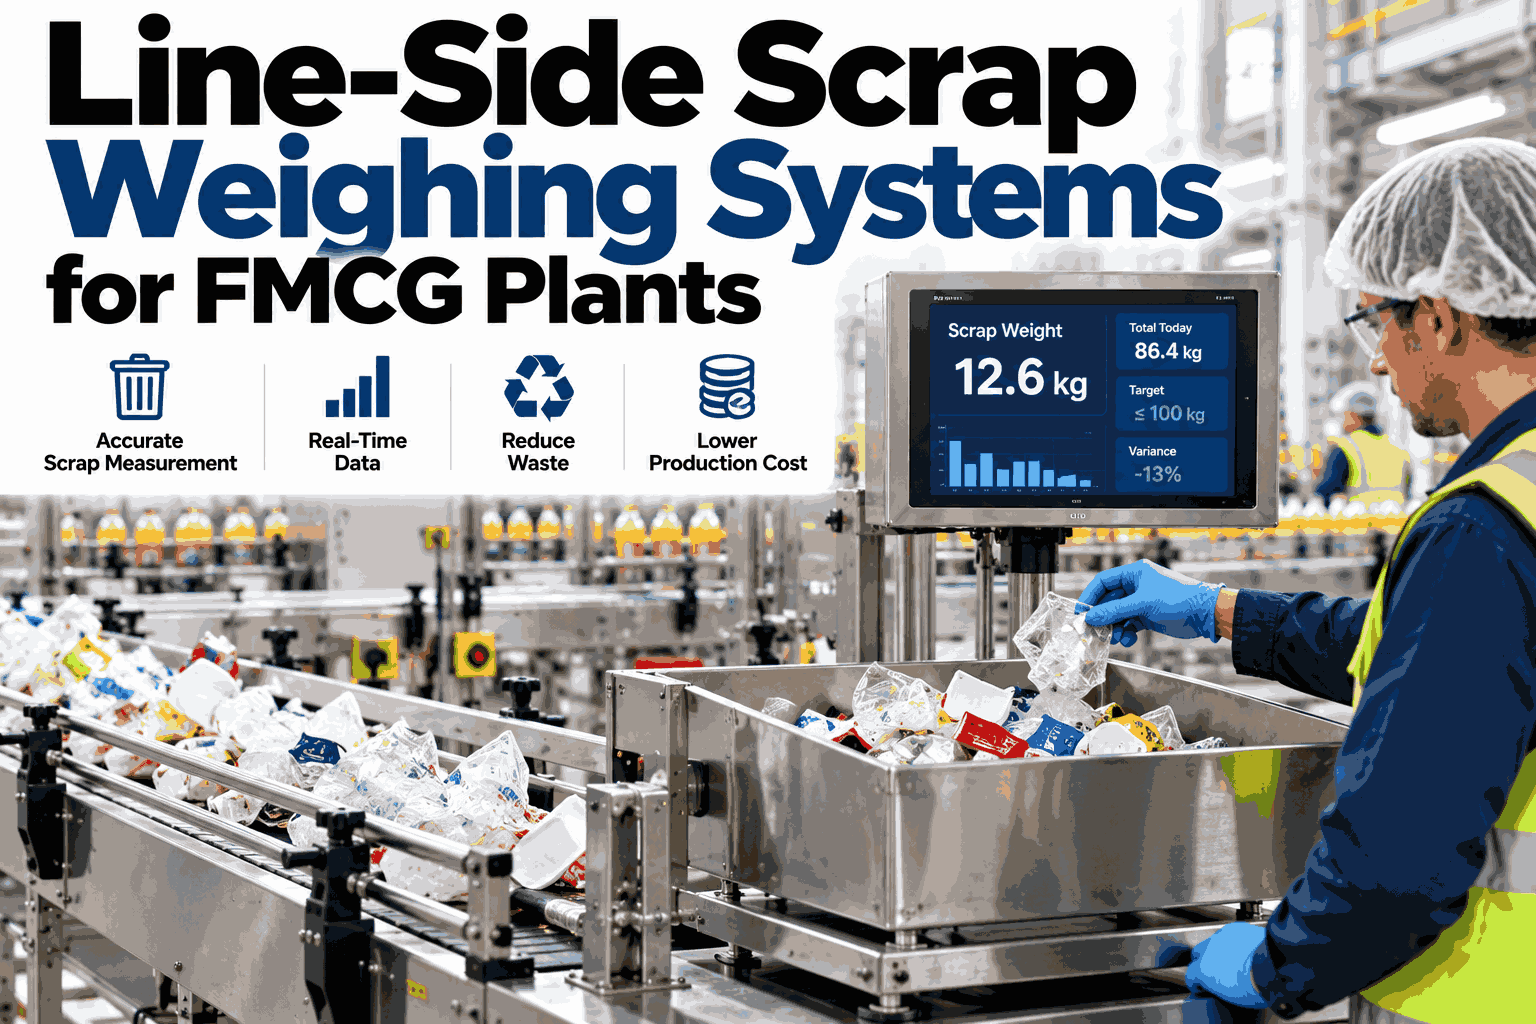
Line-Side Scrap Weighing Systems for FMCG Plants

By James Smith on October 13, 2026

line-side-scrap-weighing-systems-for-fmcg-plants

Walk any FMCG packing hall at the end of a shift and you will see the same scene: bins of rejected packs, trimmed film and spilled product, most of it already mixed together and headed for the skip. The scrap figure that reaches the report is usually a rough estimate written on a clipboard, and by the time anyone reads it the cause has long gone. Line-side weighing changes that by capturing scrap where it happens, the moment it happens, without asking operators to do extra paperwork. This article explains how smart scale systems turn scrap into a daily KPI, and if you want to see it on your own lines, you can review your line-side scrap capture with our team.

Real-time loss detection

Line-Side Scrap Weighing Systems for FMCG Plants

How smart scales, operator-free capture and shift-level attribution turn invisible waste into a number every supervisor can see and act on.

Typical packing line with scrap points
Filler
Spill
Capper
Rejects
Labeler
Label waste
Packer
Cartons
Palletizer
Film
The blind spot

Why Scrap Stays Hidden Until It Is Too Late

Scrap is small, frequent and spread across many stations, so no single event looks serious enough to record.

Estimated, not measured
Counts of bins or boxes replace real weights.
Reported late
Totals arrive at shift end, after the cause is gone.
No owner
Mixed bins cannot be traced to a line, product or shift.
Compare the options

Three Ways to Capture Scrap, Side by Side

The method you choose decides how fast you see a problem and how much operator time it costs.

FeatureClipboard logEnd of shift weighLine-side smart scale
Data timingAfter the shiftAt shift endLive, per event
Operator effortHighMediumVery low
Cause attributionGuessedPartly knownTagged at capture
AccuracyLowMediumHigh
Fast alertsNoneNoneYes
How it works

Operator-Free Capture: What the Person Does and What the System Does

The aim is zero extra steps. Operators keep working as they do today while the system handles the data.

Operator drops rejects into the bin
Scale reads the weight change instantly
Operator carries on with the line
System tags line, product and shift from the schedule
Operator taps one reason if prompted
Reason joins the record with a time stamp
Supervisor glances at the screen
Rate is compared against the target in real time
What the data shows

One Shift, Hour by Hour: Spotting the Spike

This illustrative chart shows scrap weight per hour on one line. The tall bar is a changeover that would never show up in a single shift total.

12

H1
14

H2
11

H3
46

H4
18

H5
13

H6
15

H7
12

H8

Values are in kilograms. With hourly weights, the supervisor can ask what happened in hour four while the answer is still fresh.

Find your hour-four spike

See Where Your Own Scrap Is Hiding

Tell us about your lines and products, and we will show how line-side capture would surface losses by hour, shift and cause.

Attribution

From One Plant Total to a Named Cause

Shift-level attribution works by breaking the total down level by level until someone owns the number.

Plant scrap this week
By line: Line 3 is highest
By shift: night shift on Line 3
By cause: label misfeed after changeover
Action: add changeover check and retrain

Each step takes seconds on a dashboard instead of days of digging through logs. You can ask support how causes are coded for your product range.

Daily KPI

The Scrap Numbers Worth Putting on the Wall

Scrap %
Scrap weight as a share of material used, by line and day.
kg per hour
Live rate that reveals changeover and startup spikes.
Cost of scrap
Weight turned into material and product value.
Top cause
The single biggest reason for scrap this shift.
Avoid these

Four Mistakes That Weaken Scrap Capture

Weighing at one end of the line
Scrap from early stations gets mixed and loses its source.
Too many reason codes
Long lists slow operators, so keep to a short, clear set.
No target to compare with
A number without a target does not prompt action.
Reports nobody reviews
Build the data into the shift handover meeting.
Frequently asked questions

What FMCG Teams Ask Before Installing Smart Scales

Will operators need extra training or extra steps?
Very little. Capture is automatic when scrap is placed in the bin, and any reason prompt is a single tap. Most teams adapt within a shift or two. See the operator view in a live demo with our team.
Can the scales handle wet, sticky or messy scrap?
Industrial scales are built for washdown and rough handling, and placement and covers can be chosen for your product. Local conditions still matter. Ask support about your environment before choosing hardware.
How does the system know which product was running?
It reads the line schedule or production system, so every weight is tagged with the active product, order and shift without manual entry. Review how scheduling data connects on a short call.
Do we need scales on every line from day one?
No. A pilot on one or two lines with the highest known waste is usually enough to prove value and set targets before wider rollout. Plan a pilot with the support team for your plant.
What happens to the data once it is captured?
It feeds live dashboards, shift reports and alerts, and can be joined with downtime and quality data to find root causes faster. See how scrap links to root cause analysis with our specialists.
Make scrap a daily KPI

Bring Line-Side Scrap Weighing to Your FMCG Plant

Book a session with iFactory AI to see how operator-free capture and shift-level attribution can turn scrap from a guess into a number your team acts on.

Share This Story, Choose Your Platform!