A single utility bill tells a plant manager almost nothing about where the kilowatt-hours actually went. One filler, one compressor and one chiller can account for most of the spend, while the rest of the floor barely registers, and without sub-metering there is no way to know which is which. This guide walks through how machine-level energy monitoring is built, what it costs to miss it, and how FMCG plants turn raw meter data into savings they can act on this quarter, not next year. If your team wants to see per-machine kWh on your own floor, book a demo with the iFactory AI team.
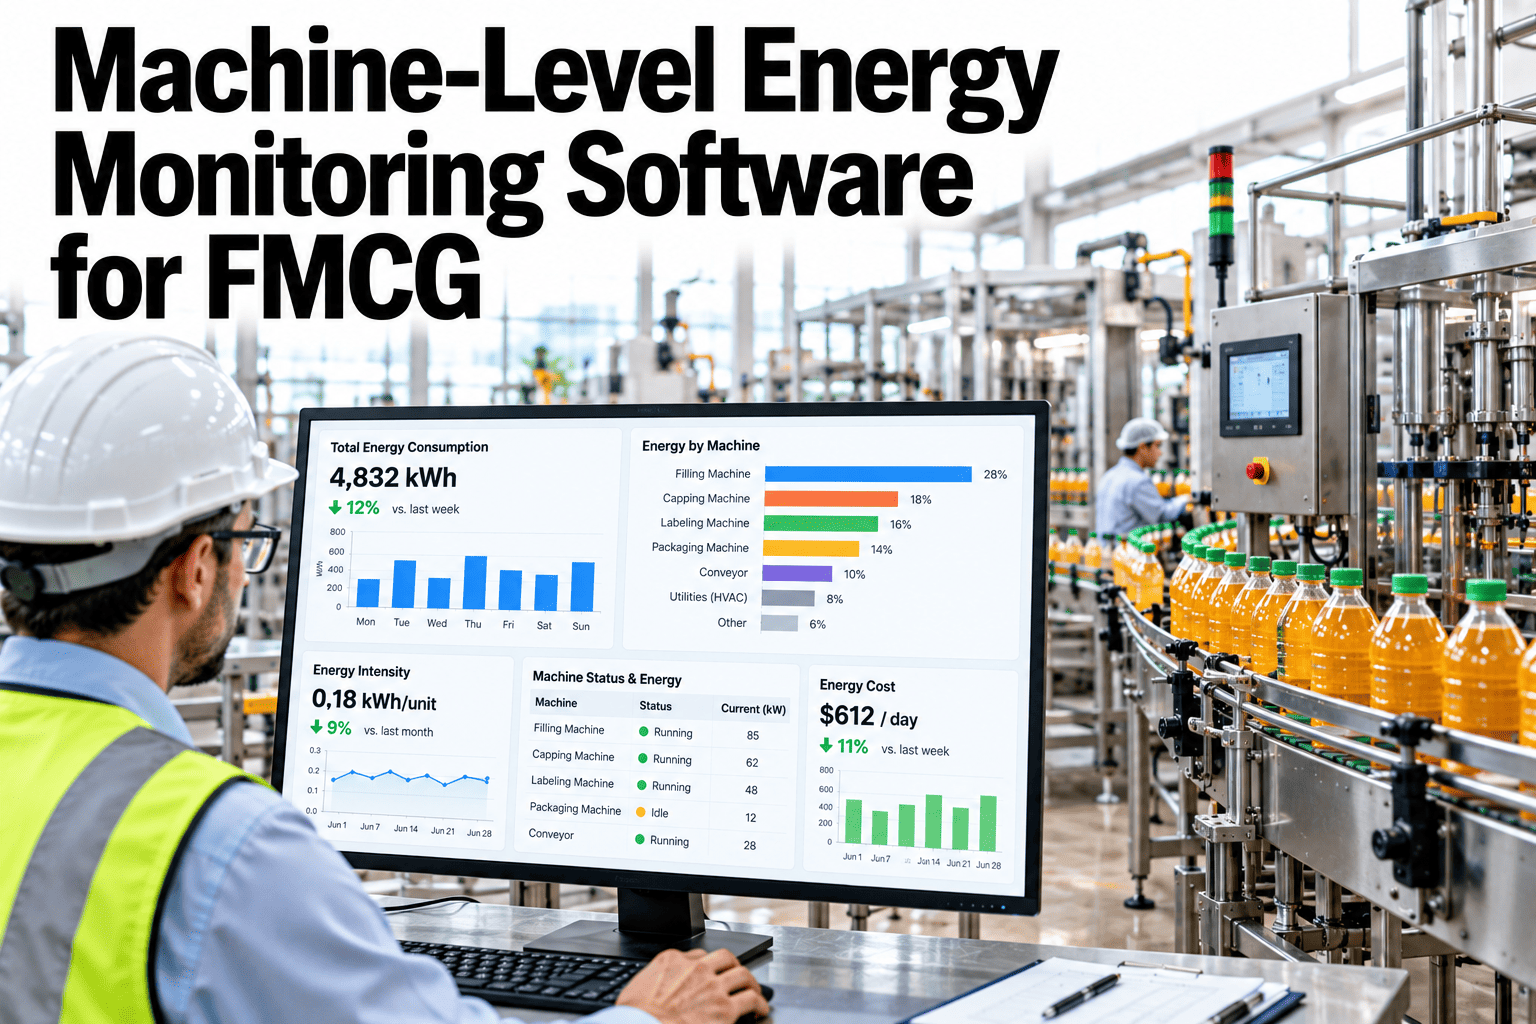
Machine-Level Energy Monitoring Software for FMCG
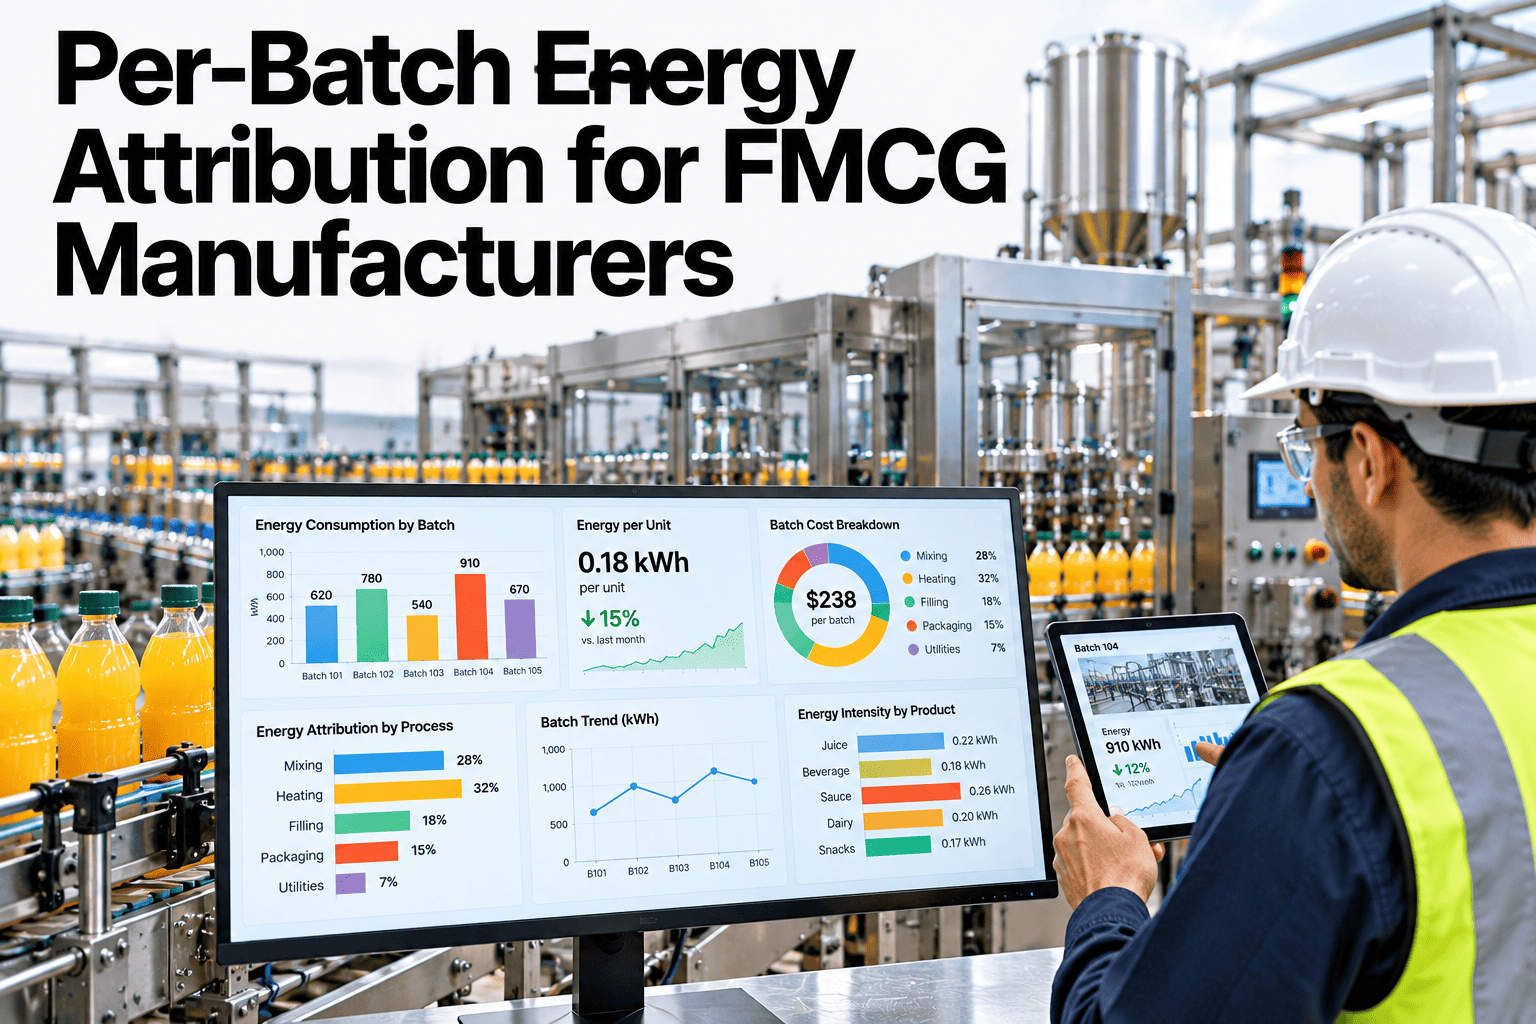
Per-machine kWh, per-batch energy attribution and operating-state breakdowns that reveal savings a plant-wide meter cannot show.
A live read-out like this, built per machine, is what a plant-wide meter cannot give you.
Why Plant-Wide Metering Hides the Answer
A single incomer meter tells you the total bill grew. It cannot tell you whether the cause was a worn compressor, a longer changeover or a chiller running overnight for no reason.
One number, no story
Totals move with production volume, weather and shift pattern all mixed together, so nothing specific can be acted on.
A number you can act on
A single asset's kWh trend, compared against its own baseline, points straight at a fault or a bad habit.
What Gets Metered First
Plants rarely sub-meter every motor on day one. A short priority list captures most of the savings quickly.
| Asset Class | Typical Share of Energy | Why It Comes First |
|---|---|---|
| Compressed air compressors | Large and constant | Runs continuously, leaks compound unnoticed |
| Refrigeration and chillers | Large, often overnight | Standby losses are easy to miss on a plant meter |
| Ovens, dryers and thermal process | Large, batch-linked | Energy should track output tightly, often does not |
| High-speed fillers and packers | Moderate but high-value | Idle time between runs adds up fast |
From Meter Reading to Decision
Raw amperage readings are not useful on their own. Three layers turn them into something a shift supervisor can act on.
See Where Your Kilowatt-Hours Actually Go
Book a 30-minute walkthrough and iFactory AI will show per-machine energy against live production data from your plant.
A Sample Weekly Finding, Illustrative
The figures below are invented to show the pattern a per-machine view surfaces, not a benchmark for your plant.
Rollout in Three Stages
A full-plant rollout is easier to manage as three short stages rather than one long project.
Getting an Alert to the Right Person
A deviation flag that lands in an unread inbox never becomes a saving. Routing matters as much as detection.
Most plants find that maintenance should see mechanical drift, like a compressor trending above baseline, while energy or sustainability teams want aggregated weekly patterns instead of a flood of individual events.
For maintenance
A single asset crossing its deviation threshold, routed immediately to the technician on shift.
For energy managers
A ranked list of the week's biggest deviations across the whole floor, reviewed in one sitting.
Reading a Baseline Without Overreacting
A new baseline naturally has noise in it. The first weeks of sub-metered data will show swings that are not faults, just the normal variation of a real production floor.
A useful rule is to wait for a deviation to repeat across at least three separate run cycles before treating it as a finding worth acting on, rather than chasing every single blip.
Usually noise
A single elevated reading often traces back to a startup sequence or a brief process condition, not a fault.
Worth investigating
The same deviation showing up run after run points to a mechanical or procedural cause that will keep costing money until fixed.
Frequently Asked Questions
How many machines need sub-meters to start?
Most plants start with ten to fifteen of their largest energy consumers, which usually covers more than half of total plant energy. Expanding beyond that list comes later, once the first findings prove the value. Book a demo to size your own priority list.
Does this replace our existing energy management system?
No, it adds the machine-level layer most energy management systems lack. iFactory AI reads meter data and production context together, then feeds findings back into your existing reporting.
How long before we see a real saving?
Many plants see their first flagged deviation, like a drifting compressor or an overnight chiller, within the first few weeks of metering. Larger structural savings take a full seasonal cycle to confirm.
Can this data feed our carbon reporting too?
Yes, the same meter records that drive machine-level savings also feed per-batch and per-product energy figures used in carbon reporting. Ask support how the two connect for your plant.
Turn Every Meter Into a Finding
iFactory AI joins sub-meter data with production context so every kilowatt-hour has a story. Book a walkthrough built around your plant.