Two batches of the same product, made on the same line a day apart, rarely cost the same in energy. One ran during a tariff peak, one followed a longer changeover, and one shared a chiller with another product entirely. Without per-batch attribution, none of that shows up anywhere except the monthly bill. This guide walks through the pipeline that connects sub-meter readings to a single batch record, so cost per unit reflects what actually happened on the floor, and closes with how fast a pilot can run on your own line. Teams ready to see it on real batch data can book a demo with the iFactory AI team.
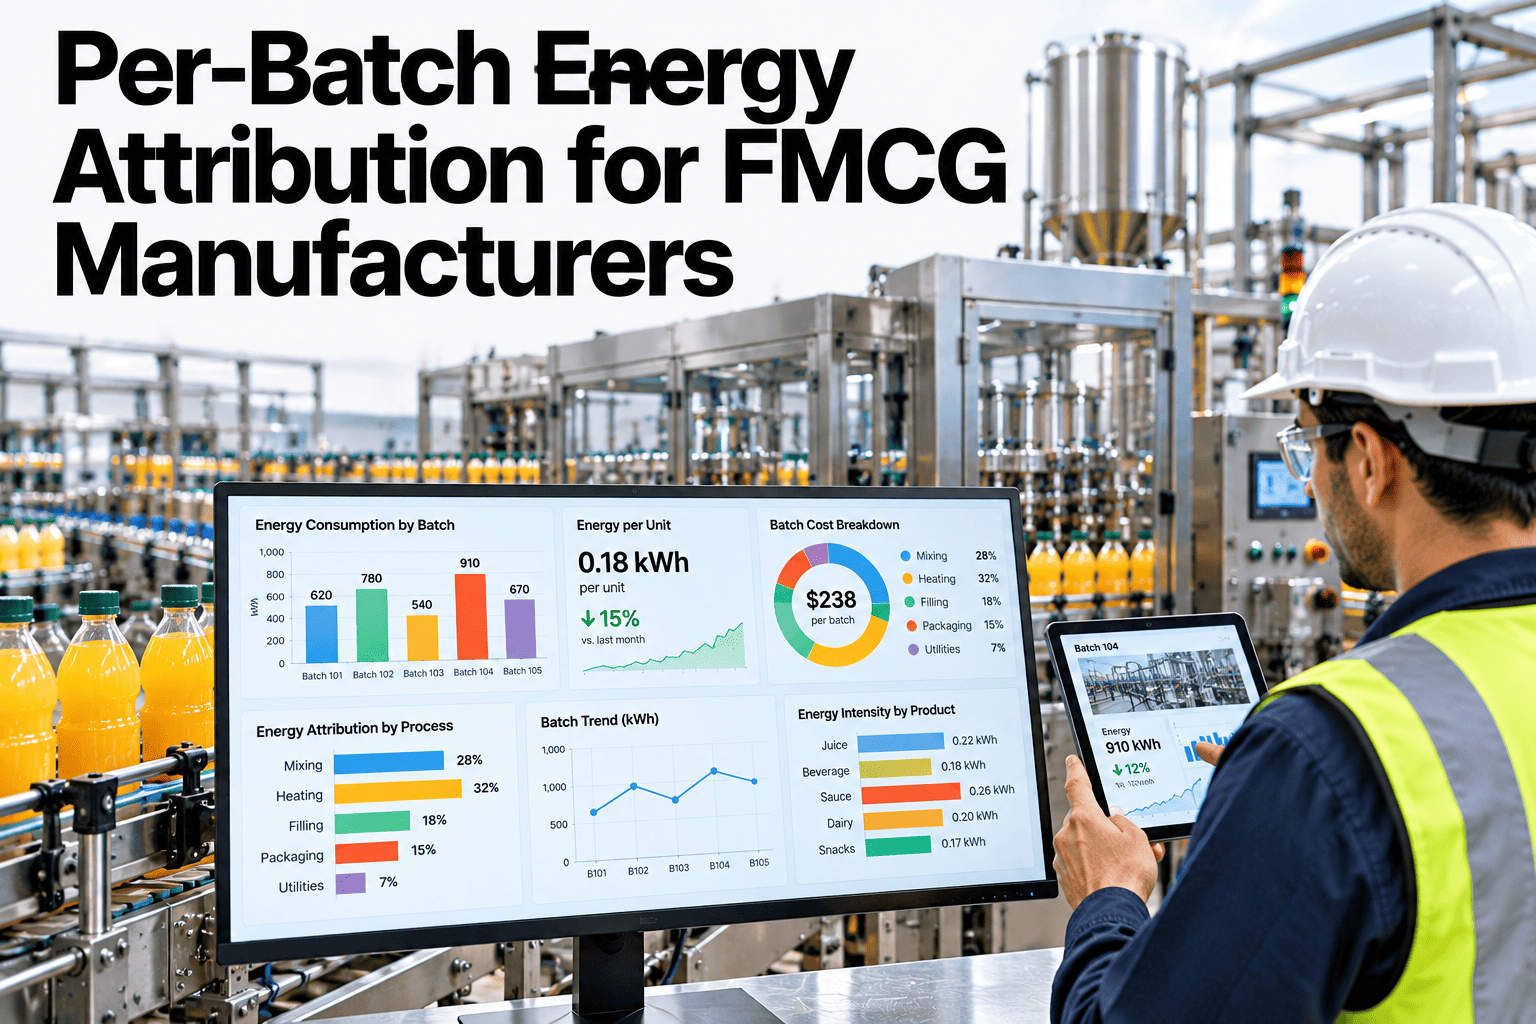
Per-Batch Energy Attribution for FMCG Manufacturers
The data pipeline that ties sub-meter readings to production batches, so cost per unit reflects what each batch actually used.
Why Batches Do Not Cost the Same
A product's standard energy cost is an average. Real batches drift above and below it for reasons that are usually traceable, once the data is linked correctly.
One meter, several products
A kiln, chiller or compressor serving multiple SKUs needs a sharing rule before any single batch's share is honest.
Changeovers and tariffs
A longer changeover or a batch that straddles a peak tariff window changes the true cost without changing the recipe.
The Four-Step Pipeline
Connecting a meter pulse to a batch record is a short, repeatable sequence once the data sources are mapped.
Data Sources Behind the Pipeline
Most of the inputs already exist in plant systems. The work is in connecting them, not collecting them from scratch.
| Source | What It Provides | Feeds Which Step |
|---|---|---|
| Sub-meters | kWh by asset, by interval | Capture |
| MES or batch records | Start, end and product per batch | Timestamp match |
| Line configuration | Which assets serve which products | Allocate |
| Utility tariff schedule | Price by time of day | Attribute |
Know What Every Batch Really Cost
Book a 30-minute walkthrough and see per-batch energy attribution built from your own sub-meter and MES data.
A Sample Batch Record, Illustrative
The figures below are invented to show the method, not to benchmark your product.
Comparing SKUs, Illustrative
Once attribution is live, comparing products on one chart becomes routine instead of a special project.
Common Attribution Mistakes
The same errors show up when plants build their first batch energy pipeline.
Validating the Numbers Before Finance Relies on Them
A new attribution pipeline earns trust the same way any new cost figure does: by matching something people already believe before it is asked to stand on its own.
Most teams run a shadow period, usually four to eight weeks, where the new per-batch figure is tracked alongside the plant's existing standard cost estimate without replacing it yet.
Sum to plant total
All batches attributed in a period should add up to the plant's actual metered energy for that period.
Spot-check a dedicated line
A line with its own dedicated meter offers a direct comparison against the allocated figure.
Review outliers together
Production and finance jointly review any batch whose figure looks unusual before the pipeline goes live.
Where This Data Shows Up Beyond the Cost Sheet
Once per-batch attribution is running, the same records tend to get pulled into conversations well outside the original energy project.
Product development teams use it to compare the true energy footprint of a reformulation before it reaches full-scale production. Commercial teams use it to answer customer questions about a specific SKU's footprint without waiting on a special study.
Product development
Compare pilot-batch energy against the current recipe before committing to a full production run.
Commercial and sales
Answer SKU-level footprint questions from retailers without a one-off data pull each time.
Plant scheduling
Weigh the energy cost of scheduling a high-draw SKU during a tariff peak against running it off-peak instead.
Frequently Asked Questions
How accurate is shared-equipment allocation?
Allocating by concurrent run time typically lands within a few percent of a dedicated sub-meter on each line, which is accurate enough for cost-per-unit decisions. Book a demo to see the allocation tested against your own meters.
Do we need sub-meters on every machine first?
No, start with the assets that drive most of the energy for your highest-volume SKUs. Attribution can expand to more assets as the pilot proves its value.
Can finance use this figure directly in standard costing?
Yes, once reviewed against a few periods of history, the attributed energy cost can feed standard costing the same way labor and material costs do today.
Does this connect to our existing MES?
In most cases, yes. iFactory AI reads batch records from MES and timestamps meter data against them without duplicating your existing system. Ask support which MES platforms connect.
Give Every Batch Its True Energy Cost
iFactory AI connects sub-meter and MES data into per-batch energy attribution your finance team can trust. Book a walkthrough built around your plant.