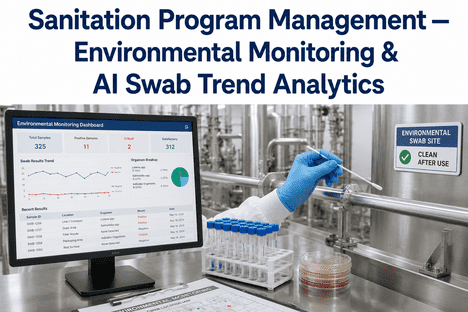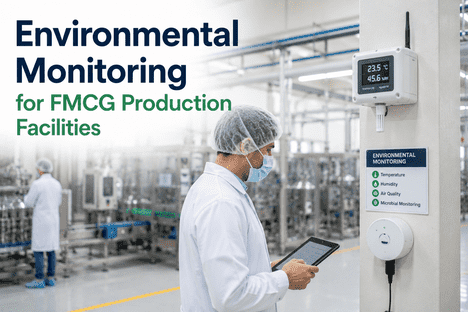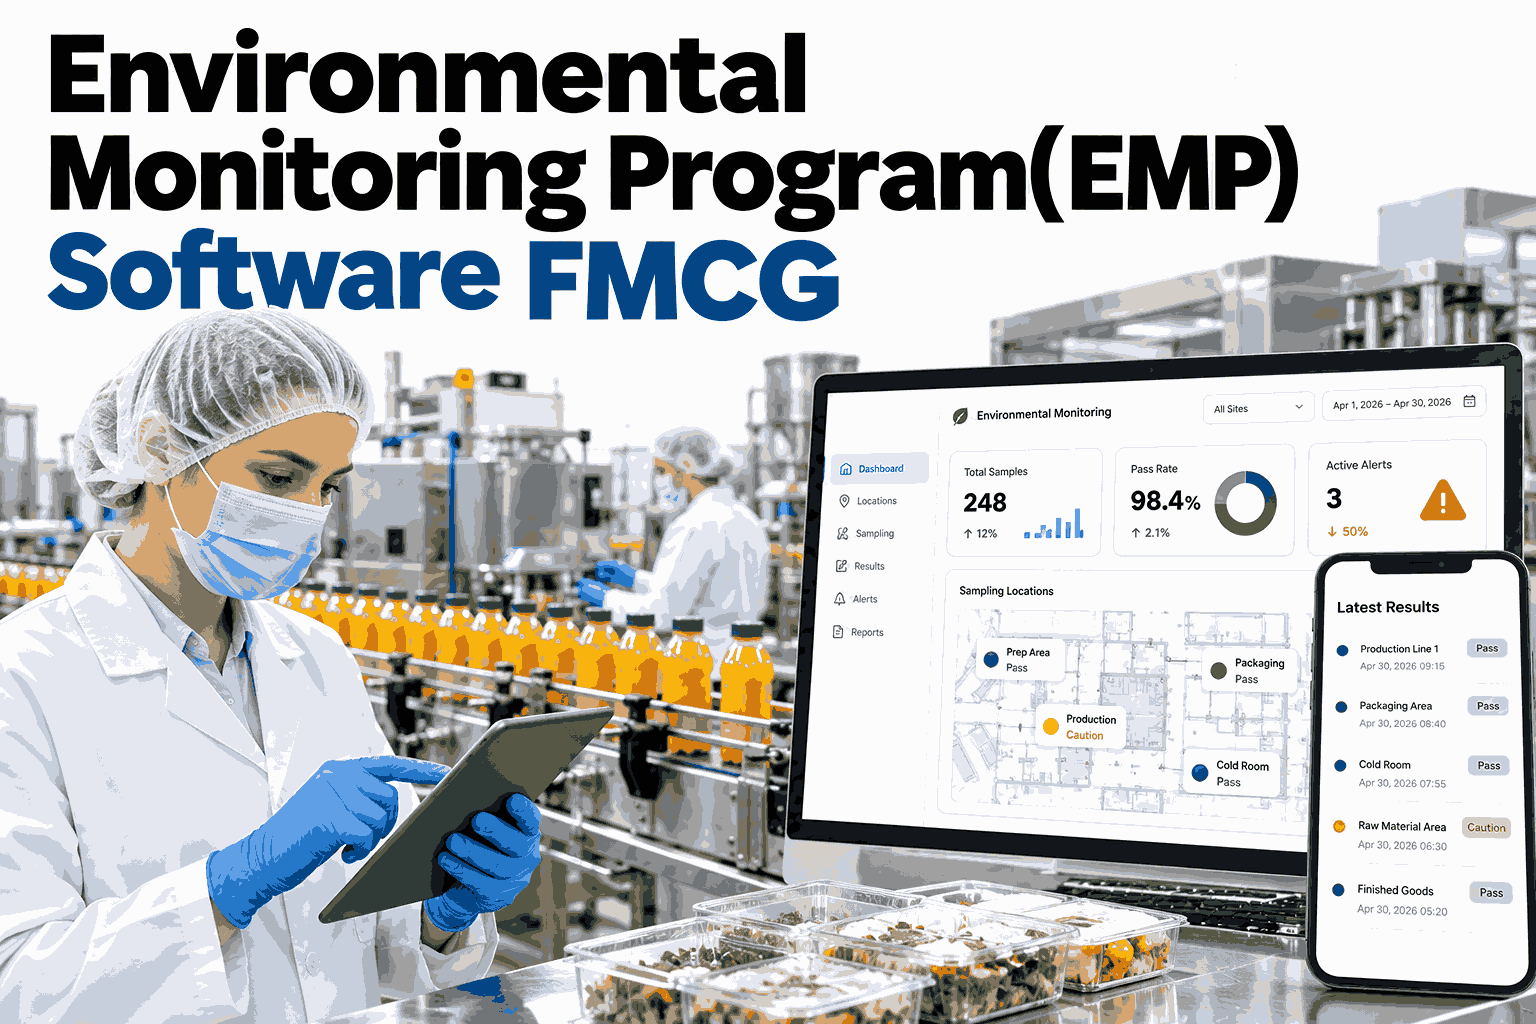
An environmental monitoring program is the early-warning system of a food or consumer goods plant. It does not test the product. It tests the places the product could pick up trouble from, such as drains, conveyor frames, filler nozzles, forklift wheels and the floor beside the line. A good program finds a harbourage niche while it is still small, long before a finished-goods test turns positive. Plants that want their swab plan, zone map and trending to live in one system can have the iFactory AI team review their current monitoring plan and point out where the gaps usually hide.
Find the Niche Before It Finds Your Product
iFactory AI turns your swab schedule, zone map and trending into one connected workflow, so a rising pattern opens an investigation instead of waiting for the next audit.
What an EMP Actually Has to Answer
Strip away the paperwork and every monitoring program asks one cycle of questions, again and again. If one step is weak, the whole loop stops protecting anything.
Map
Divide the plant into zones and register every sample site.
Sample
Swab on a schedule that rotates sites and shifts.
Trend
Read results as patterns, not as single pass or fail lines.
Act
Trigger a defined investigation when a limit or pattern is hit.
Verify
Re-test to prove the fix held, then feed it back to the map.
In many regulated food settings, a monitoring program for ready-to-eat products exposed to the environment is expected as part of the food safety plan, and most GFSI-benchmarked audit schemes look for one as well.
The Four-Zone Model for FMCG Plants
Zones rank sample sites by how directly they can touch product. The closer to the product, the stricter the response when something is found.
Product-contact surfaces
Conveyor belts, hoppers, scoops, filler nozzles, slicer blades, mixing paddles and packaging film paths.
Adjacent to contact surfaces
Equipment frames, outside of guards, control panels, push buttons, tool handles and the underside of machines.
Within the processing room
Floors, drains, forklift and trolley wheels, walls, ceilings and hoses. Often where harbourage niches start.
Outside the processing area
Corridors, locker rooms, break areas, warehouse aisles and dock doors. The route contamination travels in on.
The bars show relative closeness to product, not an official risk score. Zone 3 results often matter most for trending, because a drain that keeps testing positive tells you where to look next.
A Swab Schedule That Does Not Go Stale
Frequency should come from your hazard analysis, not from habit. The table shows common starting points that plants then tighten or relax as their own data builds up.
| Zone | Typical FMCG Sites | Common Test Focus | Typical Starting Cadence |
|---|---|---|---|
| Zone 1 | Belts, nozzles, hoppers, scoops | Indicator organisms, post-sanitation checks | Per shift to weekly on high-risk lines |
| Zone 2 | Frames, guards, panels, handles | Indicator organisms, Listeria spp. or Salmonella by product type | Weekly, rotated across sites |
| Zone 3 | Drains, floors, wheels, hoses | Pathogen or pathogen-indicator testing | Weekly to monthly by area |
| Zone 4 | Corridors, dock doors, locker rooms | Pathogen-indicator testing, traffic-route checks | Monthly to quarterly |
Rotate sites and sampling times across shifts. A program that always swabs the same spot at the same hour after cleaning mostly proves the cleaning worked at that hour.
See Your Swab Plan on a Live Zone Map
Book a 30-minute session and iFactory AI will walk through how your sites, zones and schedule would sit inside one traceable workflow.
One Program, Four Very Different Plants
FMCG covers a wide range of products, and the organism of concern changes with the product. A single copy-paste plan rarely fits more than one of these.
Listeria focus
Wet environments and cold rooms favour Listeria. Drains, condensate and wheels get the most attention, along with hygienic zoning between raw and finished areas.
Salmonella focus
Dry cleaning is common, so water is treated as a risk. Any wet cleaning, leaks or condensation get tighter sampling afterwards.
Spoilage focus
Yeasts, moulds and spoilage bacteria around fillers, caps and rinse systems matter as much as pathogens, because they shorten shelf life.
Microbial limits focus
Water systems, mixing tanks and transfer lines are the usual concern. Monitoring supports microbial limits rather than a ready-to-eat pathogen programme.
Trending: Where the Real Warning Lives
A single positive can be luck. A rising line across weeks is a message. This illustration shows one drain cluster where the pattern became visible well before any product result.
Cuts worth trending every time
Investigation Triggers That Scale With the Zone
The response should be decided before the result arrives. Writing the trigger ladder in advance removes the argument at the moment when speed matters most.
Exact limits and actions belong in your own food safety plan and your regulator or customer requirements. The point of the ladder is that the escalation path is agreed before it is needed.
The First 14 Days After a Positive
A timeline keeps an investigation from drifting. Each window has one job, and every job leaves a record.
A Composite Scenario: The Drain That Kept Coming Back
A packaged-foods plant ran a monthly swab plan that checked every drain once and logged each result as an isolated pass or fail. This is a composite example, not a named customer.
Once the same site was trended across rounds, the repeat pattern pointed to a damaged drain trap behind a wall panel. The fix cost far less than a hold on finished product would have.
A Paper Program vs a Working Program
Most plants already have a monitoring document. What separates programs is what happens between the document and the floor.
Where iFactory AI Fits
iFactory AI builds on digital GMP and audit-ready records, so the monitoring program lives next to the sanitation, maintenance and quality data that explains it.
Scheduled and Rotated Swabs
Sites and sample times rotate automatically, so coverage widens without extra planning effort.
Digital Zone Register
Every site is tied to a zone, a line and an owner, which keeps results traceable to a real place.
Hotspot Trending
Repeat positives by site, shift and event surface as a pattern, not as a row in a sheet.
Trigger-Based Investigations
A result that crosses your limit opens the right investigation with the right tasks and owners.
Linked to Sanitation and Maintenance
Cleaning logs and repair history sit beside the swab result, so root cause is faster to find.
Audit-Ready Records
Results, actions and verification swabs are stored together and ready when an auditor asks.
iFactory AI arrives pre-configured on an NVIDIA server that ships racked and ready with software pre-loaded. Rack it, connect power and Ethernet, and the monitoring workflow runs. Scope covers cabling, network, ERP and MES integration, team training and 24x7 remote monitoring.
Frequently Asked Questions
How many swabs should an FMCG plant take?
There is no single number. It depends on product risk, plant size and past results, so most plants start with a risk-based plan and adjust it. Zone 3 and Zone 2 sites usually need the widest coverage. Ask the iFactory AI team for a second opinion on your sampling plan if you are unsure where to start.
Should we test for pathogens or for indicator organisms?
Most programs use both. Indicator organisms are cheap and fast to trend across many sites, and they flag where conditions favour growth. Pathogen testing is usually targeted at higher-risk zones and ready-to-eat environments, in line with your own hazard analysis.
What is vector swabbing?
It is a set of follow-up swabs taken outward from a positive site to find how far the problem has spread. It helps locate a harbourage niche or the route contamination is travelling on, instead of guessing at the source.
How often should we review EMP trends?
Review them on a regular cycle and after any event that could change the environment, such as construction or a major repair. Waiting until the audit tends to hide patterns that were visible weeks earlier. See how automated trending compares with a manual review cycle in a short walkthrough.
Can software replace the EMP team?
No. People still swab, judge risk and decide on product. Software keeps the schedule, the record and the trend honest, and makes sure the right investigation starts without relying on someone remembering to start it.
Turn Your Swab Results Into Early Warnings
iFactory AI connects your zone map, swab schedule and investigation workflow so patterns surface early. Book a walkthrough to see it against your own plant and product types.