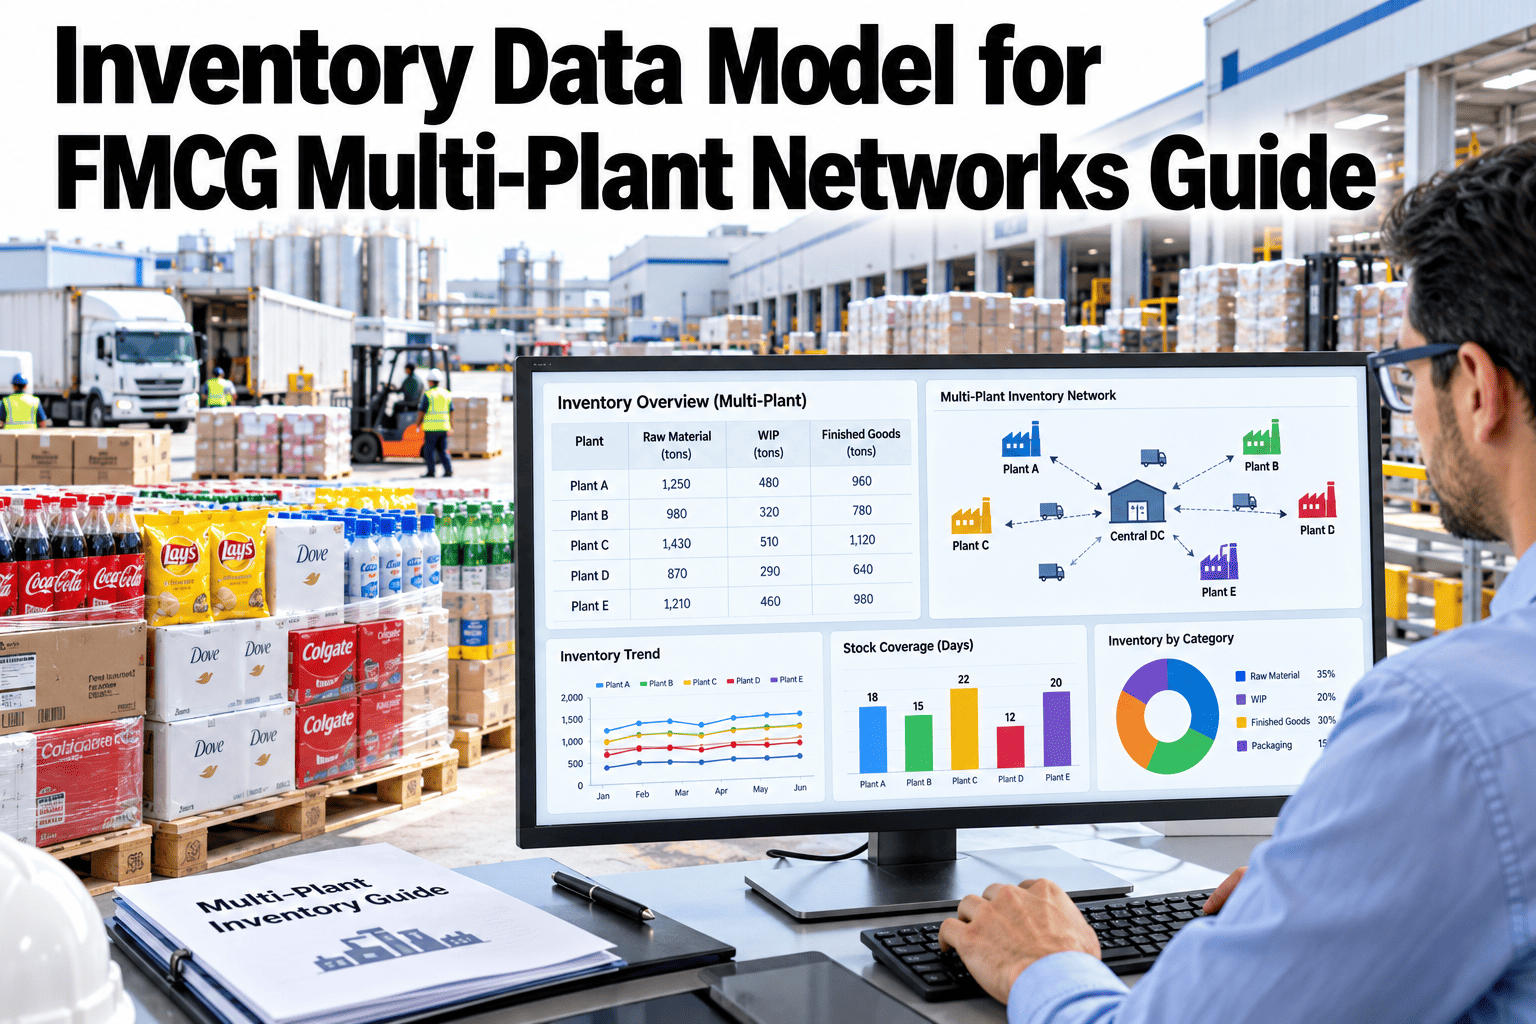
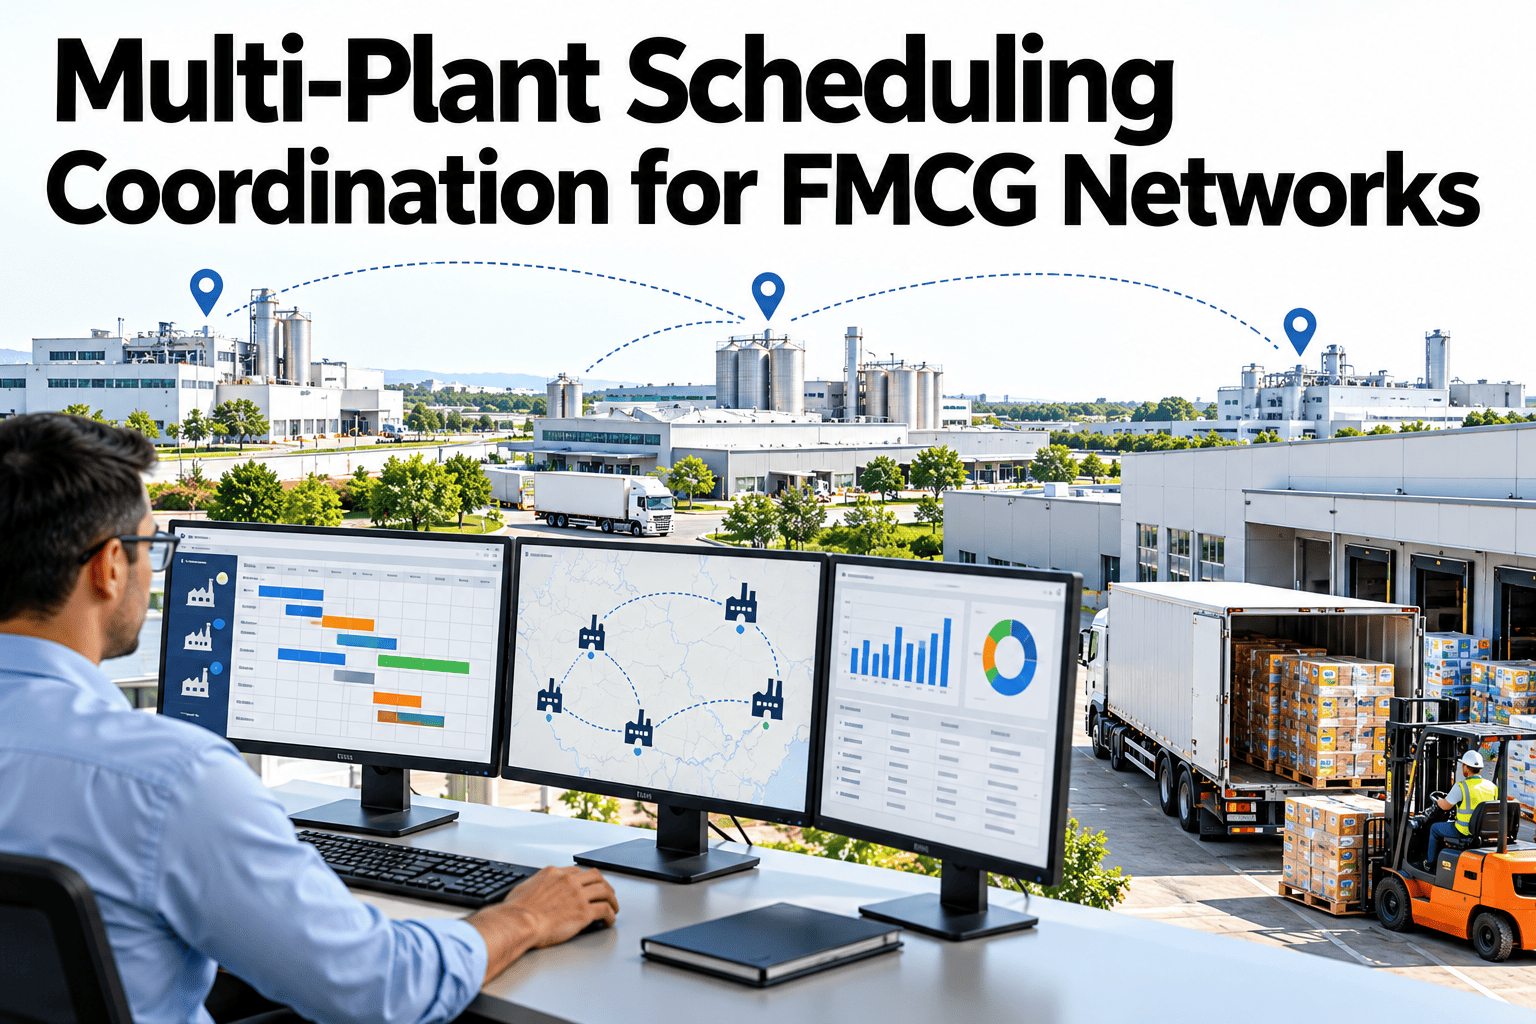
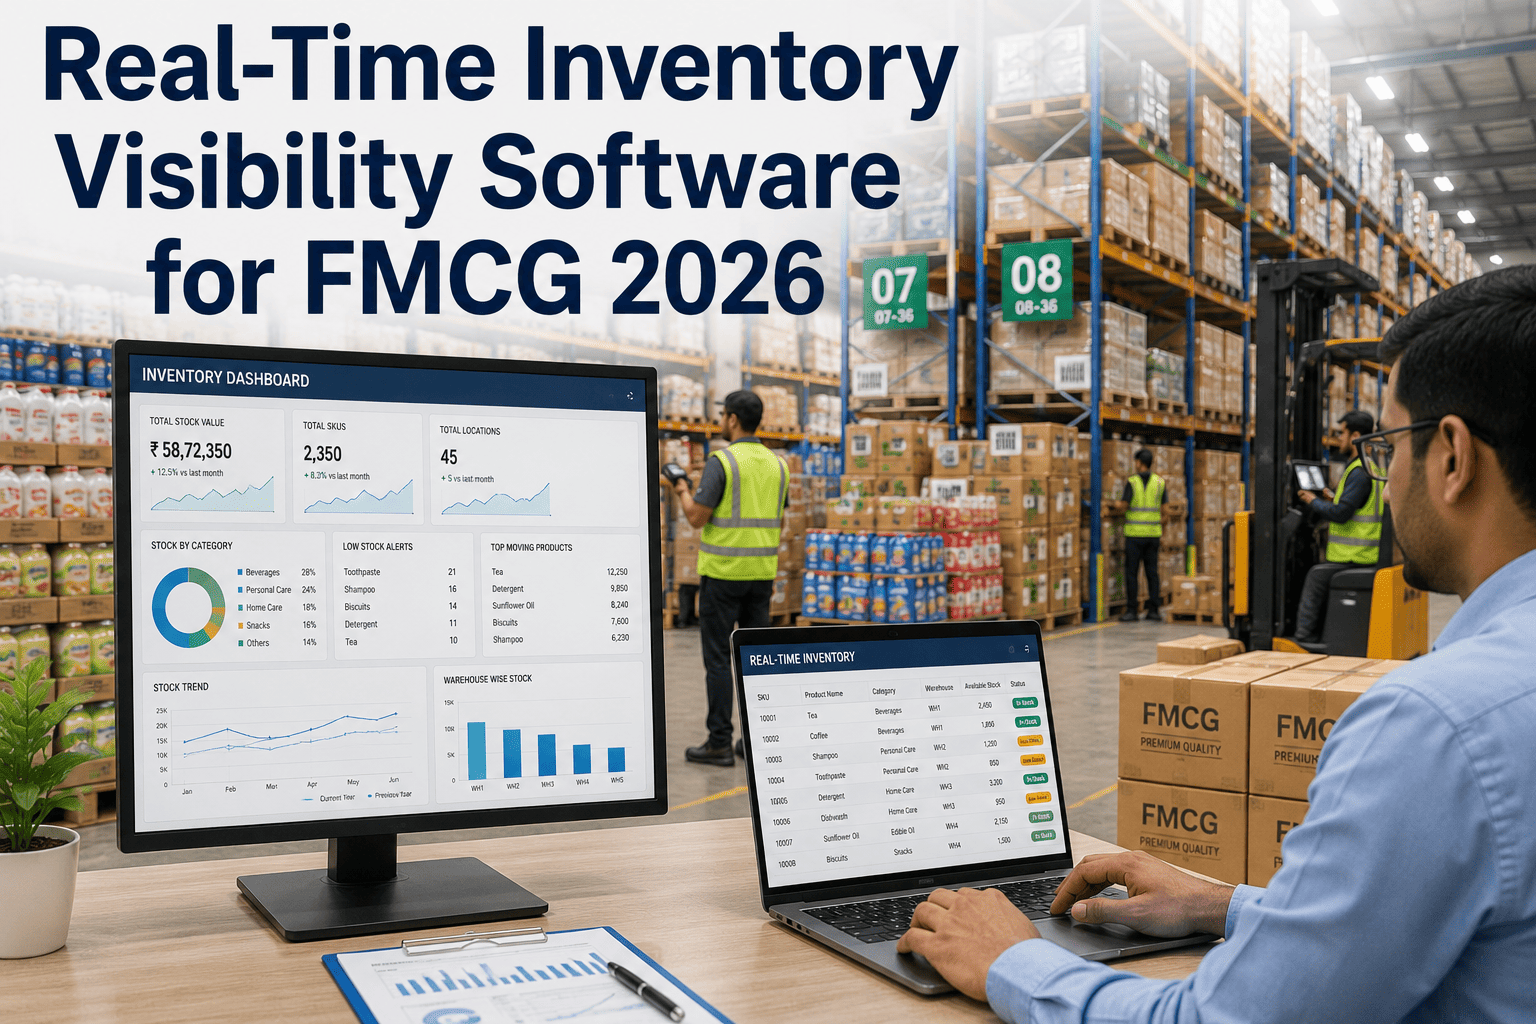
Most FMCG networks plan inventory one location at a time, so each plant, distribution centre and store sets its own buffer and the network ends up carrying more stock than it needs. Multi-echelon inventory optimisation treats the whole chain as one system and decides where each unit of safety stock does the most good. The result is usually less total inventory for the same service level, or better service for the same stock. To see how this could work for your network, you can walk through a network inventory model with our team.
FMCG inventory and multi-location sync
Right-Size Stock at Every Node by Planning the Whole Network as One System
iFactory AI connects plant, distribution and store data so inventory targets reflect how the network really behaves.
Echelons in one connected network
Plant
Regional DC
Local DC
Store
The local trapEach Location Optimising Alone Overstocks the Network
Every node adds a safety buffer for its own uncertainty. The buffers pile up along the chain.
Plant buffer
Covers production variability
Regional DC buffer
Covers delivery and demand swings
Local DC buffer
Covers its own variability again
Store buffer
Covers shelf demand
Multi-echelon planning asks a different question. Where in the network is stock most valuable?
The echelonsFour Layers of a Network Plan
Plant and supplier
Production lead times, lot sizes and capacity.
Regional distribution
Pooled demand for many stores and long replenishment cycles.
Local distribution
Shorter lead times to stores with more variable demand.
Store
Shelf stock, space limits and local service targets.
Stock held higher in the network can serve many locations. Stock held low serves one but responds faster.
Risk poolingCombining Demand Reduces the Buffer Needed
Holding stock centrally covers several stores with less total safety stock than each store holding its own. The effect grows with the number of locations combined.
Pooled safety stock = individual safety stock x square root of the number of locations (equal, independent demand)
100
Safety stock each, held separately
200
Total if pooled centrally
This is a simplified illustration with equal and independent demand. Real networks differ, but the principle is robust.
See How Much Stock Your Network Could Release
Share node-level inventory, lead times and service targets and see how iFactory AI would model your network as one system.
Network viewConnect Every Node to One Planning Model
Plants and co-packersRegional and local DCsStores and customers
Multi-echelon inventory model
Node stock targetsReplenishment signalsService level reports
One model sees how a delay at the plant affects every store downstream and how demand at stores shapes plant needs.
InputsWhat a Multi-Echelon Model Needs
| Input | Why it matters | Common issue |
|---|
| Demand by node | Sets what must be served | Forecast bias and promotions |
| Lead times and variability | Drives safety stock | Averages hide variation |
| Service targets | Define how much protection is needed | Targets not tied to value |
| Costs and constraints | Holding, handling and space limits | Unclear cost data |
| Shelf life and lot sizes | Limit how much stock is sensible | Ignored in simple models |
Where the stock sitsAn Illustrative Distribution of Inventory by Node
Many networks hold more stock in locations than the model would suggest. This split is illustrative.
30 percent: Plant
Finished goods and buffer.
30 percent: Regional DCs
Pooled stock for many stores.
25 percent: Local DCs
Short lead time to stores.
15 percent: Stores
Shelf and backroom stock.
The right balance depends on lead times, demand variability and shelf life. Fast-moving, stable items often sit lower. Slow, volatile items often sit higher.
Service and costMatch Stock Strategy to Product Type
Product profile
Fast, stable demand
Slow, volatile demand
Long shelf life
Push to stores
Hold close to the customer
Hold centrally
Pool volatile demand where it can be shared
Short shelf life
Fast replenishment
Keep stock low and flows quick
Make to order or tight control
Limit stock to protect freshness
Single-echelon versus multi-echelonWhat Changes When the Network Is Planned Together
Location by location
Each node sets its own buffer
Lead times assumed fixed
Service targets set locally
Total stock hard to explain
Multi-echelon
Buffers placed where they are most valuable
Lead time variability modelled
Service targets linked to network value
Total stock explained by the model
Who needs to agreeNetwork Planning Is a Team Effort
Supply planning
We own the model and the targets.
Manufacturing
We share capacity, lot sizes and changeover limits.
Logistics
We share lead times and constraints between nodes.
Sales and finance
We agree service levels and the value of inventory.
Each function owns part of the inputs. To plan roles, ask our team for a network planning roles template.
RolloutFive Steps to Network-Level Inventory Planning
1
Map the network
List plants, DCs and store groups with lead times.
2
Gather data
Collect demand, variability and cost by node.
3
Build the model
Start with one category and one region.
4
Compare with today
Check the model's targets against current stock.
5
Adopt and extend
Roll out targets and widen to other categories.
Network map with all nodes and lead times
Demand and variability by node
Service targets agreed with sales
Holding and handling costs estimated
Shelf life and lot size constraints included
Pilot category and region chosen
Comparison with current targets reviewed
Owner named for the model and for each node
Expert reviewWhat a Supply Network Planning Director Would Check First
A multi-echelon model is only as good as its lead time and demand data. Good inputs, simple governance and clear service targets matter more than model complexity.
Verdict
Strong when lead time variability and service targets are modelled honestly.
Watch for
Models that use average lead times and ignore shelf life.
Do next
Model one category across one region and compare with current buffers.
Frequently asked questionsWhat FMCG Teams Ask About Multi-Echelon Inventory Optimisation
What is multi-echelon inventory optimisation?
It is a method that sets inventory targets for every node in a network together, instead of one location at a time. It considers lead times, demand variability and service targets across plants, distribution centres and stores.
See a network example.
How much inventory can it reduce?
Results vary widely with network design, current practice and product mix. Many plants find meaningful reductions for the same service, but you should test on your own category data before expecting a number.
Ask about estimating the effect.
Does it work for short shelf life products?
Yes, but shelf life becomes a key constraint, so models should include it explicitly. Stock may need to sit closer to the customer to protect freshness.
Discuss perishable products.
What data quality do we need?
Reasonable demand history, lead times with variability and clear service targets are essential. Gaps in lead time data are a common weakness.
Ask about data readiness.
How do we start?
Pick one category and one region, build the model with current data and compare its targets with what you hold today. Learn from the gaps before scaling.
Plan a pilot.
One network, one plan
Hold the Stock Your Network Actually Needs
Book a session with iFactory AI to map your network, model service targets and find where stock can be released or better placed.