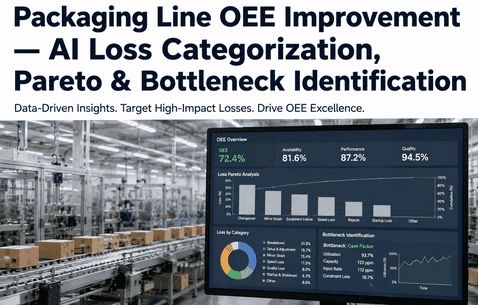
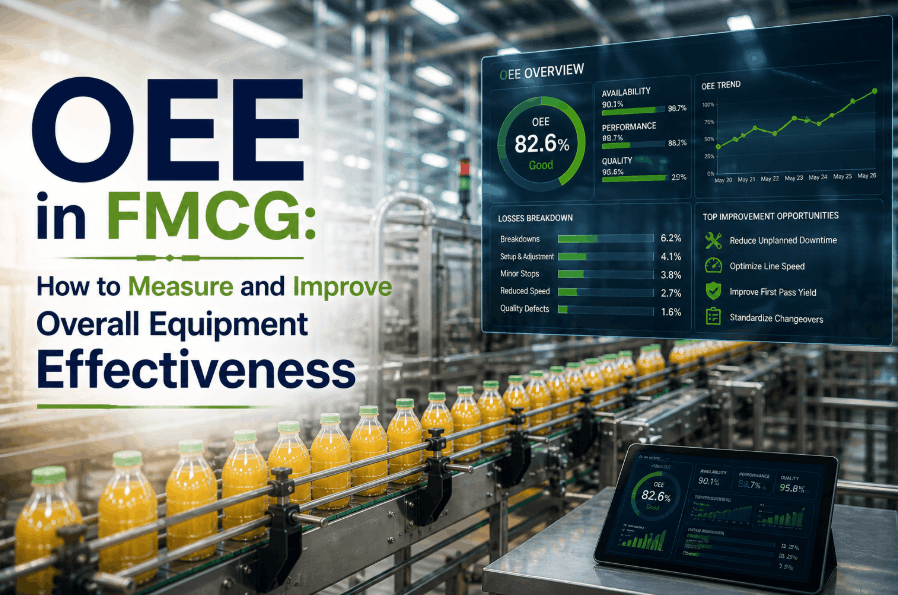
OEE in FMCG manufacturing has become the single most important performance metric separating world-class plants from average ones. Overall Equipment Effectiveness combines availability, performance, and quality into one score that exposes where production capacity is silently bleeding away. World-class FMCG plants run at 85% OEE; the global average sits closer to 60% — a 25-point gap representing hundreds of millions in lost revenue across consumer goods manufacturing. The good news: most plants can recover 15–25% hidden production capacity within 12 months simply by measuring OEE correctly and acting on the right losses. Teams that book a demo with iFactory typically uncover their three largest OEE loss categories within the first week of dashboard deployment.
Measure, Benchmark, and Improve OEE Across Every FMCG Line
iFactory's real-time OEE dashboard turns availability, performance, and quality losses into actionable, line-by-line, shift-by-shift intelligence.
Why OEE Is the Defining KPI for FMCG Manufacturing Efficiency
Overall Equipment Effectiveness is the only metric that captures the three dimensions of production performance in a single, comparable score. A line running at 95% availability looks healthy in isolation — until performance losses from minor stops and quality losses from rework drag actual OEE down to 58%. FMCG plants relying on individual KPIs in isolation routinely overestimate true efficiency by 20–30 points, masking the recoverable capacity hiding in plain sight on every line. Manufacturers that book a demo with iFactory discover that their reported OEE figures often differ from automated, sensor-derived OEE by 8–15 percentage points — a gap that becomes hard to ignore once exposed.
Availability
Run time divided by planned production time. Captures breakdowns, changeovers, material starvation, and any unplanned stoppage that consumes scheduled production minutes.
Performance
Actual output divided by theoretical maximum at ideal cycle time. Exposes minor stops, reduced speed running, and the silent performance drift that quietly eats throughput.
Quality
Good output divided by total output. Captures scrap, rework, startup losses, and every unit that fails to meet specification on the first pass through the line.
OEE Score
Availability × Performance × Quality. The compound metric that exposes the true production capacity of any FMCG line — and the hidden capacity available for recovery.
How to Calculate OEE: The FMCG-Specific Formula
The OEE calculation is mathematically simple but operationally demanding. Each input must be measured consistently, automatically, and across every shift — or the resulting OEE benchmark becomes uncomparable across lines and over time. The formula below is the standard accepted across FMCG manufacturing, with all three factors expressed as decimals between 0 and 1, then multiplied together to produce the final OEE percentage.
Availability
Run Time ÷ Planned Production Time. A line scheduled for 480 minutes that ran for 384 minutes scores 80% availability.
Performance
(Ideal Cycle Time × Total Count) ÷ Run Time. A line running 8% below rated speed scores 92% performance.
Quality
Good Count ÷ Total Count. A line with 3% scrap and rework scores 97% quality.
OEE Result
0.80 × 0.92 × 0.97 = 71.4% OEE. Above average, but well below the 85% world-class benchmark — 14 points of recoverable capacity.
OEE Benchmarks: Where Does Your FMCG Plant Actually Sit?
Knowing your OEE score in isolation is useful; knowing where that score sits against industry benchmarks is transformative. The benchmark distribution below reflects current global FMCG manufacturing performance and provides the reference points needed to translate an OEE number into a strategic improvement target.
| OEE Range | Performance Tier | What It Means for an FMCG Plant |
|---|---|---|
| 85%+ | World-Class | Top 5% of FMCG plants globally. Minimal availability loss, near-rated speed performance, sub-1% quality loss. Considered the practical ceiling for most packaging lines. |
| 75–85% | High Performance | Strong OEE position with active improvement programs. Most multinational FMCG flagship plants target this band as a working benchmark for daily operations. |
| 60–75% | Industry Average | Where the majority of FMCG plants actually operate. Significant recoverable capacity in minor stops, changeover time, and first-pass quality losses. |
| 40–60% | Below Average | Common in older plants, high-mix lines, and facilities without real-time OEE visibility. Typically masks 25–35% of true production capacity. |
| Under 40% | Critical | Severe systemic losses — chronic breakdowns, extended changeovers, or major quality issues. Requires immediate root-cause intervention before incremental improvement. |
The Six Big Losses That Destroy OEE in FMCG Manufacturing
Every OEE point lost on an FMCG line can be traced to one of six standard loss categories. Mapping each loss to its underlying OEE factor — availability, performance, or quality — is the foundation of any structured production line OEE improvement program. Plants that book a demo with iFactory get their losses automatically categorized by the real-time dashboard from the first day of deployment.
Equipment Breakdowns (Availability Loss)
Unplanned downtime from mechanical, electrical, or control failures. Typically the largest single OEE loss category in FMCG plants without predictive maintenance — often consuming 8–15% of planned production time before improvement programs begin.
Setup and Changeover Time (Availability Loss)
SKU changes, format changeovers, and recipe transitions. The second-largest availability drain in high-mix FMCG environments — and the loss category with the highest ROI from SMED programs and structured changeover sequencing.
Minor Stops and Idling (Performance Loss)
Brief stoppages under 5–10 minutes — jams, misfeeds, sensor faults, operator interventions. Almost always under-reported in manual logs, often accounting for 8–12% of OEE loss invisible without automated capture.
Reduced Speed Running (Performance Loss)
Lines running below rated cycle time due to operator caution, equipment drift, or chronic minor faults. The most chronically under-measured OEE loss — and frequently the largest single recoverable capacity opportunity in mature FMCG plants.
Startup and Yield Losses (Quality Loss)
Scrap and rework produced during line startup, post-changeover stabilization, and recipe transitions. Particularly costly on high-value FMCG SKUs where raw material giveaway compounds quality loss financially.
In-Process Defects (Quality Loss)
Defective units produced during normal running — sealing faults, label defects, fill variations. The quality loss category where AI vision inspection and inline sensing deliver the fastest measurable OEE recovery.
See Your Real OEE Numbers — Not What the Shift Sheets Say
iFactory replaces manual OEE estimation with continuous, sensor-derived measurement across availability, performance, and quality.
How to Improve OEE in FMCG: A Sequenced Improvement Roadmap
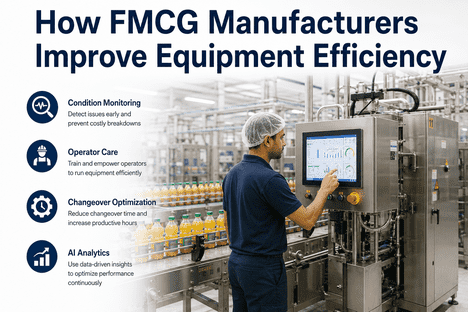
Sustainable OEE improvement follows a predictable sequence. Plants that attempt to fix every loss simultaneously typically achieve marginal gains and lose organizational momentum within a quarter. The roadmap below — used by world-class FMCG manufacturers — concentrates improvement effort on the largest losses first, then systematically narrows the gap to the 85% world-class benchmark. Teams that book a demo with iFactory receive a customized improvement sequence based on their own loss distribution.
Measure Truthfully
Replace manual OEE logs with automated, sensor-derived capture. Baseline true OEE per line, per shift, per SKU. Expose the gap between reported and actual performance before targeting improvements.
Attack Top 3 Losses
Focus the first 90 days on the three largest loss categories per line. Typically yields 5–10 OEE points without capital investment — pure operational and behavioral change.
Eliminate Minor Stops
Use automated minor-stop capture to find the hidden 60-second stoppages invisible to operators. Address root causes systematically rather than treating each stop individually.
Sustain at 85%+
Lock in gains with daily OEE huddles, shift handover dashboards, and continuous improvement cycles. Move from project-based to embedded performance management.
OEE in FMCG Manufacturing: Frequently Asked Questions
What is considered a good OEE score for an FMCG packaging line?
85% OEE is the recognized world-class benchmark for FMCG packaging lines. The global industry average is approximately 60%, meaning most plants have 15–25 percentage points of recoverable capacity available without adding equipment or labor.
Why does my reported OEE differ from sensor-derived OEE?
Manually reported OEE typically overstates true performance by 8–15 points because operators under-report minor stops, round changeover times down, and use planned cycle times rather than actual cycle times. Automated capture eliminates this measurement bias.
Which OEE loss category should we target first?
Always start with the largest single loss category exposed by accurate measurement. For most FMCG plants, this is either equipment breakdowns or minor stops — both of which respond quickly to structured root-cause analysis and predictive analytics interventions.
How long does it take to improve OEE by 10 points?
Plants that combine accurate OEE measurement with focused loss elimination typically achieve a 10-point OEE improvement within 9–15 months — the majority of gains arriving in the first 90 days from attacking the top three loss categories.
Does OEE measurement require new sensors or equipment?
Most FMCG lines already have the necessary data sources — PLC signals, counters, and existing sensors. iFactory ingests these inputs through standard industrial protocols, deriving full OEE without requiring new hardware in the majority of deployments.
Ready to Recover 15–25% Hidden Capacity Across Your FMCG Lines?
iFactory's real-time OEE dashboard delivers automated availability, performance, and quality measurement — exposing the true OEE of every line and the largest losses available for recovery.