An OEE score of 68 percent means very little to a board, a finance leader, or anyone whose job isn't reading production dashboards every day. A dollar figure per case, per line, per month means something to everyone in the room immediately. The gap between those two ways of expressing the exact same underlying loss is often the difference between a continuous improvement project that gets funded and one that gets nodded at and shelved. Building the bridge from OEE points to cost is less about new data and more about translating data that already exists into the language the budget gets approved in. Executives and plant finance partners can see how iFactory AI converts OEE loss into dollars per case on live production data before the next capital planning cycle.
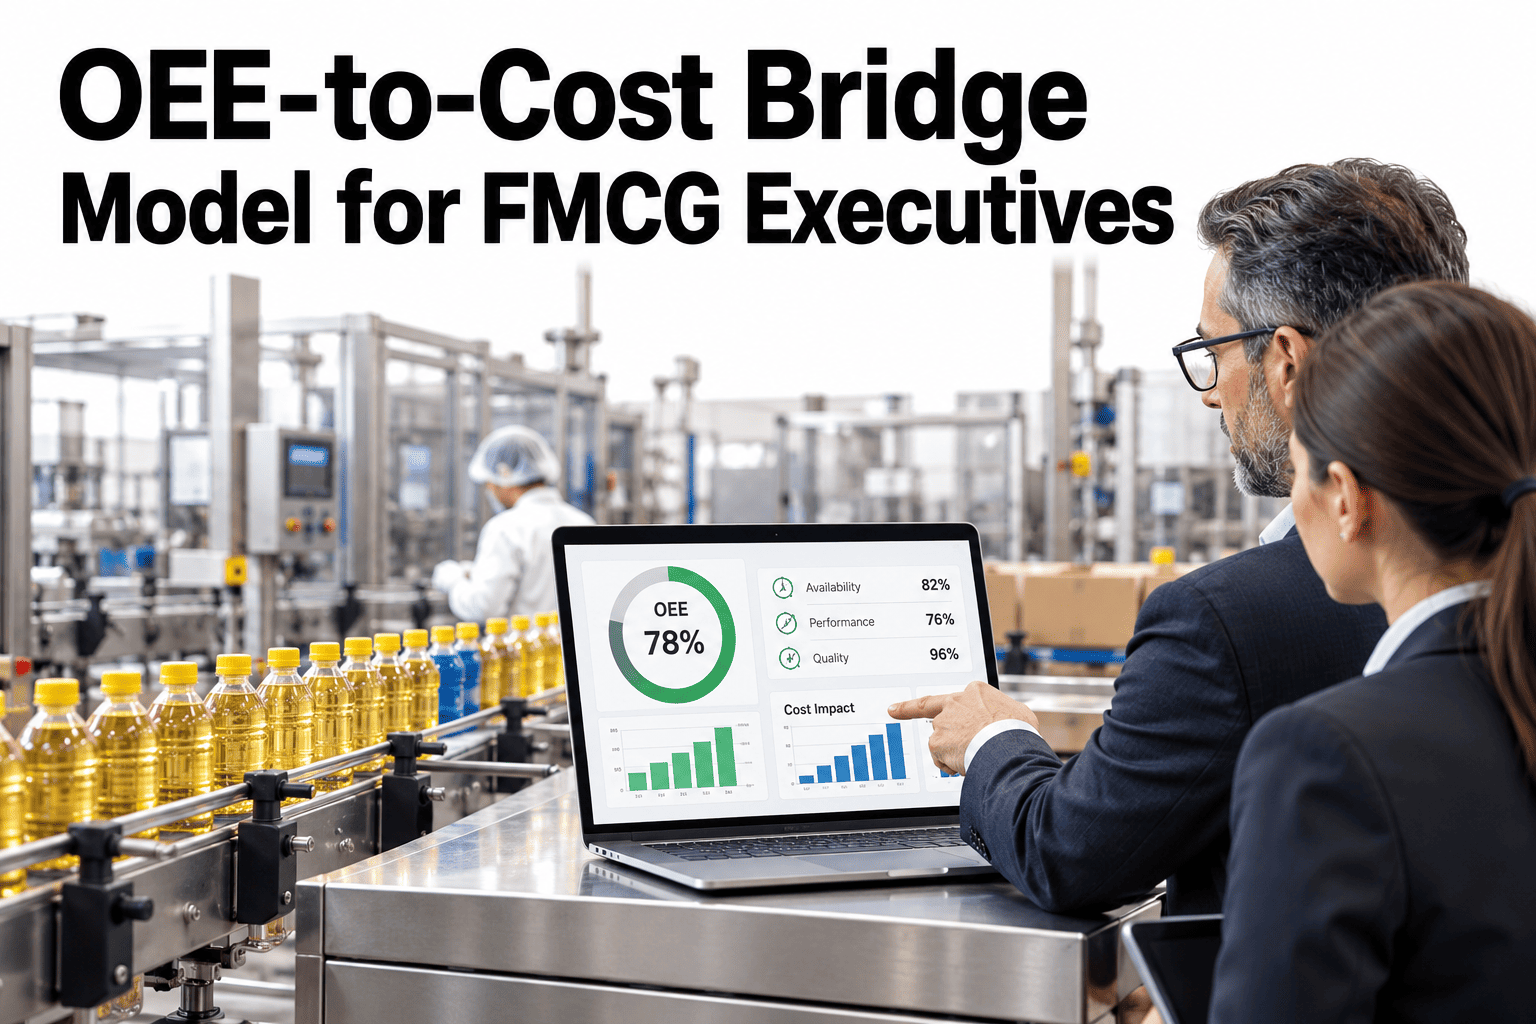
OEE-to-Cost Bridge Model for FMCG Executives
Convert every OEE point into dollars per case, per line, per month, so the board focuses on the losses that actually matter.
Why Percentages Don't Travel Upward Well
An OEE percentage is a precise, useful number for the people who work with it daily. It loses most of its meaning the moment it leaves the production floor.
OEE percentage is immediately meaningful to supervisors who know what drives it.
Still useful for comparing lines, but starting to lose urgency outside operations.
A percentage point rarely competes for attention against other dollar-denominated priorities.
The loss is real at every level. Only the dollar figure travels the full distance to where funding decisions actually get made.
The Four Numbers the Bridge Needs
Converting OEE into cost is a calculation, not a guess, and it needs these specific inputs to hold up to scrutiny.
| Input | Where It Comes From | Why It's Needed |
|---|---|---|
| Rated line output | Equipment specification or validated rate | Sets the theoretical maximum cases the OEE gap is measured against |
| Contribution margin per case | Finance, by product or product family | Converts lost cases into a real financial value, not just volume |
| Actual OEE by line and period | Production data systems | Shows the real gap between rated and actual output |
| Fixed versus variable cost split | Finance, by cost category | Determines whether lost capacity also represents lost margin or just lost volume |
Build This Model Using Your Own Line and Finance Data
Book a 30-minute session and iFactory AI will walk through building a dollars-per-case OEE bridge using your own rated output, OEE and contribution margin figures.
A Simplified Worked Example
The figures below are illustrative to show the arithmetic, not a claim about any specific plant's numbers.
Extended across a line's operating days in a month, that daily figure is what turns a "we're a few points below target" conversation into one with a clear number attached.
From Model to Board Slide
The model itself needs to be assembled before it can be presented. These four steps turn production and finance data into something executive-ready.
Confirm rated output
Validate the baseline capacity figure for each line being modeled.
Get margin figures from finance
Secure contribution margin per case by product or family.
Calculate the gap in dollars
Apply the formula consistently across lines and periods.
Rank by dollar impact
Present losses ranked by cost, not by percentage, for board review.
The OEE-to-cost models that hold up under finance scrutiny are the ones built with finance in the room from the start, agreeing on the contribution margin figure and the fixed-versus-variable cost treatment before the model is presented anywhere, rather than a production team's own estimate of what a case is worth. A dollar figure that finance later disputes undermines the credibility of the entire exercise, even when the underlying OEE data was accurate all along. Get the margin and cost assumptions signed off by finance first, and the rest of the model becomes a straightforward translation exercise that nobody in the room has reason to challenge.
Where iFactory AI Fits
iFactory AI converts OEE and loss data into dollars per case automatically, using finance-confirmed margin figures, so the board sees cost, not just percentages.
Automatic dollar conversion
OEE loss is converted into dollars per case, per line, per month without manual spreadsheet work.
Finance-aligned margin inputs
Contribution margin figures are confirmed with finance and applied consistently across the model.
Ranked loss reporting
Losses across lines and loss categories are ranked by dollar impact for board-level review.
Ask in plain language
Ask what this month's OEE gap cost in dollars across the plant and receive a direct answer.
Frequently Asked Questions
What data do we need to build an OEE-to-cost bridge?
Rated line output, actual OEE by line and period, contribution margin per case from finance, and an understanding of fixed versus variable cost treatment, since all four are needed to convert a percentage gap into a credible dollar figure. You can watch this model built on sample line and finance data in a live session.
Why does finance need to be involved in building this model?
The contribution margin figure and cost treatment assumptions carry real weight in the final dollar number, and a model built without finance's agreement on these inputs risks being challenged or dismissed the moment it's presented, however accurate the underlying production data was. To align this with your finance team, request a cost bridge alignment session with the iFactory AI team, or ask support what data inputs are needed.
Should the dollar figure use fixed or variable cost assumptions?
It depends on what the figure is meant to represent, since treating the full contribution margin as lost assumes the volume would have actually sold, while a narrower variable-cost view is more conservative, and finance should weigh in on which framing fits the intended audience. A short product tour of cost treatment options shows how this choice is made.
How often should the OEE-to-cost figure be reported?
Monthly is common for executive reporting, giving enough data to smooth out day-to-day noise while still surfacing trends quickly enough to act on, though the right cadence depends on how often the audience reviewing it meets. See how reporting cadence is set up in a guided walkthrough.
Does a higher dollar figure always mean the loss should be fixed first?
Not automatically, since the dollar figure should inform prioritization alongside the cost and feasibility of actually fixing the underlying cause, not replace that judgment entirely, a large loss tied to an expensive, long-lead capital fix may still rank behind a smaller one that's cheap to address. Schedule a walkthrough of prioritization alongside the cost model to see how this balance is struck.
Give the Board a Number They'll Actually Act On
iFactory AI converts OEE loss into dollars per case automatically. Book a walkthrough to see it built around your own lines and finance data.