Total Productive analytics (TPM) for FMCG Implementing the 8 Pillars
By Seren on June 10, 2026
Every shift in an FMCG plant is a race between throughput targets and equipment degradation. The high-speed filling line that ran at 98% OEE on Monday morning is down to 74% by Thursday afternoon because the capper head accumulated product residue, the date coder nozzle clogged, and the conveyor bearing temperature drifted outside the operating window for six hours before anyone noticed. Total Productive Maintenance was designed for this exact problem — but the traditional TPM model, built in the 1970s for automotive assembly lines, assumes a plant manager who can afford to pause production for morning team circles and paper-based pillar boards. FMCG plants running 24/7 with 15-minute changeover windows, CIP cycles that consume the first hour of every shift, and quality holds that can strand an entire palletizer lane need a TPM model that runs at the speed of the line, not the speed of the meeting calendar. That model is TPM powered by AI-driven analytics — and the 8 pillars are the framework that delivers it.
Total Productive Analytics (TPM) for FMCG: Implementing the 8 Pillars with AI-Driven Execution
Autonomous maintenance, planned analytics for robotic and packaging equipment, quality analytics, and focused improvement — all synchronised through a single AI-native TPM module that tracks pillar maturity in real time.
Average OEE improvement across FMCG plants that implement AI-driven TPM within the first 6 months
6.2 hrs
Mean time between autonomous maintenance interventions when analytics-driven triggers replace fixed-interval schedules
41%
Reduction in unplanned downtime reported by FMCG plants using AI-powered planned maintenance analytics for robotic packaging lines
3.1x
Faster kaizen cycle completion when focused improvement teams operate on real-time loss data from the TPM analytics layer
What Is TPM for FMCG — and Why the Traditional Model Falls Short at Line Speed
Total Productive Maintenance for FMCG is a structured methodology that aims for zero breakdowns, zero defects, and zero accidents by involving every operator, technician, and plant executive in equipment ownership and continuous improvement. The 8 pillars provide the framework — autonomous maintenance, planned maintenance, quality maintenance, focused improvement, early equipment management, training and education, safety health environment, and TPM in administration — but the traditional model depends on manual data collection, paper-based pillar scorecards, and weekly team meetings that review what happened three shifts ago.
In a high-speed FMCG plant running 20,000 bottles per hour on a single filling line, three shifts of data lag means 60,000 units have already passed through the quality checkpoint before the pillar team identifies the loss pattern. The autonomous maintenance operator cleans the packing head on a fixed schedule, not when the residue accumulation sensor crosses the threshold that precedes a pick-and-place failure. The planned maintenance team rebuilds cartoner modules on a calendar basis, not when the vibration signature indicates the cam follower is entering the accelerated wear zone. The traditional TPM model is structurally incapable of operating at the speed of an FMCG line because its data cycle — observe, record, meet, decide, act — was designed for shifts, not minutes.
AI-driven TPM closes this gap. The 8 pillars remain the framework, but every pillar operates on real-time equipment data instead of manual records. Autonomous maintenance triggers are generated by sensor state and processing rate deviation rather than a calendar. Planned maintenance schedules optimise around production windows and predictive failure signals instead of fixed intervals. Quality maintenance detects off-spec conditions at the moment the process variable drifts, not when the QC lab releases the hold. The pillar maturity score — traditionally a quarterly self-assessment — becomes a live dashboard that shows exactly how each pillar is performing against target at every line, every shift, every hour.
The Core Distinction for FMCG Plant Leaders
Traditional TPM tells you your autonomous maintenance score dropped at the quarterly pillar review. AI-driven TPM tells you your autonomous maintenance score is declining in real time because the frequency of operator-cleaned residue events on the capper heads is climbing, the cleaning effectiveness metric has fallen below the 90% threshold, and three specific stations on Line 2 are driving the trend — all before the next shift starts.
The 8 Pillars of TPM — Rebuilt for AI-Driven FMCG Operations
Each of the 8 TPM pillars contributes a specific loss-reduction mechanism to the overall equipment effectiveness equation. In a traditional TPM program, these pillars operate semi-independently through separate teams and separate scorecards. In an AI-driven TPM implementation, they operate as an integrated analytics layer where the output of one pillar becomes the input trigger for another — autonomous maintenance cleaning events feed the planned maintenance model, quality maintenance defect records drive focused improvement kaizen themes, and every pillar's maturity is measured from the same equipment data set.
1. Autonomous Maintenance
Operator-driven equipment care triggered by analytics, not calendars
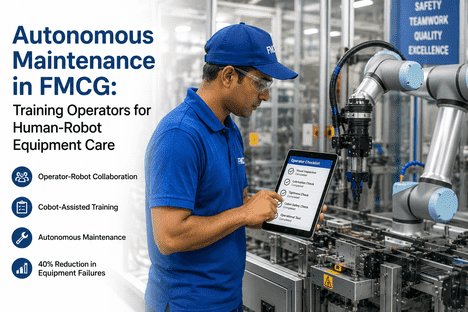
Autonomous maintenance is the first pillar and the foundation of TPM. It transfers basic equipment care — cleaning, inspection, lubrication, and minor adjustments — from the maintenance department to the production operator. In FMCG, this means operators clean and inspect filler valves, labeler rollers, capper chucks, conveyor guides, and date coders on a cadence that matches the actual soiling rate of each station rather than a fixed shift schedule. The iFactory TPM module tracks autonomous maintenance completion per station, per shift, with cleaning effectiveness measured by downstream defect rate and equipment state sensors. When an operator's autonomous maintenance checklist for the filler infeed is incomplete, the system escalates to the pillar lead before the residue accumulation triggers a speed reduction.
Autonomous maintenance completion rate tracked per line per shift, with cleaning effectiveness correlated to downstream defect rate
2. Planned Maintenance
Predictive and preventive scheduling for robotic and packaging equipment
Planned maintenance in an AI-driven TPM framework moves beyond calendar-based rebuild schedules to condition-based and predictive maintenance triggered by equipment state data. For FMCG robotic packaging cells — palletizers, case packers, cartoners, and stretch wrappers — vibration, temperature, current draw, and cycle time trend data determines when a gearbox needs lubrication, when a servo motor bearing is entering the wear zone, and when a gripper pad has reached the end of its effective life. The system optimises maintenance windows around production schedules and CIP cycles, ensuring planned downtime occurs at the lowest-cost moment rather than the most convenient calendar slot. The planned maintenance pillar score is computed from adherence to the AI-optimised schedule and the trend of unplanned downtime per equipment class.
Planned maintenance adherence vs. schedule compliance tracked per equipment class, with unplanned downtime trend overlay
3. Quality Maintenance
Zero-defect condition management through real-time process analytics
Quality maintenance shifts the quality control paradigm from inspection-based defect detection to condition-based defect prevention. In FMCG, this means identifying the process variable range — filler temperature, capper torque, labeler tension, date coder dwell time — that must be maintained to produce zero-defect output at every station. The quality maintenance pillar in iFactory's TPM module monitors each quality-critical process variable against the zero-defect condition window, generating an alert when a variable drifts outside the band but before it produces an off-spec unit. The pillar logs every quality event with the specific process condition that caused it, building a machine-learning model of defect-to-condition correlation that becomes more precise with every shift.
Zero-defect condition window tracked per station, with out-of-band alerts issued before defect events materialise
4. Focused Improvement
Kaizen driven by loss data prioritisation, not team vote
Focused improvement — the kaizen pillar — targets the elimination of the six big losses: breakdowns, setup and adjustment, idling and minor stoppages, reduced speed, defects and rework, and startup losses. In a traditional TPM program, the kaizen theme for the month is selected by team consensus from whatever losses the team remembers from the previous period. In an AI-driven TPM framework, the focused improvement pillar ranks every loss by its financial impact, frequency, and trend direction — computed from real-time OEE data per line, per station, per shift. The kaizen team does not choose a theme; the data presents the top-three losses ranked by ROI of resolution, and the team selects from the list. The pillar tracks kaizen cycle time, loss reduction before and after, and the financial impact per kaizen event.
Kaizen themes ranked by loss impact and resolution ROI, with completed kaizen events tracked against OEE improvement
5. Early Equipment Management
Maintenance prevention built from equipment data across the installed base
Early equipment management — maintenance prevention (MP) and initial phase management — applies the knowledge gained from maintaining current equipment to the specification, design, and commissioning of new equipment. In FMCG plants where every new packaging line represents a multi-million dollar capital commitment, the early equipment management pillar builds a feedback loop between the maintenance history of existing equipment and the procurement specification for new lines. When the maintenance record for a specific model of stretch wrapper shows a recurring bearing failure every 18 months, the pillar's MP design review flags that component for upgraded specification in the next purchase. Commissioning checklists, spare part lists, and maintenance plans for new equipment are generated from the pillar's equipment class templates, reducing the commissioning-to-stable-production window.
Maintenance prevention feedback tracked per equipment model, with commissioning-to-stable-production cycle time per new line
6. Training and Education
Skill gap identification from equipment performance data
The training and education pillar develops the multi-skilled workforce required for autonomous maintenance and continuous improvement. In an AI-driven TPM framework, training needs are identified not from manager observation but from equipment performance patterns correlated to shift teams, operators, and skill certifications. When a specific shift team shows a higher rate of autonomous maintenance checklist failures on the labeler, or a longer mean time to resolve a filler jam, the pillar flags a skill gap recommendation for that team or operator. Training records are linked to equipment performance data, producing a measurable correlation between skill development investment and OEE improvement per line. The pillar maturity score includes the percentage of operators who have achieved the target skill matrix level for their assigned equipment.
Skill gap analysis generated from equipment performance data per shift team, with training-to-OEE impact correlation tracked
7. Safety, Health, Environment
Zero-accident condition monitoring integrated with line operations
The safety, health, and environment pillar extends zero-loss thinking to safety and environmental performance. In FMCG plants handling food products, cleaning chemicals, and high-speed packaging machinery, safety conditions are equipment conditions — a conveyor interlock that was bypassed to maintain throughput, a guard that was removed to clear a jam faster, a sanitary washdown nozzle positioned too close to electrical panels. The SHE pillar in iFactory's TPM module monitors safety device state per machine, tracks near-miss events reported through the maintenance and operator workflows, and correlates safety incidents with equipment condition data to identify the root cause pattern. Environmental metrics — energy consumption per unit produced, waste reduction per line, water usage per CIP cycle — are tracked alongside safety data, and the pillar maturity score reflects the trend of recordable incidents and environmental loss events.
Safety device compliance and near-miss rate tracked per line, with environmental KPIs linked to equipment operating state
8. TPM in Administration
Loss elimination applied to planning, scheduling, and supply chain processes
TPM in administration applies the zero-loss methodology to the support functions that enable production — maintenance planning, spare parts procurement, production scheduling, quality documentation, and compliance reporting. In an FMCG plant, administrative losses show up as maintenance work orders waiting three days for an approved part that is in stock, production schedules that do not account for the CIP cycle duration on specific product changeovers, and quality records that take four hours of manual data entry per shift to maintain. The administrative pillar tracks these loss types with the same rigour as equipment losses — work order cycle time by planner, spare parts availability by criticality class, schedule adherence by line, and quality documentation completion by shift. When a planner's work order backlog exceeds the target threshold, the pillar generates a process improvement kaizen.
Administrative loss types tracked per function — work order cycle time, schedule adherence, parts availability, documentation lag
Assess Your TPM Pillar Maturity
How Mature Are Your 8 TPM Pillars Today?
iFactory's TPM pillar maturity assessment maps each of the 8 pillars against the 6-step implementation progression — from reactive to world-class — using your equipment data, maintenance history, and quality records. The output is a pillar-by-pillar maturity score with specific recommendations for the highest-ROI pillar investments.
The TPM Pillar Maturity Model — From Reactive to World-Class in 6 Steps
Each TPM pillar matures through a standard 6-step progression that moves the organisation from reactive equipment management to a predictive, zero-loss operating state. In a traditional TPM program, this progression is measured through quarterly self-assessments and manual pillar board reviews. In an AI-driven TPM implementation, each step is measurable from equipment data, and the progression rate is visible per pillar, per line, per plant in real time.
TPM 6-Step Pillar Maturity Progression
Step
Name
What It Looks Like in an FMCG Plant
AI Analytics Accelerator
Step 1
Reactive
Maintenance responds to breakdowns. No structured autonomous maintenance. Operators run equipment, technicians fix it.
Equipment data ingestion and baseline OEE computation per line. First loss visibility for pillar teams.
Step 2
Condition-Based
Basic autonomous maintenance checklists introduced. Planned maintenance follows fixed intervals. Quality inspections are manual and scheduled.
Self-tuning condition windows replace fixed intervals. Cleaning and inspection triggers are generated from sensor state, not calendar.
Step 3
Predictive
Vibration, temperature, and current draw monitoring on critical packaging equipment. Maintenance intervals informed by trend data. Defect patterns tracked per station.
ML models predict failure windows 2-6 weeks ahead for robotic packaging components. Quality defect-to-condition correlation models surface the variable adjustments needed for zero-defect operation.
Step 4
Integrated
Pillar teams meet weekly with data from maintenance, production, and quality. Loss prioritisation is structured but manual. Kaizen themes selected from data.
All 8 pillars operate from a single analytics layer. Loss data is ranked and prioritised automatically. Kaizen cycle time and impact are tracked per event with financial ROI computed.
Step 5
Autonomous
Operators perform full autonomous maintenance scope. Equipment condition alerts are trusted and acted on first time. Planned maintenance windows optimised around production.
Autonomous maintenance completion reaches 95%+ per shift across all lines. Maintenance windows are self-optimised from production schedule, CIP plan, and predictive failure horizon. Pillar dashboards are operator-facing and real-time.
Step 6
World-Class
Zero unscheduled downtime per line for 6+ months. Zero defect escapes to the cold store or dispatch bay. Continuous improvement is cultural and data-driven.
OEE sustains 90%+ across all lines. Pillar maturity scores are world-class (5+) on all 8 pillars per annual audit. Equipment design feedback from pillar 5 drives MP improvements that are measurable as reduced maintenance cost per unit.
How AI-Driven TPM Reshapes Each FMCG Equipment Class
The impact of AI-driven TPM is not uniform across equipment classes. Each class has a dominant loss type and a specific pillar configuration that delivers the highest ROI. The iFactory TPM module applies class-specific pillar templates calibrated to the operating profile of filling systems, packaging machines, robotic cells, conveyors, and utility equipment — accelerating the maturity progression where it matters most for overall plant performance.
High-Speed Filling Lines
Filling lines are the bottleneck in most FMCG plants, and their dominant loss type is reduced speed caused by gradual component degradation — filler valve wear, capper chuck misalignment, conveyor guide rail drift. The autonomous maintenance pillar focuses on operator inspection of filler valves and capper chucks at shift start, with cleaning effectiveness tracked against downstream fill-weight variance. The quality maintenance pillar monitors fill weight per head, capper torque per chuck, and reject rate per lane, generating a zero-defect condition window for each station. The planned maintenance pillar schedules valve rebuilds and chuck replacements based on the trend of fill-weight standard deviation and capper torque drift rather than fixed cycle counts.
Speed loss reduction of 30-40% achieved through AI-driven autonomous maintenance triggers on filler and capper stations
Robotic Packaging Cells
Robotic palletizers, case packers, and cartoners are the equipment class where planned maintenance analytics delivers the highest ROI. The dominant loss types are unplanned stoppages from gripper pad wear, vacuum cup failure, servo drive faults, and end-of-arm tooling misalignment. The planned maintenance pillar in iFactory's TPM module monitors vibration, current draw, and cycle time trend per robot axis, predicting gripper pad replacement windows within 1-2 shifts of the optimal changeover point. The training and education pillar tracks operator proficiency in robotic cell intervention — mean time to clear a pick fault, mean time to adjust a gripper offset — and flags skill gaps for individual operators against target proficiency levels.
Unplanned robotic cell downtime reduced by 40-50% when planned maintenance is driven by axis-level predictive analytics
Conveyor and Material Handling
Conveyors are the most pervasive equipment class in FMCG plants and the most commonly excluded from TPM programs because they are perceived as low-complexity. However, conveyor-related losses account for 15-25% of all unplanned downtime in bottling and packaging plants — accumulated from hundreds of minor events that do not register as significant stoppages individually but collectively erode OEE by 5-8 points. The autonomous maintenance pillar tracks lubrication completion per conveyor section, belt tracking state per shift, and roller condition from current draw per drive zone. The focused improvement pillar targets the specific conveyor sections with the highest minor stoppage frequency, applying kaizen methodology to eliminate the root cause — typically a guide rail adjustment, sprocket wear, or belt tension setting that drifted over time.
Conveyor-related minor stoppage frequency reduced by 55-65% through AI-prioritised focused improvement kaizens
Our TPM program was stalled at step 3 for eighteen months. We had the pillar boards, the morning circles, the quarterly audits — but the OEE improvement flatlined because we were making equipment decisions on data that was three shifts old. After iFactory's TPM module connected our 8 pillars to real-time equipment analytics, the autonomous maintenance completion rate went from 72% to 94% in six weeks because operators saw the impact of their cleaning actions on the downstream defect rate immediately. The planned maintenance pillar identified a recurring bearing failure pattern on our case packer robots that had been driving unplanned downtime for two years — the replacement interval was wrong for the actual load cycle. We have sustained 88% OEE across all five packaging lines for four consecutive months.
— Plant Director, Dairy and Beverage Packaging Facility, 1.2M units per day
The TPM Module Integration Architecture — How the 8 Pillars Connect to Your Plant Infrastructure
The iFactory TPM module is not a standalone application. It is an analytics and workflow layer that connects to your existing plant infrastructure — PLC and SCADA systems for equipment data, the maintenance CMMS for work order and asset data, the quality LIMS for defect and inspection data, and the production scheduling system for shift and line planning — and produces the 8 pillar dashboards, maturity scores, and workflow triggers from the intersection of those data sources.
Week 1-2
Data Integration and Baseline
Read-only connections to PLCs, SCADA, CMMS, LIMS, and production scheduler. Baseline OEE and pillar maturity computed per line from available data.
Week 2-4
Pillar Dashboard Configuration
All 8 pillar dashboards configured per line. Loss taxonomy mapped to equipment classes. Autonomous maintenance checklists and triggers calibrated.
Week 4-6
Pillar Team Enablement
Operator and technician training on pillar dashboards and analytics-driven workflows. Shadow mode operation with existing TPM processes.
Week 6-8
Live TPM Analytics Operation
Full TPM analytics live across all pillars. Pillar maturity scores updating in real time. Kaizen cycle tracking and loss prioritisation active.
Conclusion: The TPM Model That Runs at the Speed of the Line
Total Productive Maintenance has been the gold standard for equipment effectiveness in manufacturing for fifty years. The 8 pillars are as relevant today as they were when they were first codified — autonomous maintenance, planned maintenance, quality maintenance, focused improvement, early equipment management, training and education, safety health environment, and TPM in administration. What has changed is the speed at which an FMCG plant must operate these pillars to remain competitive. A pillar team that meets weekly to review data from the previous three shifts is not practising TPM at line speed. It is practising root cause analysis after the loss has already compounded across 60,000 units.
AI-driven TPM does not replace the 8 pillars. It replaces the latency, the manual data collection, the calendar-based triggers, and the quarterly maturity assessments that prevent the pillars from operating at the speed of production. Every pillar gets real-time data from the same equipment analytics layer. Autonomous maintenance triggers fire when the residue sensor threshold is crossed, not when the shift-end checklist is reviewed. Planned maintenance windows optimise around the production schedule, the CIP plan, and the predictive failure horizon simultaneously. Quality maintenance detects the off-spec condition before the defective unit is produced. Focused improvement kaizens are selected from a ranked list of loss impact, not from what the team remembers from last month.
The FMCG plants that sustain 85%+ OEE across all lines are not the ones with the newest equipment or the largest maintenance budgets. They are the ones whose TPM program operates at the same cadence as their production lines — and that cadence is measured in minutes, not shifts. The 8 pillars have not changed. The infrastructure to run them at line speed is available now. Book a Demo to see iFactory's TPM module configured for your equipment classes and line configuration.
Frequently Asked Questions
Traditional TPM relies on manual data collection, paper-based pillar boards, fixed-interval maintenance schedules, and weekly or monthly team meetings to review performance. The 8 pillars are structurally sound but operate at a cadence that is too slow for high-speed FMCG lines running 24/7 with 15-minute changeover windows. AI-driven TPM keeps the same 8-pillar framework but replaces manual triggers with real-time equipment data. Autonomous maintenance tasks are generated by sensor state rather than calendar. Planned maintenance intervals are optimised by vibration, temperature, and current draw trends rather than fixed schedules. Quality maintenance detects off-spec conditions from process variable drift before a defective unit is produced. Pillar maturity is measured continuously from equipment data rather than assessed quarterly. The framework is identical — the speed of execution is fundamentally different.
The iFactory TPM module operates at maximum effectiveness when connected to existing PLC, SCADA, and CMMS data sources through read-only interfaces — no modifications to control systems or databases are required. For plants with limited sensor infrastructure, the module can begin operating on manual data entry through the maintenance and operator workflows, providing immediate pillar visibility and maturity tracking from the data that is already being collected. As additional sensor data becomes available — through equipment upgrades, IoT gateway installations, or iFactory's AI Vision Camera integration — the pillar analytics refine automatically, transitioning from manual to condition-based to predictive without requiring any module reconfiguration.
A typical FMCG plant deployment takes 6 to 8 weeks from data integration to live TPM analytics across all 8 pillars. The first two weeks focus on read-only connections to existing PLC, SCADA, CMMS, and LIMS systems, establishing the baseline OEE and pillar maturity scores per line. Weeks 2 through 4 configure the 8 pillar dashboards, loss taxonomy, and autonomous maintenance trigger rules. Weeks 4 through 6 cover team enablement and shadow-mode operation alongside existing TPM processes. By week 8, the full TPM analytics layer is live, pillar maturity scores update in real time, and the kaizen cycle tracking and loss prioritisation workflows are operational. For multi-line or multi-plant deployments, the second site typically deploys in 4 to 5 weeks using the configuration templates established at the first site.
In iFactory's TPM module, each pillar is scored on a 1-to-5 maturity scale across five dimensions: process adherence, data quality, loss reduction, team capability, and autonomous operation. Autonomous maintenance maturity is computed from checklist completion rate, cleaning effectiveness (measured by downstream defect rate), and the percentage of autonomous maintenance tasks triggered by condition rather than calendar. Planned maintenance maturity reflects schedule adherence, predictive model coverage, and the ratio of condition-based to calendar-based work orders. Quality maintenance maturity is derived from zero-defect condition window compliance, defect-to-condition correlation completeness, and the trend of off-spec events per station. The scores are updated continuously from equipment data, and the pillar dashboard shows the current maturity level per pillar per line, the trend over the trailing 4 weeks, and the specific gaps that must close to reach the next maturity step.
iFactory's TPM module is designed to integrate with existing TPM programs rather than replace them. If your plant already has active pillar teams, pillar boards, and TPM processes, the module overlays an analytics layer that provides real-time data to those existing structures. The pillar dashboards are configurable to match your existing pillar naming conventions, loss taxonomy, and reporting cadence. The transition can be phased — begin with autonomous maintenance and planned maintenance analytics in the first deployment wave, add quality maintenance and focused improvement in the second wave, and extend to the remaining pillars as the teams adopt the analytics-driven workflow. The module supports both centralised TPM program management (for multi-plant deployments) and line-level pillar autonomy (for plants where each line operates its own TPM program).
The OEE improvement trajectory follows a characteristic curve. In the first 2 to 4 weeks after live deployment, the most visible change is the reduction in minor stoppages as autonomous maintenance triggers eliminate the most common residue-related and misalignment-related speed losses — typically a 15-20% reduction in total downtime events. By weeks 4 through 8, the planned maintenance pillar's predictive analytics begin reducing unplanned downtime on robotic packaging cells and critical filling equipment, contributing another 10-15% OEE improvement. By the third month, the quality maintenance pillar's zero-defect condition windows and the focused improvement pillar's data-prioritised kaizen cycle combine to add 5-8% OEE improvement. FMCG plants typically reach and sustain 85-92% OEE within 4 to 6 months of deployment, with the rate of improvement determined by the starting maturity level of each pillar and the availability of equipment data for the predictive models. Book a Demo to see a modelled OEE trajectory built from your line configuration and current OEE data.
See What AI-Driven TPM Would Do to Your FMCG Plant's OEE Number
iFactory's free TPM pillar maturity assessment maps each of the 8 pillars against your current equipment data, maintenance processes, and quality records — producing a pillar-by-pillar maturity score with specific recommendations for the highest-ROI pillar investments. Built from your own data and delivered without obligation.