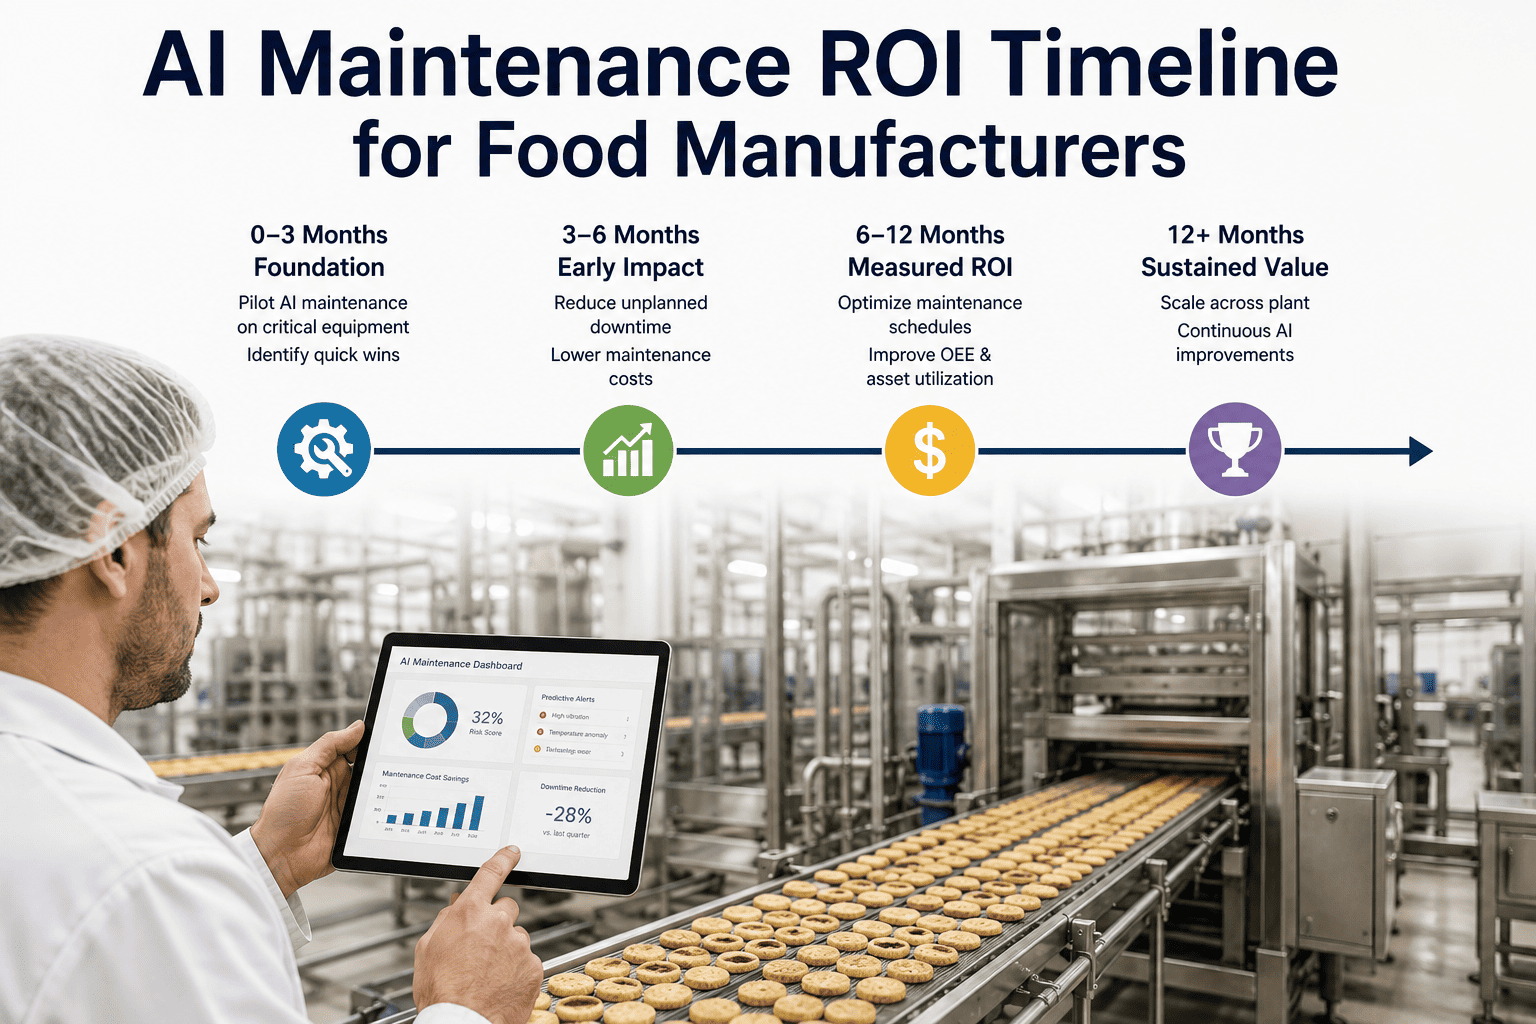
Every plant manager who has sat through an AI maintenance pitch has heard some version of "it pays for itself." What they rarely get is a straight answer about when, which is understandable, because the honest answer is that the value curve isn't flat — it dips before it climbs, and knowing the shape of that curve matters more for budgeting purposes than any single ROI percentage quoted at the end of a sales call. A realistic timeline shows setup cost in the first months, a slow climb as the model learns your specific equipment, and a steeper payoff once predictive alerts start catching failures before they become downtime. iFactory's team builds this timeline against your actual plant data rather than an industry average.
See the Real Value Curve Before You Commit Budget to a Pilot
A month-by-month view of setup cost, learning period, and payoff for AI-driven predictive maintenance across a typical F&B plant, so the investment case is grounded in a realistic timeline rather than a single optimistic number.
Why the First Few Months Look Like a Cost, Not a Win
Predictive maintenance models need a training period before they're accurate, and that period costs money before it returns any. Sensors and edge gateways have to be installed, historical failure data has to be cleaned and connected, and the model needs several weeks of live data to learn what a normal versus abnormal pattern looks like on your specific equipment. Plants that expect a return in the first month are almost always disappointed, not because the technology failed but because the timeline was never realistic to begin with.
Breaking Down the Three Phases
The curve above compresses a lot of activity into three visible phases, each with a distinct cost and value profile worth understanding on its own terms before committing to a plant-wide rollout.
Get a Value Curve Built Around Your Plant's Asset List
Send us your critical asset list and recent downtime history, and we'll build a realistic month-by-month ROI projection instead of a generic industry estimate.
What Actually Drives the Cost Side of the Curve
The setup cost isn't just hardware. It includes the time your maintenance and IT teams spend connecting systems, the historical data cleanup needed to give the model something reliable to learn from, and the change management required to get technicians to trust and act on an alert coming from software rather than from experience. Underestimating any of these three tends to be the real reason a projected timeline slips, more often than any technical limitation in the AI model itself.
| Cost Category | Typical Share of Setup | Main Driver |
|---|---|---|
| Sensors and edge hardware | Moderate | Number of assets and existing instrumentation gaps |
| Data integration and cleanup | Significant | Historian and CMMS data quality and completeness |
| Model training and tuning | Moderate | Volume of historical failure data available |
| Change management and training | Often underestimated | How readily technicians adopt AI-driven alerts |
What the Payoff Side Actually Looks Like
Once the model is trained, the value shows up in fairly specific, trackable places: fewer unplanned stops because a bearing or motor issue was caught during a scheduled window instead of mid-shift, less overtime spent on emergency repairs, and better parts inventory planning because failures are anticipated rather than discovered. None of these show up as a single lump-sum return, which is part of why plants that expect one big number tend to be less satisfied than plants that track the specific categories where the savings actually land.
Mistakes That Distort the Timeline
The most common mistake is rolling out to every line simultaneously to accelerate the payoff, which instead spreads the setup cost and data cleanup burden across more assets at once and delays the point where any single line reaches a trained, reliable model. A phased rollout starting with one or two well-instrumented lines almost always reaches breakeven faster than a simultaneous plant-wide deployment. A second mistake is measuring ROI purely on avoided downtime while ignoring the labor efficiency and inventory planning gains that typically make up a meaningful share of the total return.
Frequently Asked Questions
Get an ROI Timeline Built Around Your Own Plant, Not an Industry Average
Bring your asset list and recent downtime history to the call, and we'll walk through a realistic month-by-month projection together.