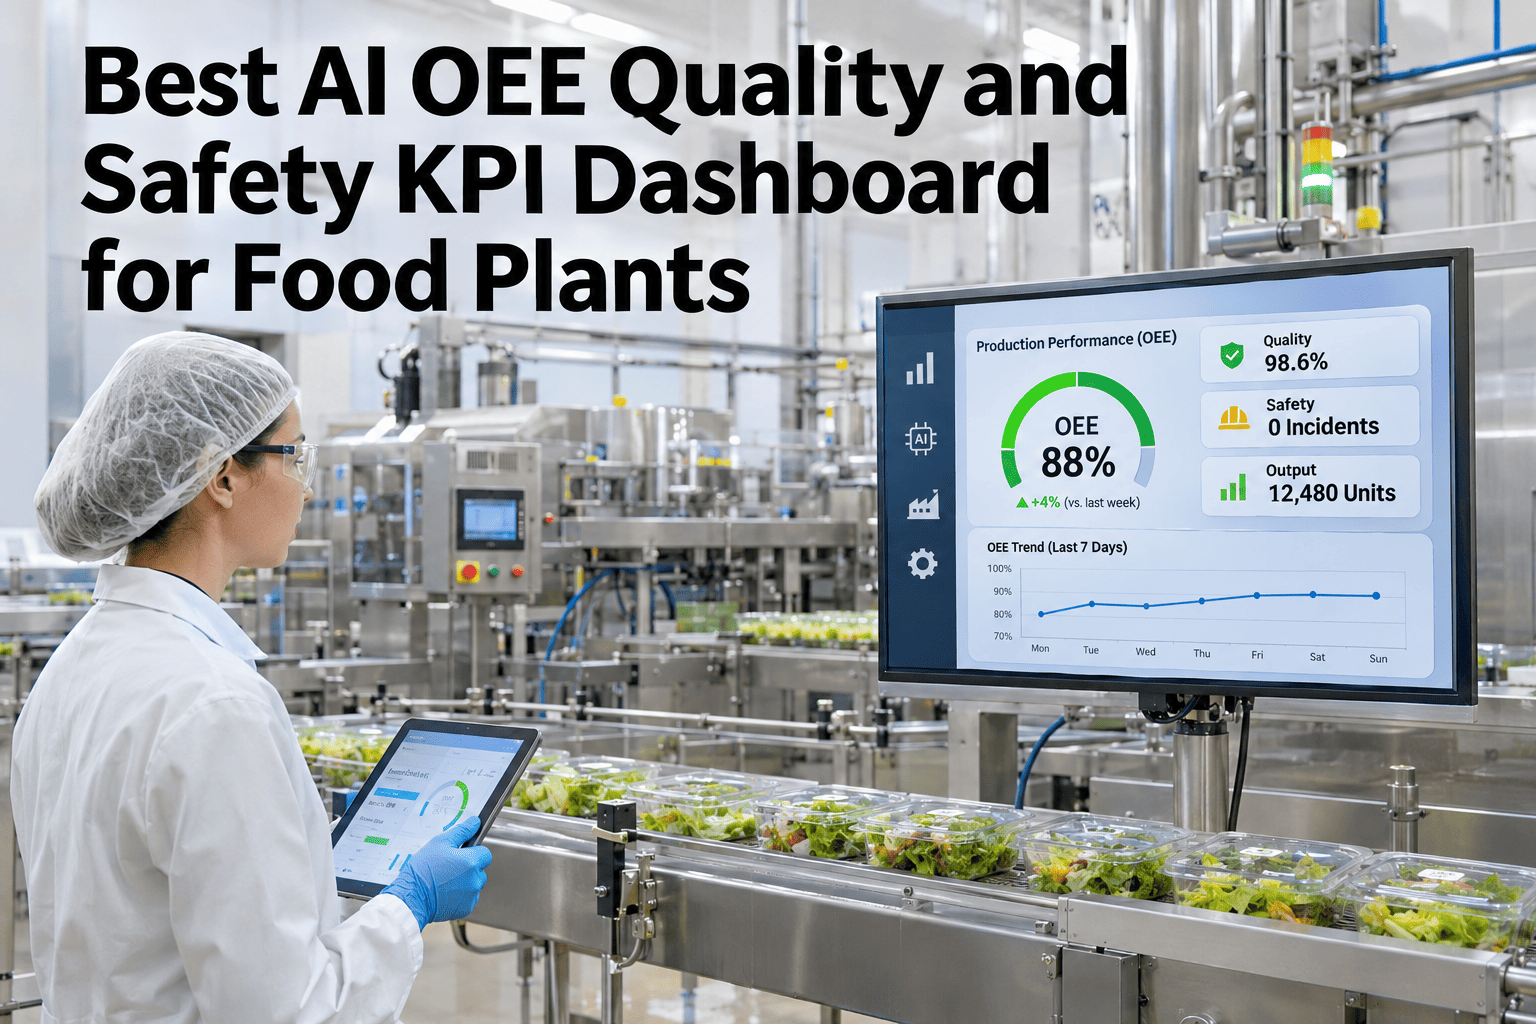
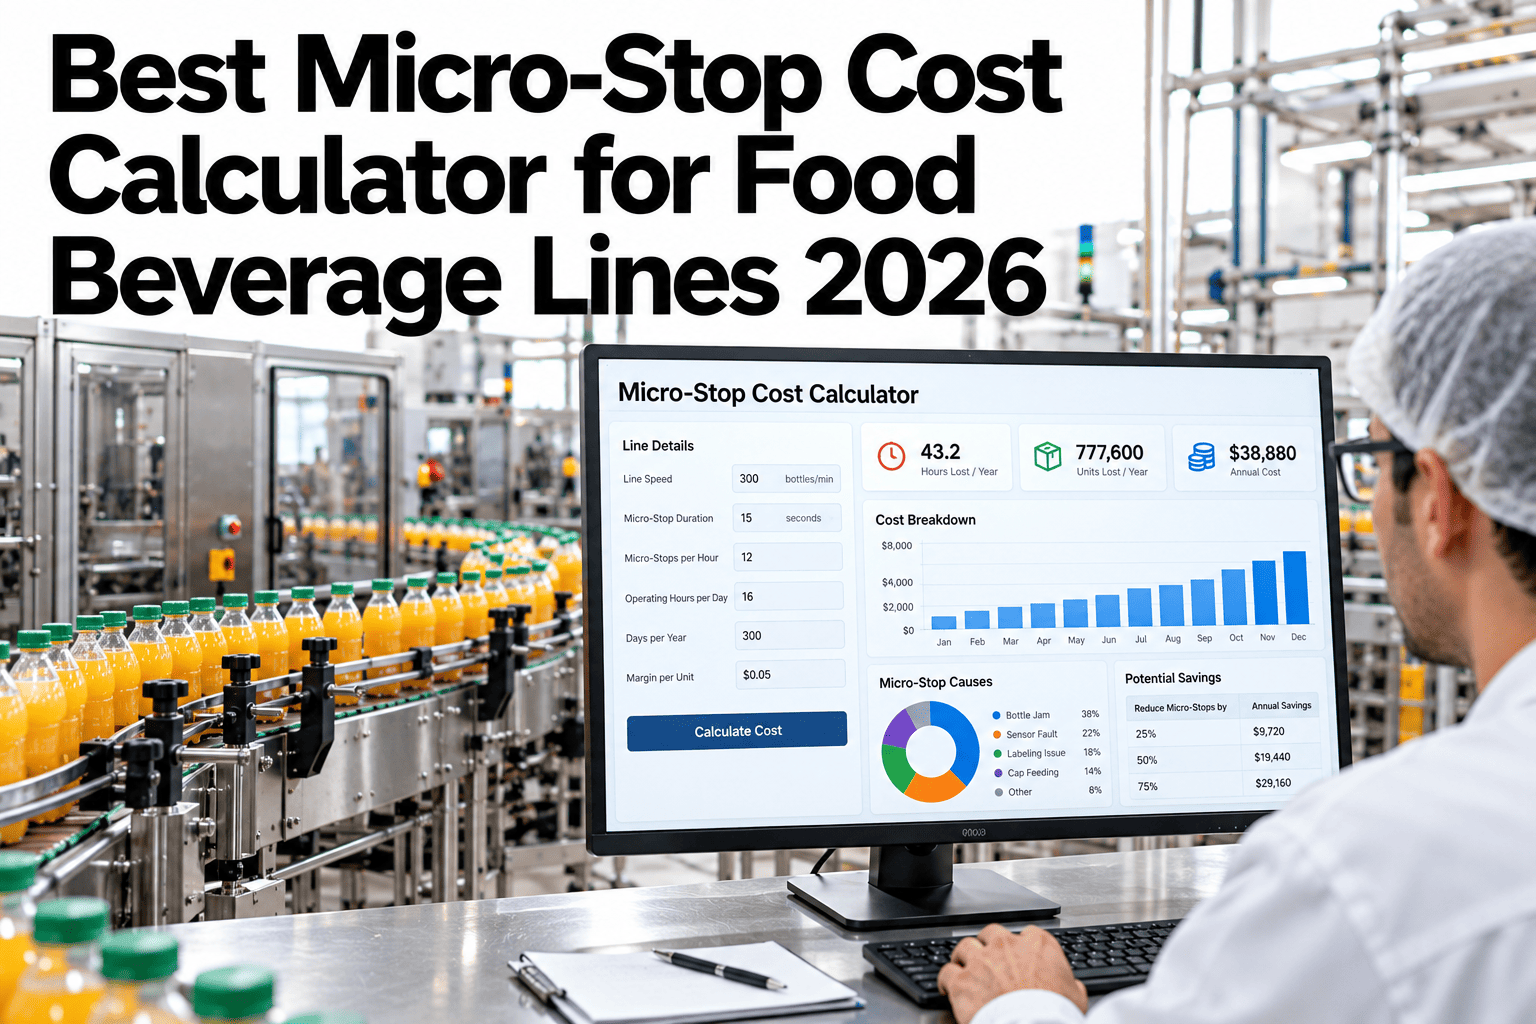
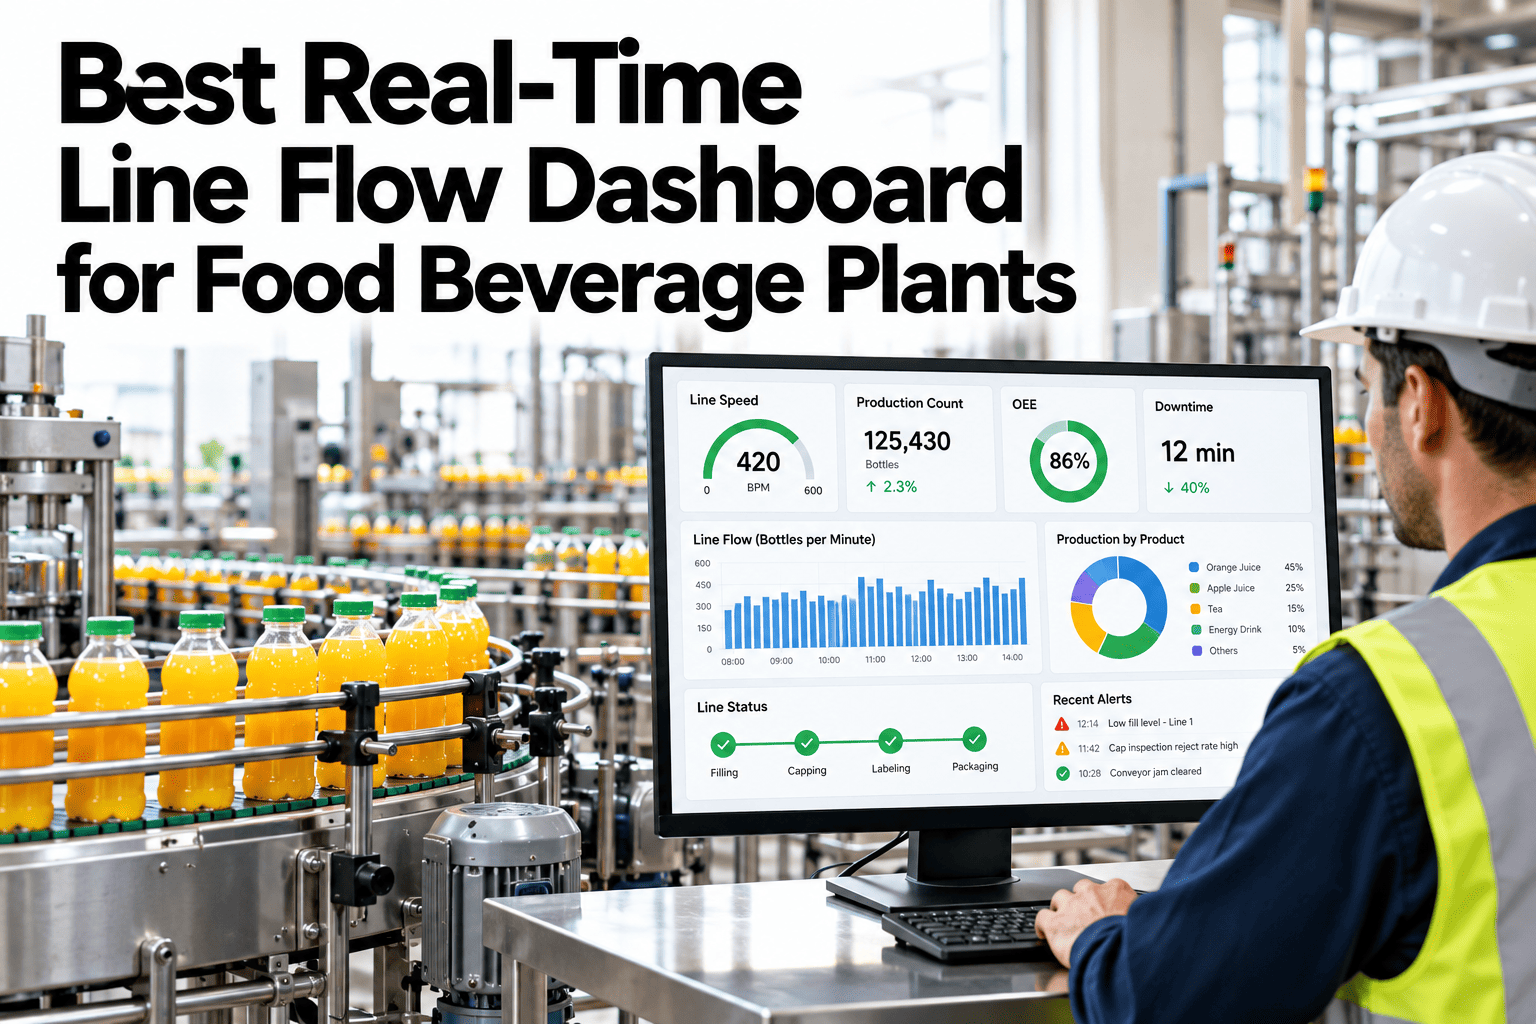
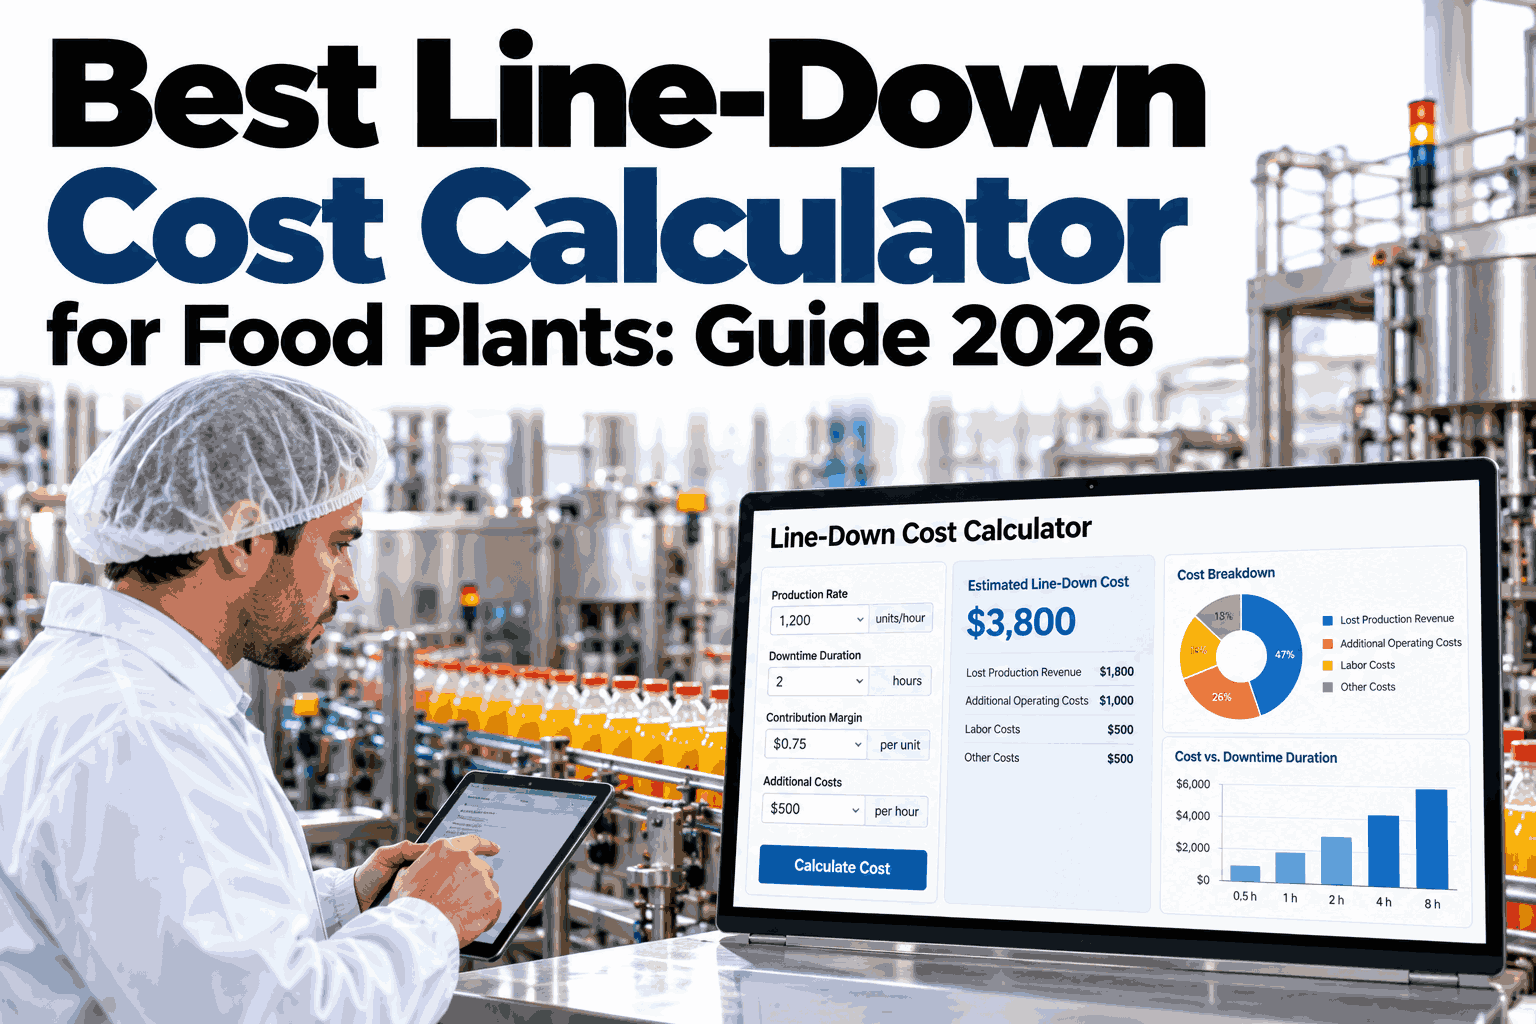
Put six plant directors in a room and ask them to rank their sites by performance, and you will get six different answers — not because anyone is wrong, but because each site's "OEE," "quality rate" and "safety score" were built independently, by different teams, on different assumptions, years apart. A multi-site food manufacturer cannot benchmark what it cannot define consistently. A unified AI OEE, quality and safety KPI dashboard fixes the definition problem first, then the comparison problem follows naturally. You can see this framework applied to your own sites on a short call.
Multi-Site Food Plant KPIs — 2027
Six Sites, Six Scorecards, One Honest Comparison
iFactory, an on-premise AI platform for manufacturing execution (MES) and OEE analytics, unifies OEE, quality and safety KPIs under one framework so cross-site benchmarking becomes possible for the first time.
What it is
What Is a Unified OEE, Quality and Safety KPI Dashboard?
A unified KPI dashboard is a single framework that defines OEE, quality and safety the same way across every site, line and shift, so a number from Plant A means exactly the same thing as that number from Plant B. Without a shared definition, two valid-looking OEE figures can simply not be compared.
Fragmented systems are the root cause. Each plant adopted its own tools over time — a spreadsheet here, a legacy SCADA report there — and the definitions drifted apart with them, until someone tries to benchmark sites and the numbers do not line up.
Three pillars, one scorecard
What Belongs in a Unified Scorecard
OEE
AvailabilityPerformanceQuality rate
Quality
Reject rateCAPA closure timeHold frequency
Safety
Recordable incident rateNear-miss reportsTraining compliance
The gap
Why Fragmented Systems Break Cross-Site Comparison
Different definitions
Each site's OEE formula may handle planned downtime or changeovers differently.
Different systems
Spreadsheets at one site, legacy SCADA reports at another, nothing shared.
Different update cadence
One site updates daily, another weekly, so the snapshot never aligns.
No shared owner
Nobody is accountable for keeping definitions consistent across the network.
Sourced data
A Realistic External Benchmark for the Network
58%
Food & beverage median OEE, direct-sensor measured (TeepTrak, 2026)
82%
World-class top-decile OEE for food & beverage lines (TeepTrak, 2026)
40-70%
Typical reduction in recurring non-conformities from structured RCA and CAPA discipline (industry CAPA analysis, 2026)
The build
Five Steps to a Shared KPI Framework Across Sites
1
Agree one OEE formula — what counts as planned downtime, what counts as a changeover — and apply it everywhere.
2
Standardize quality metrics so a reject, a hold and a CAPA mean the same thing at every site.
3
Align safety reporting, including near-miss capture, so leading indicators are comparable, not just lagging incident counts.
4
Pull all three into one dashboard, updated on the same schedule, visible to every plant director in the network.
5
Review the ranking monthly, not to punish the lowest site, but to find what the top site is doing differently.
Comparison
Site-by-Site Reporting vs a Unified Framework
| Dimension | Site-by-Site Reporting | Unified Framework |
|---|
| OEE formula | Varies by site | One definition, applied everywhere |
| Quality metrics | Different terms per site | Shared reject, hold and CAPA definitions |
| Safety reporting | Lagging incident counts only | Leading and lagging indicators aligned |
| Benchmarking | Not meaningfully possible | Direct comparison across sites |
Expert review
What an Operations Director Would Check First
Holds up
Standardizing KPI definitions before comparing sites is basic measurement discipline, not a new idea — the gap is usually execution, not theory.
Watch for
A dashboard that looks unified on the surface but still pulls from each site's locally defined OEE calculation underneath.
Do next
Start by reconciling just the OEE formula across two sites before adding quality and safety, so the team builds trust in the comparison one layer at a time.
FAQ
What Plant Directors Ask About Unified KPI Dashboards
Why can't we compare OEE across our sites today?
Each site likely calculates OEE slightly differently — how planned downtime, changeovers or micro-stops are counted varies — so a higher number at one site may not reflect better performance, just a looser definition.
Review your current formulas with our team to find the gaps.
What should be in a unified safety KPI alongside OEE and quality?
Include both lagging indicators like recordable incident rate and leading indicators like near-miss reporting frequency, since leading indicators give a plant director earlier warning than incident counts alone.
Ask about safety KPI structure for your sites.
How long does it take to align KPI definitions across a multi-site network?
It depends on how many systems are currently in use and how different the formulas are today; a two or three-site pilot can establish a working shared framework before rolling it out network-wide.
Discuss a pilot timeline for your network.
Does a unified dashboard replace each site's existing reporting?
Not necessarily immediately — many plants run the unified dashboard alongside local reporting during a transition period, then retire the local reports once the team trusts the shared numbers.
What is a realistic OEE benchmark to measure sites against?
Food and beverage median OEE is 58% and world-class top-decile is 82%, based on direct-sensor measurement across 450 plants (TeepTrak, 2026). Use this as an external reference point, not just internal site-to-site comparison.
Compare your network against this benchmark with our team.