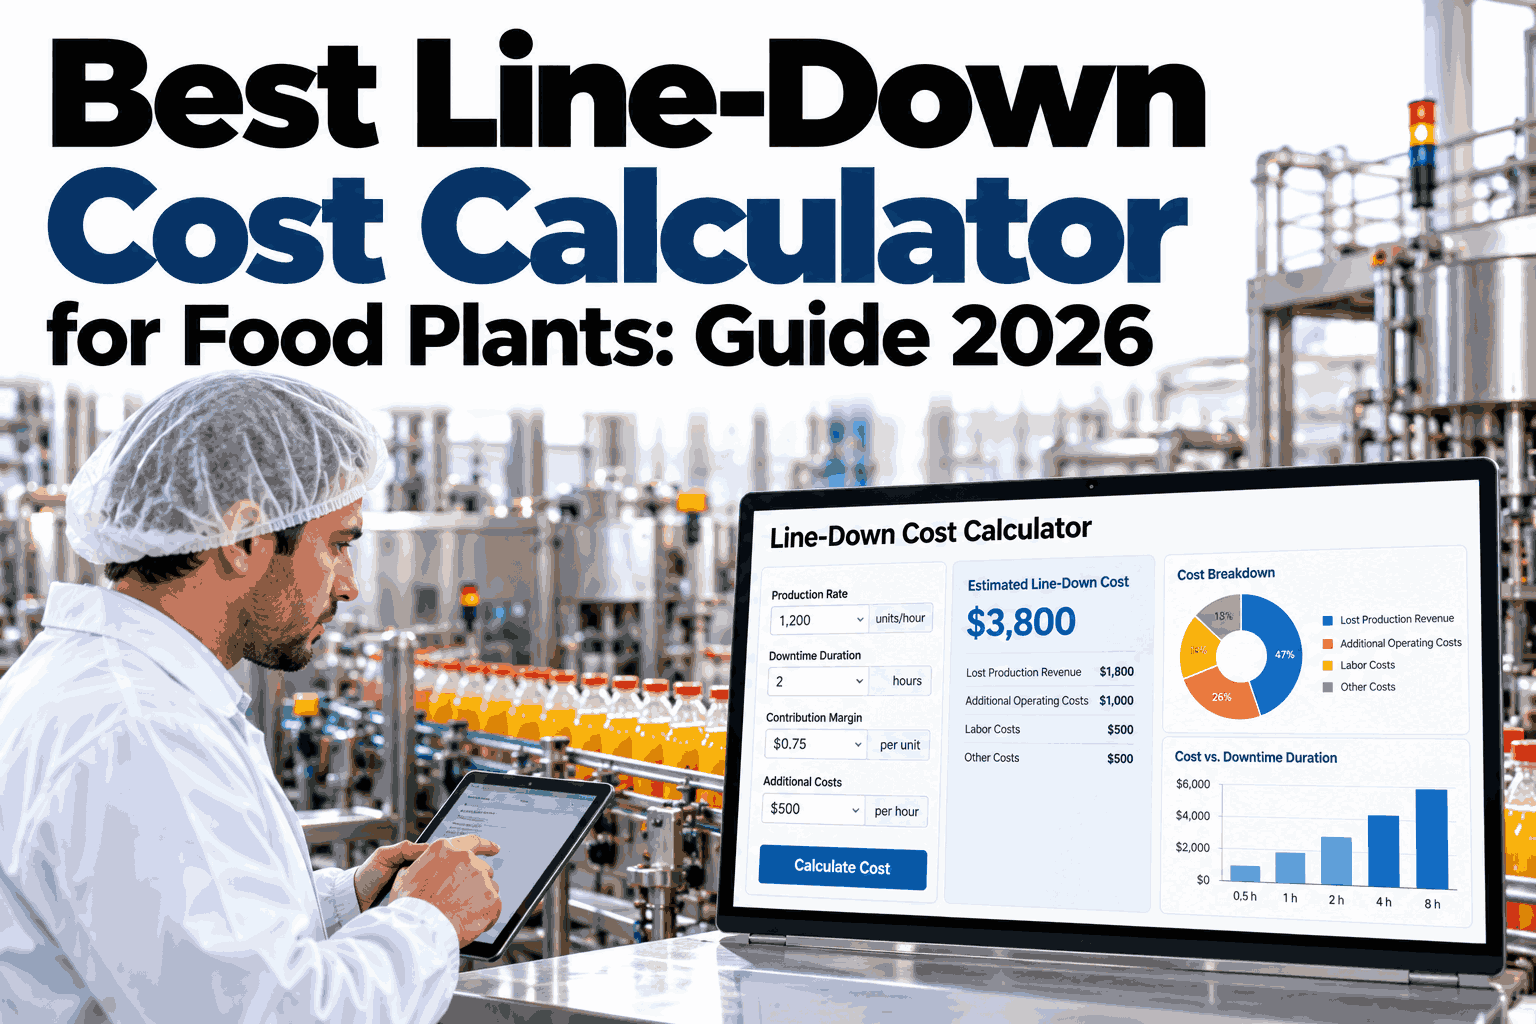
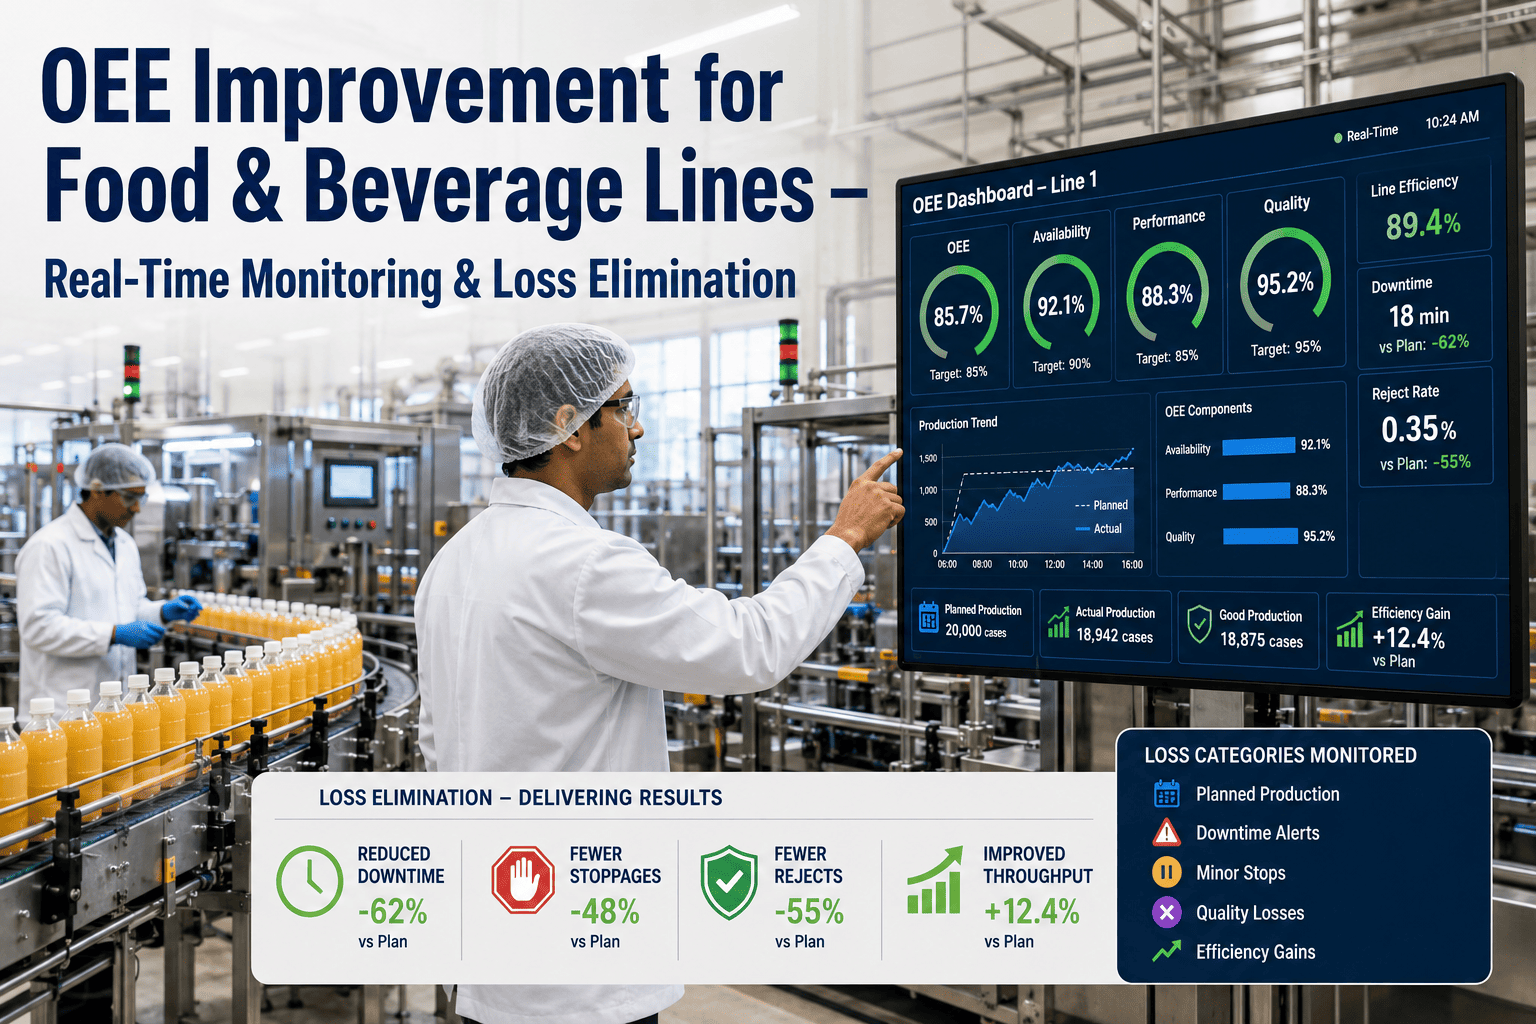
A filler that stops for twenty seconds, sixty times a shift, rarely makes it onto a loss report, yet the time adds up to hours every week. Each short stop also brings a slow restart, a few rejected packs and an operator pulled away from other work. A micro-stop cost calculator turns that hidden loss into an annual figure that finance can read and trust. This guide shows the formula, the inputs and how to present the result. To run the numbers on your own line, you can walk through a micro-stop cost model with our team.
Micro-stop and changeover losses
Turn Short Filler Stops Into an Annual Cost Your CFO Will Respect
iFactory AI counts every short stop automatically, measures its real cost including recovery and builds the number finance needs to approve action.
Illustrative annual cost by stops per shift
The hidden lossShort Stops Hide Between the Cracks of Normal Reporting
Most stop reports ignore anything under a few minutes, so a whole category of loss never gets a name.
Counted late
Operators rarely log stops under a minute
Hidden in speed loss
Stops show up as slow running
Restart cost
Each stop brings ramp-up and rejects
Operator time
People are pulled away to clear each one
Automatic counting from machine signals fixes the first two problems, and a good cost model captures the other two.
The formulaFour Inputs Produce the Annual Number
The calculation is simple. The hard part is getting honest inputs.
Annual cost = stops per shift x time lost per stop x shifts per year x cost per line hour
Time lost per stop should include the stop itself and the recovery, such as slow running and rejects, until the line is back at normal rate.
Use margin lost per line hour, not full sales value. Finance teams trust numbers that are conservative.
A worked exampleSixty Short Stops per Shift on a Filler Line
All numbers are illustrative. Replace them with your own.
60 s
Lost per stop including recovery
600 h
Lost per year across 600 shifts
900,000
Annual cost at 1,500 per line hour
60 stops x 60 s = 60 min per shift. 60 min x 600 shifts = 600 h. 600 h x 1,500 = 900,000
Put a Number on Your Line's Short Stops
Share a week of stop data and see how iFactory AI would calculate your annual micro-stop cost with recovery time included.
Where the inputs come fromSource Each Input and Know Its Weakness
| Input | Best source | Watch out for |
|---|
| Stops per shift | Automatic machine signals | Manual logs miss short stops |
| Time per stop | Timestamps of stop and restart | Include recovery, not just the stop |
| Shifts per year | Production calendar | Count only shifts the line really runs |
| Cost per line hour | Finance contribution margin | Do not use full revenue |
| Reject cost | Reject counts after restarts | Link rejects to stops where possible |
Frequency and durationWhich Stops Deserve Attention First?
Plot stops by how often they happen and how long they last.
Stop pattern
Short
Longer
Frequent
Fix the cause
Chronic small stops with the biggest total cost
Prepare for it
Rare, longer events need planned responses
Occasional
Standardise the clear
Quick resets can be made faster and simpler
Monitor
Low impact, watch for change
The top left is where micro-stop work usually pays back first.
What reduction is worthHow the Annual Cost Falls as Stops Fall
Show leaders what different reduction levels would mean. This table continues the illustrative example.
| Stop reduction | Hours saved | Annual value |
|---|
| 25% | 150 h | 225,000 |
| 40% | 240 h | 360,000 |
| 50% | 300 h | 450,000 |
Some plants report stop reductions of this order after tuning, but results vary. Treat the table as scenarios, not forecasts.
Before and afterWhat Success Looks Like on One Line
Track the same measures before and after changes. This view is illustrative.
Presenting to financeFive Habits That Make the Number Credible
1
Show the method
Display the formula and every input on one page.
2
Use conservative inputs
Margin, not revenue, and measured stops, not estimates.
3
Give a range
Low, base and high cases beat a single figure.
4
Show the evidence
Include a week of stop timestamps.
5
Agree the target
Pick a reduction goal and a date with the line owner.
Finance teams respond to clear logic. To build a one-page summary, ask our team for a micro-stop business case template.
RolloutThree Phases From First Count to Standard Practice
Phase 1
Capture stops automatically on one line for two to four weeks.
Phase 2
Calculate the cost, rank stop causes and fix the top three.
Phase 3
Track results monthly and extend to other lines.
Automatic stop capture in place
Stops include recovery time
Cost per line hour agreed with finance
Top three causes identified
Reduction target set with a date
Monthly review scheduled
Results shared with operators
Owner named for each cause
Expert reviewWhat an Operations Finance Partner Would Check First
Expert review
A micro-stop number lands when it is conservative, measured and agreed in advance. If finance helped choose the inputs, they will defend the result.
VerdictStrong when stops are counted automatically and cost uses margin.
Watch forEstimates built from operator memory and full revenue values.
Do nextCount one line for a month and walk finance through the result.
Frequently asked questionsWhat Plant Leaders Ask About Micro-Stop Costing
What counts as a micro-stop?
Definitions vary, but micro-stops are generally short stops that operators clear quickly, often under a few minutes. Choose a threshold that suits your line, and keep it consistent so trends are meaningful. The title of this guide focuses on stops under thirty seconds.
Set a threshold with our team.
Why include recovery time in the cost?
After most stops the line does not return to full speed immediately. Slow running, rejects and re-adjustments add to the loss, and ignoring them understates the cost. Measure the time until stable rate returns.
Ask about recovery measurement.
Which cost per hour should we use?
Use the contribution margin lost per line hour, which finance can confirm. Full sales value overstates the loss because materials and variable costs are saved when the line stops. Conservative inputs build trust.
Discuss cost inputs.
How accurate is automatic counting?
It is usually much more complete than manual logs, because it captures every stop from machine signals. Check the results against a short observation period to confirm the thresholds are right.
Ask about validation.
What reduction can we expect?
It depends on the causes. Some plants report reductions of the order of forty percent after tuning machines and fixing the top causes, but yours may differ. Start with a baseline and review progress monthly.
Plan a baseline.
Hidden loss, visible number
Know What Your Short Stops Really Cost
Book a session with iFactory AI to count your micro-stops, price them with recovery included and prepare a business case finance will back.