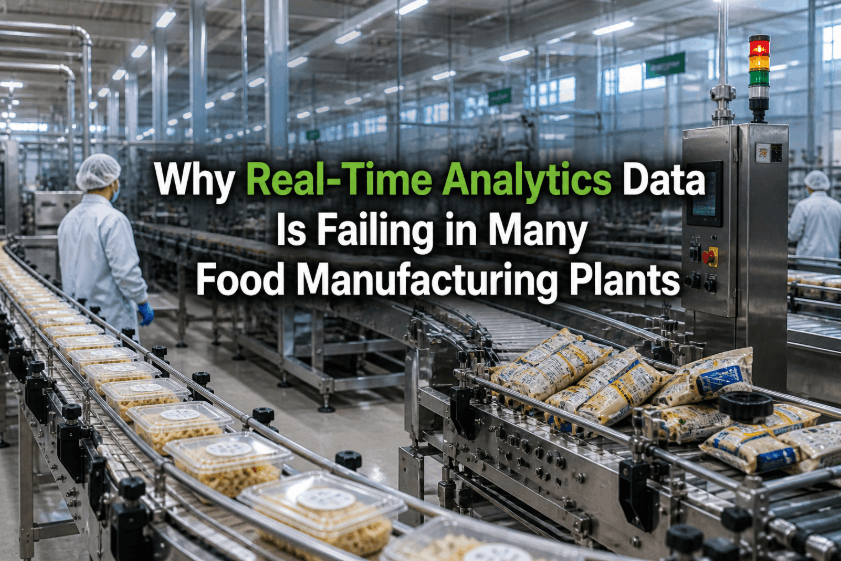
Most food and beverage plants running in the mid-60s on OEE assume that is just what their equipment and product mix allows, when in reality a large share of that gap comes from losses that are entirely visible once you start measuring them properly. World-class OEE performance sits above 85%, and the difference between a plant stuck at 65% and one pushing toward that number is rarely a single big fix, it is systematically eliminating the six categories of loss that quietly eat into availability, performance, and quality every single shift. Plant managers ready to see where their own line is losing OEE can book a demo.
OEE IMPROVEMENT · FOOD & BEVERAGE LINES · 2026
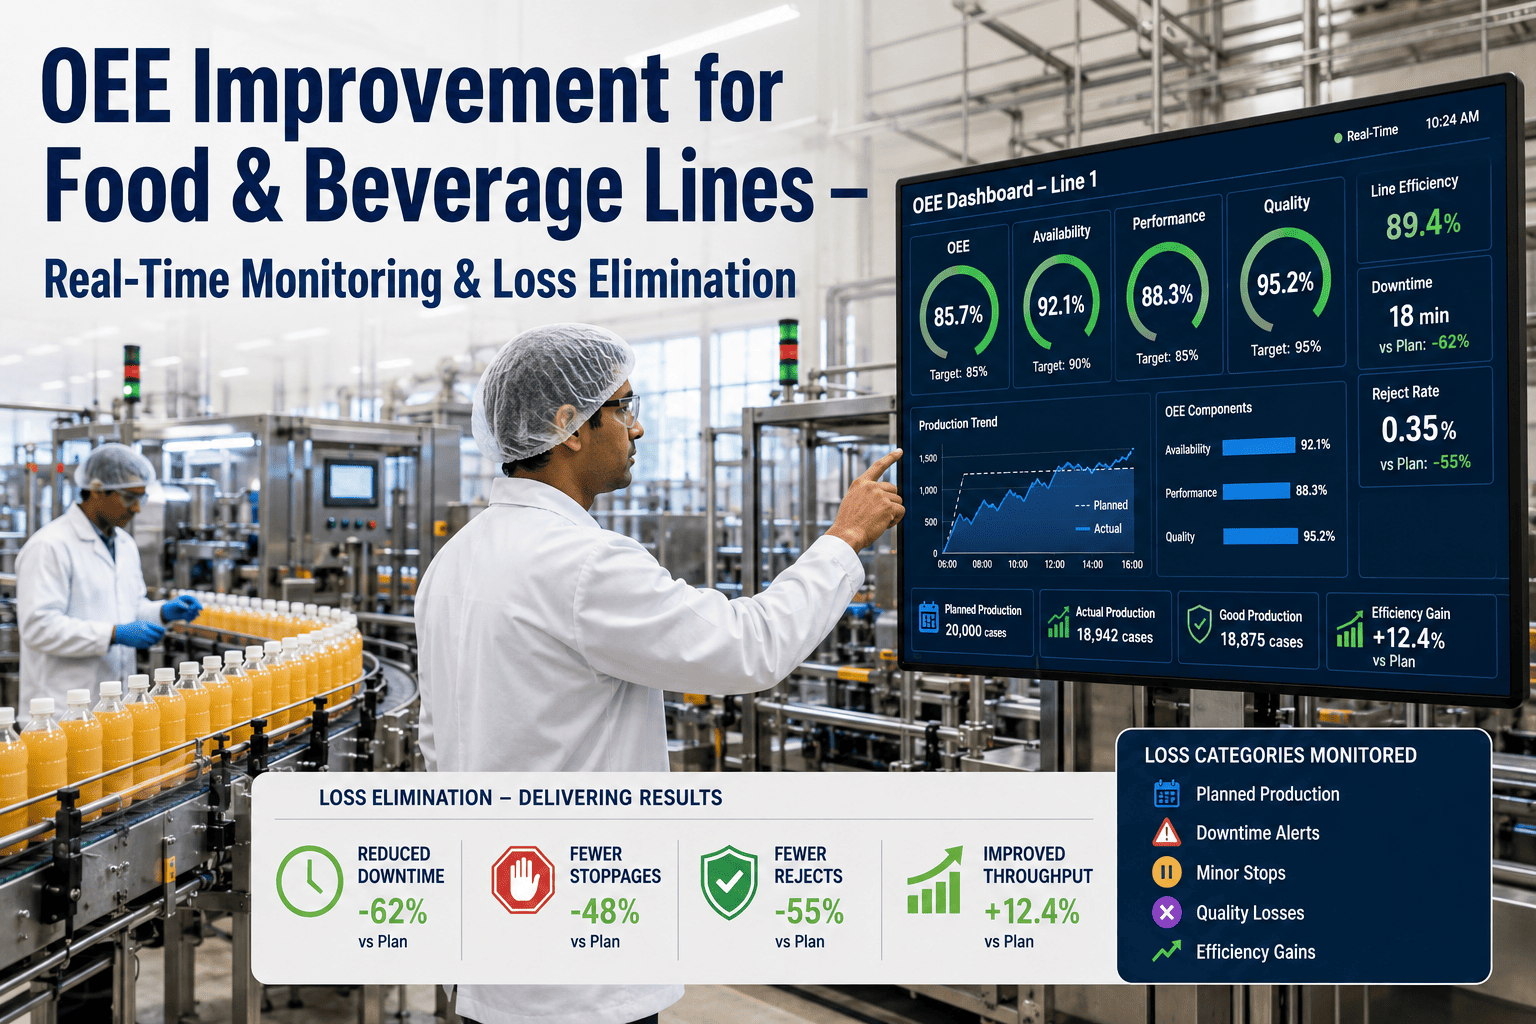
Find the Gap Between 65% and World Class
Real-time OEE monitoring with automated Six Big Losses categorization, so your team fixes the loss that actually matters most this week.
Why Most Plants Underestimate Their Own Losses
Ask a plant manager where their OEE loss is coming from and you will usually get a confident answer about changeovers or minor stops. Ask for the data behind that answer and the confidence often drops, because most plants are still calculating OEE from end-of-shift summaries rather than continuous, machine-level data. That gap between intuition and measurement matters, because the categories of loss that feel biggest, like a major breakdown, are often not the categories costing the most OEE over a month. Small stops and speed losses, the kind that never make it into a shift report because no single instance seems worth logging, frequently add up to more lost production than the dramatic failures everyone remembers.
The Six Big Losses, Measured Automatically
AVAILABILITY LOSS
Breakdowns
Unplanned equipment failure stopping the line entirely.
AVAILABILITY LOSS
Setup & Changeover
Time lost switching between products or SKUs.
PERFORMANCE LOSS
Minor Stops
Brief, frequent stoppages rarely logged individually.
PERFORMANCE LOSS
Reduced Speed
Running below designed line speed for extended periods.
QUALITY LOSS
Startup Rejects
Defects produced during line startup before stabilizing.
QUALITY LOSS
Production Rejects
Defects produced during steady-state running conditions.
FIND YOUR BIGGEST LOSS CATEGORY
See Your Own Six Big Losses Breakdown
Get a walkthrough of where your specific line is actually losing OEE, backed by real machine data.
From Root Cause to Resolved, Automatically
Identifying a loss category is only half the value. AI-driven OEE platforms go further, tying each downtime and speed loss event to a likely root cause based on the specific conditions present when it occurred.
| Loss Category | Common Root Cause | Typical Fix |
|---|---|---|
| Minor Stops | Sensor misalignment or material jam pattern | Targeted maintenance on the specific station |
| Speed Loss | Operator running conservatively after past jams | Retraining paired with process stabilization |
| Changeover Time | Unstandardized changeover sequence | Standardized, timed changeover procedure |
| Startup Rejects | Inconsistent warm-up or purge procedure | Defined startup checklist with verification |
What Plant Managers Are Saying
We were convinced our biggest loss was breakdowns, since those were the events everyone remembered and complained about. Once we had real data, minor stops turned out to be costing us nearly twice as much OEE over a month, and fixing that one sensor issue moved our number more than any maintenance project we'd done in the past year.
Plant Manager, Beverage Bottling and Canning Facility
Frequently Asked Questions
How is OEE calculated, and why does it differ from what we track manually?
OEE is calculated as availability multiplied by performance multiplied by quality, and the accuracy of that number depends entirely on how continuously and precisely each component is measured. Manual tracking typically estimates availability from shift-end logs and performance from a rough sense of expected output, which introduces error in both directions. Continuous machine-level data removes that estimation, which is why many plants see their true OEE number shift, usually downward at first, once real-time measurement replaces manual tracking.
Which of the Six Big Losses should we tackle first?
The right starting point depends entirely on your own data rather than a generic industry assumption, since the loss category costing the most OEE varies significantly between plants and even between lines within the same plant. This is exactly why automated categorization matters: rather than guessing based on which losses feel most memorable, the data shows which category is actually consuming the most OEE over a meaningful measurement period, so improvement effort goes where it has the biggest impact.
How long does it take to see a measurable OEE improvement?
Most plants see their first measurable OEE gain within four to eight weeks of go-live, once the largest loss category is identified and the first corrective action is implemented. Continued improvement typically follows a step pattern, with gains as each successive loss category is addressed, rather than one large jump. Plants coming from manual OEE tracking often see the fastest initial movement, since accurate measurement alone frequently reveals a category of loss that was previously invisible.
Does this require new sensors on every machine in the line?
Not necessarily. Most modern PLCs and line controllers already generate enough data to calculate availability and performance losses without additional hardware, so the initial gap is usually in the analytics layer rather than the sensors themselves. Quality loss tracking sometimes requires connecting existing inspection or reject systems that are not yet feeding into a central data platform. A short data audit typically identifies exactly where the gaps are before any hardware spend is committed. Teams can review their own setup through support.
What kind of OEE gain is realistic for a typical food or beverage plant?
Plants starting from a purely manual measurement process and moving to real-time, automated OEE tracking commonly see gains in the range of ten to fifteen percentage points within the first year, though the exact number depends heavily on starting maturity and which loss categories dominate. The fastest early wins usually come from addressing minor stops and speed losses, since these are the categories most often underestimated by manual tracking. Plant managers can book a demo to get an improvement estimate scoped to their own line data.
OEE IMPROVEMENT · FOOD & BEVERAGE LINES
Stop Guessing Which Loss Is Costing You Most
Join food and beverage manufacturers already closing the gap toward world-class OEE with real-time loss tracking.