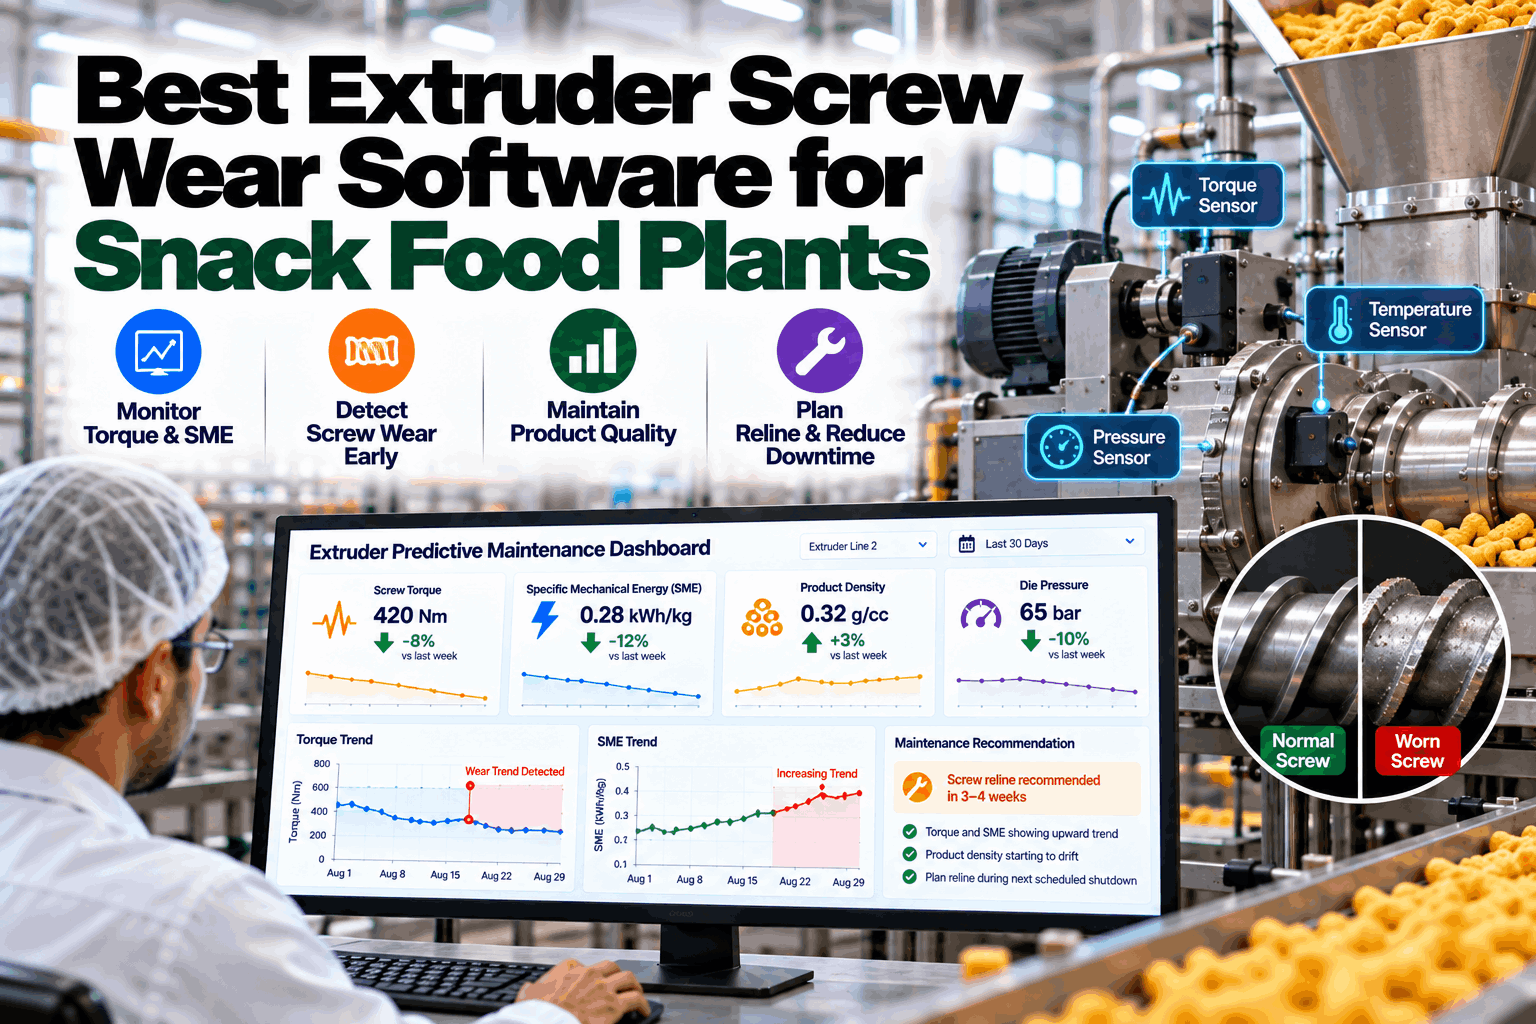
Extruder screws do not fail in a day. They lose a little efficiency every shift as flights, kneading blocks and barrel liners wear, and the line quietly compensates: a few more rpm here, a little less water there, a slightly different bulk density that QC accepts. By the time output drops noticeably, the screw set may be well past its economic life and the reline has become an emergency. Tracking torque, specific mechanical energy and product density together turns that slow slide into a forecast, so relines are planned months ahead. This article shows how snack and cereal plants do it, and our engineers can apply it to your extruders.
Extruder Screw Wear Monitoring for Snack and Cereal Plants: Torque, SME and Density Trends for Reline Planning
Specific mechanical energy, output per rpm and product density tracked on every run, so screw and barrel relines are scheduled, not forced.
Why Screw Wear Hides Until It Hurts
Snack and cereal extruders, most often co-rotating twin-screw machines, cook and shape product through a sequence of conveying elements, kneading blocks and a die. Ingredients such as bran, whole grains, minerals and some flavour systems are abrasive, and moisture and temperature accelerate wear. As clearances between flights and barrel grow, more product slips back instead of moving forward, the mechanical energy put into the product changes, and the extruder needs different settings to make the same product.
Operators are good at compensating, and that is the problem. Each small adjustment hides a little more wear, until one day the line cannot reach its rate or its bulk density target without an emergency reline. Tracking the right signals continuously makes the hidden wear visible. A short pilot on one extruder is usually enough to show the trend.
Specific Mechanical Energy: The Extruder’s Vital Sign
Specific mechanical energy (SME) is the energy per kilogram that the drive delivers through the screws into the product. It is one of the most important numbers in food extrusion because it shapes cooking, expansion and texture. Plastics Technology describes SME as the energy per unit mass transferred from the extruder drive motor through the screws into the material being processed, and notes that matching SME helps ensure product quality.
Illustrative numbers. On a stable recipe, SME should hold steady at fixed settings. When kneading blocks and flights wear, less energy is transferred at the same screw speed and feed rate, so SME drifts down, and operators often push speed or reduce water to recover it. Trending SME against the settings that produced it separates wear from normal adjustment. Our specialists can calculate it from your drive data.
The Wear Signals That Matter, and What They Mean
| Signal | How wear shows up | What else can cause it | How to separate them |
|---|---|---|---|
| Output per rpm (specific rate) | Falls as clearances grow and product slips back | Feeder changes, recipe changes | Compare on the same recipe and feed settings |
| SME at constant settings | Drifts, usually down, as kneading and conveying efficiency fall | Moisture, temperature, raw material variation | Normalize for moisture, barrel temperature and ingredient lot |
| Die pressure | Falls at the same rate and speed | Die changes, blockages | Track per die set and recipe |
| Discharge or melt temperature | Rises as more product recirculates in worn clearances | Barrel heating changes | Compare with barrel zone setpoints |
| Product bulk density | Drifts as expansion changes | Recipe, moisture, dryer settings | Link QC density checks to extruder state |
| Torque ripple and vibration | Rises with element damage or bearing wear | Feed surges | Frequency analysis and feed-rate context |
Plastics Technology identifies reduced specific rate and higher discharge temperatures as the two main signs of screw and barrel wear, which is why output per rpm and temperature sit at the top of the table. Seeing all six on one timeline takes a short demo.
The Detection Window for Screw and Barrel Wear
Because screw wear develops over months, the goal is not a sudden alarm but a forecast: at the current rate of change, when will clearances reach the point where rate, quality or energy use become uneconomical? That date is what lets planners order screw elements and liners, book the shutdown and avoid an emergency reline. We can show you a forecast built on historical data.
Product Density as a Maintenance Signal
For expanded snacks and cereals, bulk density is one of the most important quality measures. It is also a sensitive wear signal. As screw elements wear and energy transfer changes, expansion changes, and density drifts. QC catches it, adjusts the process and moves on. What rarely happens is connecting that density drift to the state of the screw.
When QC density checks, SME, output per rpm and die pressure sit on one timeline, the picture changes. A gradual density drift that coincides with falling specific rate is wear, not a raw material problem, and the corrective action is a reline plan, not another recipe tweak.
Linking QC and machine data is one of the first things our team sets up.
Planning Relines From Data, Not Guesswork
Extrusion practice offers practical replacement guidelines. Plastics Technology notes that new flight clearance is typically about the nominal screw diameter divided by 1,000, and describes three common triggers for replacement: when clearance reaches about four times the original, when hard facing has completely worn off, or when rate loss and temperature rise become uneconomical. Twin-screw food extruders have their own maker guidance, but the logic is the same.
Record element and liner clearances when the extruder is opened, so the model has physical measurements to calibrate against.
Output per rpm, SME and die pressure estimate wear progress continuously between measurements.
The rate of change projects when clearance or performance will cross your replacement threshold.
Screw elements, liners and specialists are booked for the planned shutdown before the threshold.
Specific rate, SME and density return to their new-screw baseline, which becomes the next reference.
This turns relines into a planned budget line rather than an emergency purchase. Our engineers can build the first forecast from your records.
Gearbox and Thrust Bearing Health
Twin-screw extruders transmit high torque through a gearbox with a heavily loaded thrust bearing that carries the axial force from die pressure. These components fail far less often than screws, but when they do, repairs are long and costly. Vibration at gear mesh and bearing frequencies, oil temperature and oil analysis give weeks or months of warning.
Rising gear mesh energy or bearing defect frequencies flag wear early, especially when compared across similar extruders.
Die pressure history and bearing temperature together show how hard the bearing is working.
Oil temperature trends and periodic oil analysis catch contamination and breakdown.
Drive train models run alongside wear models, so a torque change is attributed to the right cause. Ask our specialists how the two are separated.
From Wear Trend to Reline Work Order
- Relines triggered by rate loss or quality complaints
- Parts ordered in a hurry, often at premium prices
- Operators compensate for wear until they cannot
- No link between QC density data and screw condition
- Relines scheduled from a projected threshold date
- Parts and labour booked weeks in advance
- Adjustments tracked as evidence of wear
- Density, SME and rate on one timeline
See a forecast on your own extruder in a guided session.
How iFactory Solves Extruder Wear
Calculated continuously from drive and feeder data, normalized for recipe and moisture.
Die pressure and discharge temperature tracked per recipe and die set.
Bulk density results aligned with extruder state and operator adjustments.
Projected threshold dates calibrated with shutdown clearance measurements.
Gearbox, thrust bearing and lubrication models.
Reline work orders, parts lists and verification after restart.
It works across extruder makers because it reads drive, feeder and QC data you already collect. Confirm your setup with our team.
See the Wear Trend Inside Your Extruder
Share several months of drive, feeder and QC density data. We calculate SME and specific rate, show the wear trend and project when your next reline is due.
Specific mechanical energy is falling at the same recipe and rate, and bulk density is drifting toward the upper limit.
How Deployment Works
iFactory ships as a pre-configured NVIDIA AI server, racked and ready with the extruder wear models loaded. Rack it, plug in power and Ethernet, and the AI is live on your network. Our scope covers sensor and PLC/SCADA integration, cabling and network setup, operator and technician training, and 24×7 remote monitoring.
Server installed, sensors and controllers connected, historical work orders and failure history loaded.
Baselines learned per asset, alerts piloted on the first line with your maintenance team reviewing every finding.
Rollout to the agreed assets, technician training, CMMS hand-off and 24×7 remote monitoring in place.
Most snack and cereal plants start with the extruder that runs the most abrasive recipes, because it wears fastest and gives the model the clearest signal. Historical drive and QC data often allow a first forecast within the first weeks. Plan it on a scoping call.
What Planned Relines Are Worth
The biggest saving is often not the reline itself but the capacity and quality lost in the months before it. Your figures can be modeled with our specialists.
Frequently Asked Questions
By trending output per rpm, specific mechanical energy, die pressure, discharge temperature and product density on the same recipe and settings. Together they show wear progress between shutdowns. See it in a demo.
The energy per kilogram delivered by the drive through the screws into the product, calculated from rated motor power, percent torque, screw speed ratio and mass flow. It shapes cooking and expansion. Our engineers can calculate yours.
Common guidelines are when clearance reaches about four times the original, when hard facing has worn off, or when rate loss and temperature rise become uneconomical. Follow your extruder maker’s guidance for twin-screw elements. Ask for a forecast.
Worn elements transfer energy differently, which changes cooking and expansion. Operators compensate with speed or water changes, which hides the wear. Linking density with SME reveals it. Talk to our team.
Yes. Vibration at gear mesh and bearing frequencies, oil temperature and die pressure history give weeks or months of warning. See the drive models.
Often within the first weeks, using historical drive and QC data. Typical full programs go live in 6–12 weeks. Plan it with our support team.
Know Your Next Reline Date Months Ahead
iFactory tracks SME, output per rpm and product density on every run, then turns slow screw wear into a planned reline in your next scheduled shutdown.
Wear is tracked from torque, SME and product density against the same recipe baseline.