A bottling or canning line running at 1,000 units per minute loses seventeen containers every second it is not moving, which means a stoppage too short for an operator to even write down has already cost a full case of finished product. That arithmetic is why OEE measurement built for slow discrete assembly quietly fails in beverage plants: the losses that matter most are shorter than the reporting interval designed to catch them. High-speed lines do not usually fail through dramatic breakdowns, they bleed through thousands of micro-stops, speed derates, and jam cascades that never appear on a shift report. Recovering that hidden output starts with capturing loss at machine speed rather than at clipboard speed, and if you want to see what that looks like on your own filler and seamer data, book a demo.
BEVERAGE PACKAGING · HIGH-SPEED OEE · MICRO-STOP ANALYTICS
At 1,000 Units a Minute, the Losses You Cannot See Are the Ones That Cost the Most
iFactory captures bottling and canning line loss at PLC resolution — every micro-stop, jam, derate, and reject tied to the machine, transfer point, and SKU that caused it, so the hidden factory inside your line finally becomes measurable.
17
Containers lost per second of downtime at 1,000 UPM
<2 min
Duration of the stops most manual systems never record
60k
Units of output in a single lost hour of filler runtime
THE SPEED PROBLEM
Why High-Speed Packaging Breaks Conventional Loss Reporting
Most downtime systems in beverage plants were designed around a human being noticing a problem, deciding it was significant, and writing a reason code against it. That workflow is reasonable on a line producing forty units a minute. It collapses entirely on a line producing a thousand.
What One Stoppage Actually Costs at Line Speed
Calculated at a nominal 1,000 units per minute. The first two rows are the durations almost never logged manually, yet they occur most frequently.
The distortion this creates is not small. A line that records forty minutes of logged downtime in a shift may have actually lost closer to two hours once the unlogged micro-stops, restart ramp times, and sustained speed derates are counted. Improvement teams then spend their effort on the forty minutes that got written down, because that is the only loss the data makes visible.
The core measurement gap
Manual reporting captures loss by exception. High-speed packaging loses output continuously. Any system that only records what someone decided was worth recording will systematically under-report the largest loss category on the line.
LOSS TAXONOMY
The Six Loss Families That Dominate Bottling and Canning Lines
Classic Six Big Losses translate to beverage packaging, but the specific failure behaviours behind each one look very different from discrete assembly. Naming them precisely is what makes them addressable.
01
Micro-Stops and Chronic Faults
Fallen containers at transfer points, single-can jams in a rinser infeed, star wheel hesitations, photo-eye false trips. Individually trivial, collectively the largest availability loss on most mature lines.
02
Speed Derate and Soft Running
The line runs, but at 82% of nameplate because an operator reduced speed to stop a recurring jam. It never registers as downtime, yet it is often the second largest loss in the entire OEE calculation.
03
Changeover and Format Loss
SKU, flavour, can diameter, and label format changes, including the ramp-up period after restart where the line runs unstable and produces rejects before settling into steady state.
04
Starvation and Blocking
The filler stops because empties did not arrive or because the palletizer backed up. The fault is not at the constraint, but the lost production is measured there, which routinely misdirects corrective effort.
05
Quality Rejects and Rework
Fill height failures, cocked caps, low seam tightness, label skew, illegible date codes. Each rejected container consumed full filler capacity before being discarded downstream.
06
Giveaway and Yield Loss
Systematic overfill to stay safely above declared volume. It never shows in OEE at all, yet it converts directly into product cost that a well-instrumented filler can measurably reduce.
The last category deserves particular attention because it is invisible to OEE by definition. A line can post an excellent OEE score while giving away two millilitres per container across a million containers a week, which is why loss capture in beverage plants should extend beyond the three OEE factors into yield and material consumption.
See how much output your line is losing below the reporting threshold
iFactory connects to your existing filler, seamer, and conveyor controls to quantify micro-stop loss, derate loss, and reject loss over a real production week — before you commit to anything.
JAM ANALYTICS
A Jam Is Rarely an Event — It Is Usually the End of a Chain
Operators experience a jam as a single moment: containers pile up, the line halts, someone clears it. The data almost always shows something different. A jam is the visible end of a sequence that began somewhere upstream, often several seconds and several machines earlier.
Stage 1
Upstream Condition Drifts
Conveyor accumulation pressure rises, a guide rail is marginally out of position, or container back-pressure at a transfer builds beyond its normal band.
Stage 2
A Single Container Destabilises
One light can tips at a merge or a bottle rotates out of orientation. Nothing stops yet, but the flow geometry through that transfer is now compromised.
Stage 3
Cascade Forms Within Seconds
At line speed, hundreds of containers arrive behind the obstruction before any sensor logic can react, converting a single tipped unit into a physical pile-up.
Stage 4
Buffer Depletes, Constraint Stops
Accumulation absorbs the first interval. Once it empties, the filler starves and the loss finally appears in production data — attributed to the filler, not the transfer point.
This is the single most important insight in high-speed loss capture. Because accumulation conveyors are designed to decouple machines, the location where production loss is recorded is frequently not the location where the fault occurred. Attribution has to be reconstructed from time-sequenced machine states, not inferred from wherever the output counter stopped incrementing.
Chronic vs Acute
A transfer point causing eleven two-second jams per shift costs more than a twenty-minute mechanical failure, but only one of them generates a work order.
Repeat Offender Mapping
Ranking jam frequency by physical location converts vague complaints about "the line being jammy" into a prioritised list of three or four specific fixes.
SKU Correlation
Many chronic jams are format-specific. Tying every jam event to the SKU running at the time usually reveals that a minority of formats generate most of the instability.
MEASUREMENT DESIGN
Where to Measure OEE on a Line With Twelve Machines and Four Buffers
A packaging line is not a single asset, and calculating OEE for every machine independently produces twelve numbers that do not add up to anything a plant manager can act on. The convention that works is to define line OEE at the constraint while still capturing state data everywhere else.
Instrumenting every machine while reporting OEE at one point is not redundancy, it is the only way to answer both questions a packaging team needs answered: how much did we lose, and where did it actually come from.
THE HIDDEN GAP
What Changes When Loss Capture Moves From Clipboard to Controller
The difference between manually reported OEE and sensor-captured OEE is usually large enough to be uncomfortable the first time a plant sees it. The point of showing it is not to discredit the old number, it is to expose the recoverable output the old number was concealing.
Manual Shift Reporting
Stops recorded only above an operator's mental threshold, typically two to five minutes
Reason codes chosen at end of shift from partial recollection
Speed derates almost never captured as a loss at all
Attribution assigned to the machine that visibly stopped
Reported OEE typically overstated by a wide, unquantified margin
Controller-Level Capture
Every state change recorded at sub-second resolution, no minimum duration
Reason codes auto-assigned from machine fault words, operator confirms
Actual running rate compared continuously against nameplate
Attribution reconstructed from time-sequenced states across the full line
Reported OEE reconciles to the case count leaving the palletizer
Plants frequently discover that their real constraint was never the machine they assumed. A line believed to be filler-limited turns out to be limited by a depalletizer that stalls briefly forty times a shift, each stall short enough that nobody had ever considered it a problem worth reporting.
RECOVERY SEQUENCE
A Practical Order of Operations for Recovering High-Speed Loss
Once accurate loss data exists, the temptation is to attack everything at once. A sequenced approach works better because each stage narrows the problem set for the next one and produces a visible win that sustains internal support.
1
Establish the Real Baseline
Run two to three weeks of automated capture without changing anything on the line. The objective is a trusted number, not an immediate improvement, and resisting intervention during this window matters.
2
Rank Loss by Recoverable Minutes
Sort every loss category by total minutes lost, not by event count or by how annoying it feels. Chronic micro-stops usually rise to the top of this list for the first time.
3
Fix the Top Three Physical Locations
Most chronic jam loss concentrates at a handful of transfers, merges, and infeeds. Guide rail geometry, timing screws, and back-pressure tuning resolve a surprising share of it without capital spend.
4
Recover Speed Instead of Hiding Behind It
With jam sources fixed, systematically return the line toward nameplate speed in controlled increments, watching whether loss reappears. Derate recovery is often the fastest output gain available.
5
Attack Changeover as a Measured Process
Break each format change into timed steps captured automatically, then separate genuine mechanical adjustment time from waiting, fetching, and post-restart instability.
6
Close the Loop on Quality and Giveaway
Tie reject and fill-volume data back to the machine and SKU that generated it, converting quality loss from an end-of-line count into an upstream corrective signal.
Each stage of this sequence produces a result that can be shown to a leadership team within weeks, which matters as much as the technical work itself. Programmes that promise a single combined benefit at the end of a long deployment are far harder to keep funded than ones that demonstrate recovered cases after the first month.
PLATFORM DELIVERY
How iFactory Captures Loss on a Running Beverage Line
Deployment is designed to sit alongside existing controls rather than replace them, because no beverage plant is willing to trade production risk for visibility during peak season.
Data Acquisition
Direct polling of existing PLC and drive tags across filler, seamer, capper, labeler, coder, and conveyors
PackML state model mapping where available, custom state logic where it is not
Sub-second sampling so micro-stops shorter than the manual threshold are recorded natively
Optional vision and sensor additions only where existing signals cannot resolve a specific loss
Analytics and Output
Automatic fault attribution across machines using time-sequenced state reconstruction
Jam frequency heat ranking by physical location, shift, SKU, and container format
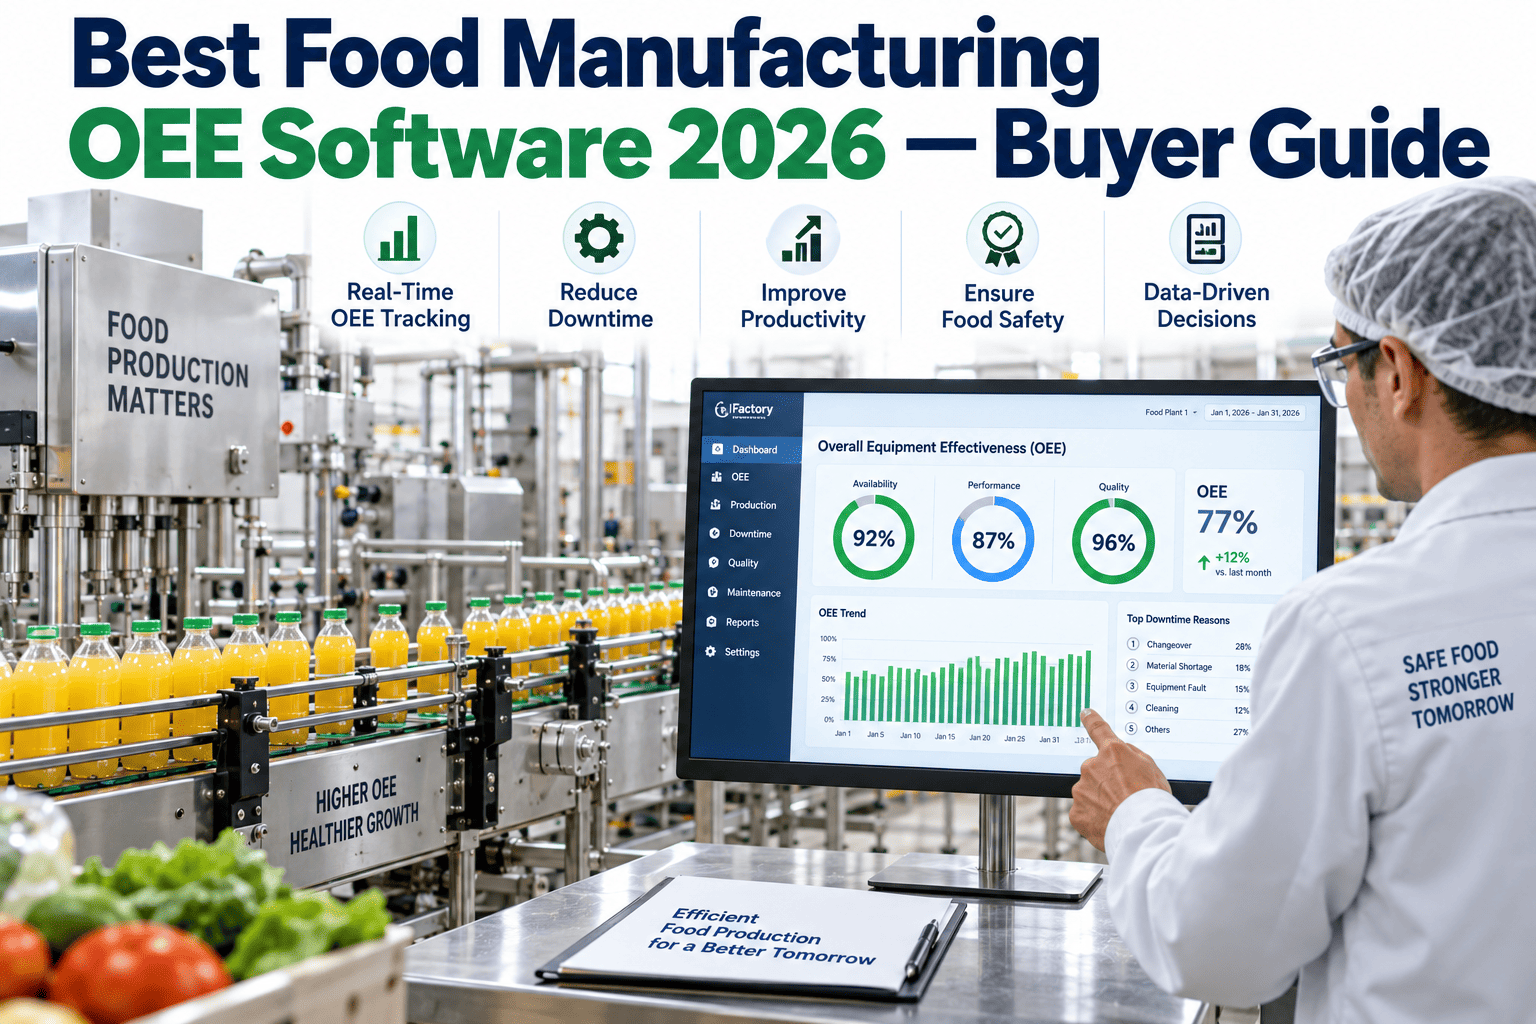
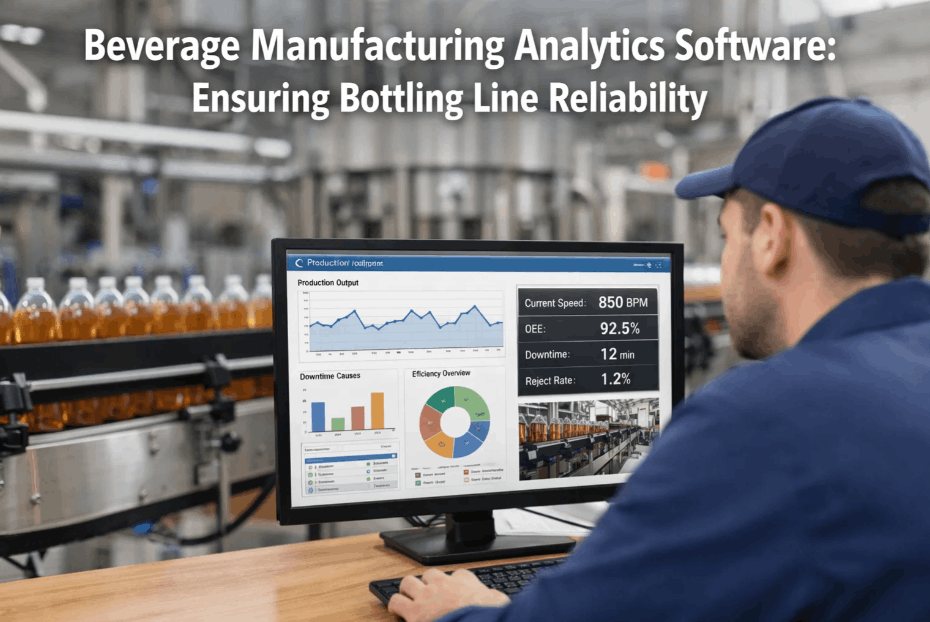
Live line OEE at the constraint with full loss decomposition beneath it
Changeover timing breakdown and derate tracking against nameplate rate
Operational Fit
Floor display designed for glance-level reading at line speed, not deep navigation
Operator confirmation of auto-assigned reason codes rather than manual entry from scratch
Reconciliation against palletizer case counts so reported numbers survive scrutiny
Export paths into existing MES, ERP, and reporting environments already in use
The measure of success is not the dashboard. It is whether a packaging manager can walk onto the floor on Monday morning knowing exactly which three transfer points to address that week, and can prove the following Monday that the loss actually went down.
FREQUENTLY ASKED QUESTIONS
What Beverage Packaging Teams Ask About High-Speed OEE Capture
Our current OEE number comes from the MES already — why would we need anything else?
Most MES-sourced OEE on packaging lines is built from shift-level counts and manually entered downtime, which means it inherits the same reporting threshold problem described above. The number itself is not wrong so much as incomplete, because it cannot decompose loss below the resolution of its inputs. Controller-level capture typically sits underneath the MES rather than replacing it, feeding it better data.
Book a demo to compare your current reported figure against a sensor-captured one on the same line.
Will connecting to our PLCs create any risk to a line running during peak season?
Data acquisition is read-only and passive, polling existing tags without writing to control logic or altering machine behaviour in any way. Connection work is scoped to fit within planned sanitation or changeover windows so no additional production time is consumed. Plants routinely complete initial acquisition on a live line without a dedicated shutdown.
Reach our support team to review the specific control architecture on your line before anything is scheduled.
How much of our chronic micro-stop loss is realistically recoverable?
Recoverability varies with line age, format mix, and how much of the loss traces to mechanical geometry rather than inherent process limits, so a credible answer requires looking at your actual data rather than quoting an industry average. What is consistent is that chronic micro-stops concentrate heavily at a small number of physical locations, which makes the first tranche of recovery unusually cheap.
Book a demo to get a location-ranked estimate based on a real production week.
We run many SKUs and formats — does that make this harder to implement?
High SKU variety makes the analysis more valuable rather than more difficult, because format-specific instability is one of the clearest patterns automated capture reveals. Every loss event is tagged with the SKU, format, and changeover context in effect at the time, which lets you separate a genuinely problematic machine from a machine that only struggles with two particular container formats.
Contact support to discuss how your format matrix would be modelled.
How long before we see results rather than just better reporting?
The baseline window intentionally produces reporting rather than improvement for the first two to three weeks, because acting on partial data undermines the credibility of everything that follows. Beyond that point, the top-ranked chronic loss locations usually become actionable immediately, and the first physical fixes tend to land within the following few weeks.
Book a demo to map a realistic timeline against your line and production calendar.
STOP LOSING OUTPUT BELOW THE REPORTING THRESHOLD
Find the Hidden Hours Inside Your Bottling and Canning Lines
iFactory captures every micro-stop, jam, derate, and reject at machine speed, attributes each one to the place it actually came from, and turns your packaging loss into a ranked list of fixes your team can work through this month.